Almost 40 years ago, the distinguished social scientist Harold Wilensky declared the United States a “reluctant welfare state” (1965, xii). In the decades since, many observers have reached essentially the same conclusion: the United States has been called a semi-welfare state, a welfare state laggard, a residual welfare state, an incomplete welfare state, and similar terms denoting inadequacy (e.g., Jansson 2001; Katz 1986; Kudrle and Marmor 1981; Sainsbury 1996; Skocpol 1995). For their part, contemporary studies of American exceptionalism routinely note the shortcomings of the American welfare state when highlighting the limited reach of American government (Kingdon 1999; Lipset 1996; Wilson 1998). Introductory textbooks about American government often convey the same message (Greenberg and Page 1999; Wilson and DiIulio 2001). Consensus on this point has become so complete that few people have stopped to question its accuracy. The more common pattern has been to assert the existence of an underdeveloped welfare state and then move on quickly to explain why the U.S. is so different, or to call for a more generous welfare state.
In this article, I challenge the most commonly made claim about the exceptional nature of the American welfare state—that it is unusually small (e.g., Gilens 1999; Jansson 2001; Kudrle and Marmor 1981; Wilson 1998). This judgment, in my view, is misleading. It is based on an overstatement of the social benefits received in other nations and an underestimate of the social benefits distributed by the United States. The latter results from a narrow focus on just two tools of government action, social insurance and grants, and from a misleading measure of welfare state effort. In fact, the American welfare state is bigger than most people think.
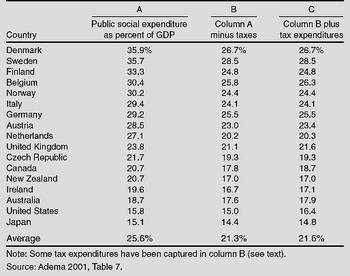
The prevailing wisdom is easy to summarize. The size of welfare states is measured in the literature by the share of gross domestic product (GDP) devoted to public social spending, which is sometimes referred to as a nation's welfare state effort. The United States devoted 15.8% of its GDP to public social expenditure in 1997 (Adema 2001). This figure includes spending by all levels of government on retirement and survivors' pensions, disability, sickness, occupational injury and disease, public health, family allowances, a wide range of social services, housing, unemployment, job training, and aid to the poor. While that may seem like a lot of effort, Denmark, Sweden, and Finland devoted 33% or more of their GDP to public social spending. Several other European nations spent 25–30%. The obvious conclusion, and the one conveyed in much of the cross-national literature, is that many affluent democracies are putting almost twice as much effort into their welfare states as the United States. Even among nations such as Canada (20.7%) and the United Kingdom (23.8%) that are often categorized as low spenders, it seems clear that the American welfare state is unusually small.
Money Spent, Benefits Received
The source of these figures is the Organisation for Economic Co-operation and Development (OECD), whose professional staff collect statistical data from member countries and publish a steady stream of useful cross-national comparisons. In recent years, the OECD has started to modify its social expenditure figures, though you would be hard pressed to find the new calculations in studies of the American welfare state (but see Hacker 2002). One important change has been to account for the fact that social benefits can be taxed, often at quite high rates. Suppose country X gives the average retiree a pension of $1,000 each month, but counts the pension as income and taxes it at a rate of 25%. The net benefit received is $750. Country Y gives out a smaller pension, say $800 each month, but does not subject any of it to income taxation. Which country has the larger retirement program? (Hint: it's not X.) Similarly, many countries impose consumption taxes, which vary in size and scope; in Europe they might be called valueadded taxes, in the U.S. a sales tax. These indirect taxes also reduce the amount of money that retirees (and beneficiaries of other social programs) actually have to spend. Normatively, it seems to make more sense to compare how many benefits actually stay with citizens than how much money governments initially distribute.
The extent of direct and indirect taxation varies quite a bit among the OECD nations. Table 1 shows that taxation of benefits alters our perception of welfare state laggards and leaders. Column A of the table lists the standard measure of welfare state effort, discussed previously, while column B adjusts that figure for direct and indirect taxation. We now see that social benefits received do not exceed 30% of GDP in any of these countries. Spending in Denmark drops dramatically from 35.9 to 26.7% of GDP, and in Sweden from 35.7 to 28.5%. In effect, Scandinavian governments tell their citizens, “I'll spend a dollar on your social welfare as long as you give me 25 cents back.” The 17-country average drops substantially from 25.6 to 21.3%, and countries tend to converge toward the mean.1
One quick way to measure the extent of clustering or spread in the data is to calculate the coefficient of variation (CV), which is the standard deviation divided by the average. The smaller the CV, the more tightly bunched are the data. The CV for column A is .26 and for column B is .21.
The big spenders in column B would rank only as average spenders in column A.
Because we know that taxes in the United States tend to be lower than in Europe, some adjustment for taxation of social benefits should make the American welfare state seem less exceptional. With taxes factored in, the American welfare state shrinks a little, from 15.8 to 15.0 percent of GDP. The U.S. still ranks at the bottom of the list, but is not quite so far from the average nation. Whereas the American welfare state once appeared to be about 60% as large as the average OECD welfare state (column A), it now appears to be 70% as large. The gap between the U.S. and the other low spending countries is also narrower.
Other Policy Tools
A second change in the OECD figures has been prompted by a broader, and I think more accurate, perspective on how governments spend money. The normal method has been to count only direct social spending benefits paid on a weekly or monthly basis to retirees, the unemployed, the poor, and the like. Such spending comes either from social insurance programs like Social Security and Medicare or grants programs like Food Stamps. One problem with this method is that it misses the ways in which governments spend money indirectly, through special provisions in the tax code. The technical name for this tool is tax expenditures, which are departures from the normal tax system that are designed to promote some socially desirable objective.2
As a general rule, those who like this tool commonly refer to it as tax incentives, and those who dislike it speak of tax loopholes.
The United States, for example, uses tax deductions to promote home ownership and tax credits to subsidize child care expenses. To enhance retirement income, the U.S. excludes most Social Security benefits from income taxation, which is another kind of tax expenditure.
In some quarters, tax expenditures are not equated with direct spending. They are viewed simply as a way to let taxpayers keep more of their own money. Since the 1970s, however, the U.S. government has formally recognized tax expenditures as a form of spending, and other OECD governments have followed suit. The tax expenditure concept is widely accepted among public finance experts as well. The rationale is that with tax expenditures, the government is essentially collecting what taxpayers would owe under the normal tax system and simultaneously cutting some taxpayers a check for behaving in certain desired ways, like buying a home. In a “pure” system, everyone with the same income would pay the same amount of income tax. In the real world, people with the same income often do not pay the same because some are able to take advantage of tax expenditures while others are not.
Although the U.S. tax code has many tax expenditures aimed at specific industries and business in general, most of the spending goes to tax expenditures with social welfare objectives. The big ticket items are tax subsidies to employers who offer retirement pensions and health insurance to their workers, and a variety of tax subsidies to homeowners. These tax expenditures serve the same social welfare functions mentioned earlier in the chapter. In a previous book I summed up spending on tax expenditures with social welfare objectives and found that they cost roughly $400 billion in 1995 (Howard 1997). Adding them to more direct forms of social spending increased the size of social spending at the national level by almost 50%. Suddenly, the American welfare state did not look so small anymore.3
Whether ordinary citizens think of tax subsidies and direct subsidies as equivalent tools of social policy is an important but separate point. My argument relates to the definitions adopted by governments and professional analysts.
At the time, I knew that other welfare states used tax expenditures as well, but I had no fair or accurate way to compare them. Some evidence suggested that the U.S. relied more heavily on tax expenditures than other nations, which would have made the true size of its welfare state seem less exceptional, but there was no way to know for sure. I am happy to report that comparable figures are now available, care of the OECD (Adema 2001).4
These figures reflect tax expenditures at the national level. Comparable data from the sub-national level, such as the American states or Canadian provinces (which do offer their own tax expenditures), are not yet available.
I am less happy to report that the OECD does not display those figures in one place when calculating net social expenditure. Some tax expenditures, such as the exclusion of most Social Security benefits from income taxation, have been accounted for in column B (
Table 1). What remain in column C are tax expenditures such as the Earned Income Tax Credit that parallel traditional income transfers and, more importantly, tax expenditures that encourage employers to offer benefits like retirement pensions and health insurance to their workers. As a result, the figures in column C understate the true impact of tax expenditures. But, since tax expenditures with social welfare objectives are included either in column B or C, the resulting figures in C are meaningful and a definite improvement over those in column A.
The OECD countries vary in their use of tax expenditures to promote social welfare objectives. In several countries the figures in columns B and C are identical. Most of the increase is due to change at the bottom of the list, which in turn means more convergence among nations. Spending figures in Canada and especially the United States are up. Now it appears that 16.4% of GDP in the United States consists of social benefits that are paid directly or indirectly by the government and that stay in recipients' pockets. The overall average increases slightly from 21.3 to 21.6%. The American welfare state is now 75% as large as the average for all 17 nations. Another way to appreciate the change is to compare the U.S. to the classic big spending welfare state, Sweden. If you look only at pre-tax direct spending (column A), you would say that the Swedish welfare state was 2.3 times the size of the American welfare state. If you look instead at post-tax direct and indirect social spending (column C), you would say that the Swedish welfare state was 1.7 times larger.5
For more in-depth analysis of tax policy in the U.S., U.K., and Sweden, see Steinmo 1993.
The evidence so far suggests that claims about the small size of the American welfare state need to be toned down but not abandoned. Welfare states are actually more alike than they first appear, but as a general rule no matter which column you examine in Table 1, the big spenders are in Scandinavia, the average spenders are in continental Europe, and the low spenders are the former British colonies (Australia, Canada, Ireland, the U.S.). Except for Japan, the United States always ranks at the bottom.
Nevertheless, once we realize that governments spend money in two different ways, directly and indirectly, we start to think about other tools of government. Regulation is one of the most important of these other policy tools. Governments in several European countries mandate that employers create retirement pensions for their employees. While the money for such pensions does not flow through government accounts, the pensions are the direct result of government action. In the United States, the vast majority of employers are required to pay into a workers' compensation fund, and most of those funds are run by private insurance companies or employers themselves (i.e., self-insurance).6
Similar arrangements exist in Australia, Austria, Belgium, Denmark, Germany, the Netherlands, Norway, Sweden, and the UK (Adema 2001).
Estimating the cost of such publicly mandated, private social expenditures is admittedly difficult, and any figures must be taken with a grain of salt. In the nations listed in
Table 1, the addition of such spending, net of taxes, would raise the welfare state effort figures of individual countries by 0–1% of GDP (
Adema 2001). The basic portrait would remain unchanged. Such spending would increase the overall average of welfare state effort to 22.1% of GDP and the U.S. figure to 16.8%, which is still more than three-quarters of the average. The U.S. would be ahead of Japan and more or less tied with Ireland and New Zealand.
These figures undoubtedly understate the importance of regulatory approaches to social welfare. They capture only those forms of regulation that can be translated readily into spending figures. Missing, for example, are minimum wage laws, which are used throughout the world to raise the incomes of the poor and near-poor. In the United States, these laws affect millions of workers and are routinely linked in policy debates to welfare reform and poverty. The current U.S. minimum wage of $5.15 per hour is slightly above the European Union average (Mercer Human Resource Consulting 2001). Again, the American welfare state looks less unusual.
Arguably one of the most important pieces of U.S. social legislation passed in the last 20 years is the Americans with Disabilities Act (ADA) of 1990. The basic intent of ADA is to make it easier for the disabled to enter the labor force and become self-sufficient. The scope of the law is very broad, potentially affecting tens of millions of disabled people, millions of public accommodations, hundreds of thousands of employers, and tens of thousands of state and local governments. Everyday examples include elevators, ramps, and specially designed bathrooms. One estimate put the “total cost of accessibility standards for office buildings alone at $45 billion. The American Hospital Association estimates its costs at $20 billion” (Burke 1997, 284). Several billion dollars were needed to comply with new rules governing public transit systems and sidewalks. In contrast, many European governments give employers direct subsidies to hire the disabled and make necessary changes in the work environment (Burke 1997). Those subsidies show up in international comparisons of welfare state effort whereas U.S. regulations do not.
Loan guarantees are an essential component of U.S. housing policy. Through this tool, the U.S. government enables individuals with little income, few assets, or a poor credit history to qualify for mortgage loans offered by private lenders. As of 1999, the Federal Housing Administration (FHA) had more than $400 billion worth of home loans outstanding, covering more than five million homes. By way of comparison, the two major forms of direct spending, public housing and Section 8 vouchers, serve between four and five million recipients. The FHA has helped over 30 million families become homeowners 1930s. It currently plays a crucial role in helping racial minorities qualify for home loans. The Veterans Administration and Department of Agriculture operate similar, albeit smaller, loan guarantee programs designed to promote home ownership (Office of Policy Development and Research 2000; U.S. Census Bureau 2001; U.S. Office of Management and Budget 2000). In the European Union, such government guarantees appear to be in violation of the EC Treaty because they privilege lenders in one country over another and thus impede the creation of a single, unified credit market (Fairlamb 2001; Soukup and Moser 2001).
Finally, consider tort law. In European welfare states, those who are injured look to the government for medical care and replacement income. They can tap into some public fund. In the United States, those who are injured may, depending on their circumstances, be able to tap into a publicly funded program like Medicare or Medicaid, a publicly mandated but privately financed program like workers' compensation, a disability policy offered voluntarily by their employer—or they can sue the bastards who caused their injury. This last option is quite popular. In their cross-national study, Kagan and Axelrad (1997, 171) have noted that the United States “relies on lawsuits rather than social insurance … for injury compensation” much more than in Europe. The combination of legal costs, claims administration, and monies awarded by the courts to injured persons has been estimated to consume at least twice as large a share of GDP in the U.S. compared to other OECD countries.
In short, the American welfare state may be unusual less for its small size than for its reliance on a wide variety of policy tools to achieve what many European welfare states do primarily through social insurance. While it is hard to be 100% sure of this conclusion, given the difficulties of comparing direct spending, tax expenditures, regulation, loan guarantees, and the like, the evidence certainly suggests that we should be highly suspicious of anyone who declares that the United States has a small welfare state.
Measuring Welfare State Effort
My final reservation hinges on the ratio of social spending to GDP to measure welfare state effort. To illustrate my point, I present Bill and Melinda, a couple in their 40s who live in the suburbs of a major city. Bill works full-time and Melinda splits her time between caring for their two kids and doing some charitable work. As part of a study of household consumption patterns, we discover that less than 2% of Bill and Melinda's annual expenses go for food. This includes all food purchased at grocery stores or restaurants. Nationwide, food accounts for 14% of the average family's expenses. The conclusion seems obvious: Bill, Melinda, and the kids are malnourished, perhaps even starving. Someone from social services ought to take the children into protective custody.
In this case, however, the family in question is headed by Bill and Melinda Gates, the wealthiest couple in the world. Two percent of their annual expenses can still buy a lot of nice meals. They are definitely not starving. With people as rich as the Gates family, it might make more sense to calculate spending per person. The same is true when comparing the size of welfare states. Of all the nations discussed so far, the United States has the largest GDP and the highest GDP per capita. While the gap is definitely not as large as that separating the Gates family from the rest of us, it is significant. Thus, the United States government can devote a relatively smaller share of its GDP to social welfare and still spend more per person than nations devoting a higher share of GDP. Continuing with the food metaphor, it may be that two slices of a large pizza (in the United States) are as big as three slices of a medium pizza (in Europe).
Table 2 captures the difference by contrasting net social spending as a fraction of GDP (column C of Table 1) to net social spending per capita. Based on the latter measure, the American welfare state is the largest among the English-speaking OECD nations. It is larger than the Dutch welfare state. It is over 80% as large as the “massive” Swedish welfare state and 95% as large as the Finnish welfare state. The per capita figure of $4,809 for the U.S. is slightly above the 17-nation average of $4,782. The size of the American welfare state is average, not small.7
For a similar, more general approach to the size of government, see Rose 1989.
Because these figures reflect only social insurance, grants, and tax expenditures—and not publicly mandated but privately financed social spending, regulations, loan guarantees, or tort law—they actually understate the true size of the American welfare state and its placement relative to other welfare states. Based on per capita benefits distributed through all of these policy tools, the United States probably belongs in the top third of affluent welfare states.
Conclusions
The answer to the original question is “no,” the American welfare state is not unusually small. It compares favorably with some of the largest welfare states in the world. Those analysts who spend a lot of time and energy explaining why the American welfare state is so small should reconsider their initial premise.
I cannot be certain that the American welfare state has always been larger than portrayed in the literature. My data come from the 1990s, and it is possible that the American welfare state used to be relatively small but no longer is. In that case, what we may have is convergence among modern welfare states. Nevertheless, the various policy tools discussed in this paper are not recent creations. Tax expenditures in the United States have existed as long as the permanent income tax on corporations (1909) and individuals (1913). Minimum wage laws and loan guarantees were created in the 1930s and 1940s, the same time when key social insurance and grant programs originated. Tort law has been around forever. It is an open question just when and how long the American welfare state has been exceptional—a question I think worth pursuing. What seems clear is that its size is not that exceptional now.
These findings also have implications for our understanding of American exceptionalism more generally. If the American welfare state is not unusually small, and social welfare functions are a large component of government activities, then American government may not be that small, either. The question for future researchers, then, may not be why the U.S. government does relatively little compared to European governments. Rather, the question is why governments of similar size devote comparable resources to pursue similar policy objectives through such a diverse mix of policy tools.
It is quite possible that the answer to this new question will be quite similar to past explanations for American exceptionalism. Compared to other affluent democracies, the United States may rely less on direct forms of government assistance (social insurance, grants) and more on indirect forms (tax expenditures, loan guarantees, regulations) because of the long-standing tension Americans feel between their humanitarian and individualistic impulses (Feldman and Zaller 1992). By offering tax incentives to people who behave in socially desirable ways, by helping individuals secure credit from private lenders, and by telling employers how they must treat their workers, Americans can help those in need without seeming to expand public bureaucracies or government budgets. Even with many grant programs in the United States, thirdparty providers in the for-profit and non-profit sectors are used to deliver the actual service, such as medical care and job training. The importance of core American values like individualism and limited government may be reflected more in the techniques used to assist needy groups of people than the amount of aid given.
Alternatively, an institutional explanation may account for these patterns. The American political system has long been noted for its fragmentation. Perhaps the combination of many access points and many veto points makes it difficult to construct a single towering edifice of social insurance, overseen by a small number of legislators and bureaucrats. Instead, the United States has built several moderate structures—Tax Expenditures, Social Insurance, Grants, Loan Guarantees, Regulations, Tort Law—administered by a large number and wide range of public authorities.
Of course, size is not the only feature of welfare states worth discussing. The American welfare state may still be exceptional for its limited scope (e.g., family policy, health insurance), historically late start, weak levels of public support, or failure to reduce inequality and poverty. Such features are important and deserve careful consideration. My hope is that students of comparative and American politics will take this argument concerning the size of the American welfare state as a cautionary tale about the importance of describing something accurately before trying to explain it.