INTRODUCTION
About 7% of children experience unexplained language difficulties, a condition commonly referred to as Specific Language Impairment (SLI) (Tomblin, Records, Buckwalter & Zhang, Reference Tomblin, Records, Buckwalter and Zhang1997). Language difficulties are not due to factors normally associated with poor language; low IQ, neurological damage, hearing difficulties, or other known syndromes such as autism. While many language subdomains are impaired, it is often proposed that morphosyntax is most severely affected (Leonard, Reference Leonard2000). For example, the expressive language of children with SLI is characterized by grammatical errors involving the omission of tense/agreement/aspect morphemes, and incorrect case marking, e.g. He drops it → him drop it, She is sleeping now → her sleep now. Nonetheless, difficulties are also evident in other language subdomains such as vocabulary, phonology, and pragmatics.
A central question in SLI research is whether these children are delayed, or whether their language is ‘deviant’, or qualitatively different to that of typically developing children. To adopt the terminology of Leonard (Reference Leonard2014, p. 94), qualitative differences may be observed at the ‘macro-’ and ‘micro-'levels. The macro-level refers to performance across different language subdomains, e.g. morphosyntax, phonology, and vocabulary, while the micro-level refers to performance within a subdomain, e.g. verb versus noun morphology. Studies often refer to differences in profiles, which is a pattern of performance across different language assessments. At the macro-level, children with SLI perform worse on tests of morphosyntactic abilities than tests of lexical knowledge, compared with typically developing children who exhibit similar performance across these two subdomains (Rice, Wexler & Cleave, Reference Rice, Wexler and Cleave1995). At the micro-level, within the subdomain of morphology, verb affixes, e.g. watch-ed, are more prone to omission than noun affixes, e.g. dog-s, whereas profiles are flatter in typically developing children (e.g. Rice, Wexler & Cleave, Reference Rice, Wexler and Cleave1995). Complex sentences also reveal idiosyncratic profiles. For example, children with SLI perform much better on subject relatives (1) than object relatives (2) (e.g. Novogrodsky & Friedmann, Reference Novogrodsky and Friedmann2006):
-
(1) The dog that chased the cat was brown SUBJECT RELATIVE
-
(2) The cat i that the dog chased t i was ginger OBJECT RELATIVE
Again, age- and language-matched groups do not exhibit such a differential. Unusual profiles are apparent at even lower levels of granularity. For example, with regard to past tense production, a subdomain of morphology (or a sub-subdomain), children with SLI have a specific difficulty with regular past tense, but are comparatively good on irregulars, a profile less pronounced in typically developing children (van der Lely & Ullman, Reference van der Lely and Ullman2001).
Longitudinal studies complement the findings of cross-sectional data. While in typically developing children language skills develop in an integrated fashion, growth curves in SLI are characterized by ‘islands’ of extreme delay. Whereas vocabulary is often delayed, morphosyntax lags yet further behind vocabulary, and, within morphosyntax, tense marking appears most severely delayed (Rice, Reference Rice2013). Consequently, tense-marking difficulties have been characterized as a ‘delay-within-a-delay’.
While uneven language profiles do not play a role in the diagnosis of SLI, for many researchers they constitute a defining characteristic. For example, Leonard (Reference Leonard2014, p. 94) argues that “a profile difference appears to be the most accurate [way of characterizing SLI] both at a macro and micro level”. Without such profile differences, it would be difficult to motivate SLI as a distinct diagnostic category, as opposed to a term to describe children at the tail end of the normal distribution. Excluding the possibility that these children lie at the low end of the language continuum is an essential first step to developing causal theories of SLI, e.g. theories proposing specific grammatical deficits, as proposed by de Villiers (Reference de Villiers, Levy and Schaeffer2003). In addition, profile differences have motivated numerous causal theories of SLI, including the Extended Optional Infinitive account (Rice et al., Reference Rice, Wexler and Cleave1995), which addresses morphosyntactic profiles, and accounts of difficulties with complex sentences (see below). However, there is a striking disconnect between experimental investigations of language profiles, which suggest that children with SLI have qualitatively different language systems, and large-scale epidemiological/taxonometric studies, which find little support for the claim that these children should be regarded as belonging to a distinct category (Dollaghan, Reference Dollaghan2004, Reference Dollaghan2011; Tomblin & Zhang, Reference Tomblin and Zhang2006). Partly in response to this, many researchers are now openly questioning SLI as a diagnosis (Reilly et al., Reference Reilly, Tomblin, Law, McKean, Mensah, Morgan and Wake2014).
This paper investigates profiles during complex sentence production, and therefore it focuses on the micro-level. It also focuses on cross-sectional as opposed to longitudinal data. While there is no single agreed-upon definition of linguistic complexity, it is often argued that sentences are more complex when they involve non-canonical word order. Object relatives (2) are non-canonical in placing the Object before the Subject. Object questions (4) also exhibit the same property:
-
(3) Which dog was chasing the cat? SUBJECT QUESTION
-
(4) Which dog i was the cat chasing t i ? OBJECT QUESTION
While canonicity is not the only way to define complexity, it is relatively easy to manipulate, and consistently affects processing difficulty. Typically developing children find non-canonical structures more difficult to understand/produce than canonical structures (e.g. Tyack & Ingram, Reference Tyack and Ingram1977), and numerous studies have demonstrated that this discrepancy is even greater in children with SLI (see below).
Accounts of difficulties with complex sentences may be roughly divided into those proposing an underlying difficulty with linguistic competence, and those which suggest deficient processing mechanisms. While early linguistic accounts proposed difficulties with long-distance relationships (van der Lely & Battel, Reference van der Lely and Battel2003), more recent accounts have suggested a difficulty with thematic role assignment in the context of sentences with long-distance movement (Friedmann & Novogrodsky, Reference Friedmann and Novogrodsky2007). In particular, children with SLI may operate with a strict version of Rizzi's (Reference Rizzi1990) Relativised Minimality (Friedmann & Novogrodsky, Reference Friedmann and Novogrodsky2011). This outlaws complex sentences where a constituent crosses over a constituent of the same type, e.g. referential NP (the cat) and referential NP (the dog) in (2) and (4).
Processing accounts address the same structures from the perspective of capacity limitations. In order to interpret (2) and (4), children must store the displaced NP until it can be thematically integrated at the trace. This process involves maintaining a phonological/lexical representation whilst processing the remainder of the sentence. In this way, the sentence places a greater burden on verbal working memory (WM) than the corresponding canonical alternative. Many researchers have argued that storage and processing compete for limited resources (Just & Carpenter, Reference Just and Carpenter1992), and that consequently maintaining displaced NPs will detract from processing in non-canonical sentences. In addition, NPs with similar characteristics may interfere with each other in verbal WM, and such interference effects are greater in non-canonical sentences where displaced NPs must be must be maintained while processing the intervening NP (Gordon, Hendrick & Johnson, Reference Gordon, Hendrick and Johnson2001; see also Gibson & Pearlmutter, Reference Gibson and Pearlmutter1998, for a concise introduction). In addition to the processing costs involved in movement, relative clauses also involve perspective switching, whereby the head of the relative clause has two thematic roles; one with respect to the relative clause, and another with respect to the main clause. For example, in (2) cat is the patient/object of chase, but the subject of be. Again, perspective switching may tax WM resources (Booth, MacWhinney & Harasaki, Reference Booth, MacWhinney and Harasaki2000). In summary, complex sentence interpretation depends on WM abilities, which are often compromised in SLI. Consequently, there may be a causal relation between WM limitations in SLI and difficulties understanding/producing complex sentences (Montgomery, Magimairaj & Finney, Reference Montgomery, Magimairaj and Finney2010).
The analysis of profiles
Profile differences are of major theoretical importance in SLI research, contributing to the claim that language in SLI is disordered as opposed to weak. Typically, in cross-sectional data, profiles are explored by investigating the interaction between Group (between-subjects factor) and linguistic construct (within-subjects factor), where the linguistic construct is the type of morpheme (e.g. noun affix versus verb affix), or canonicity. If the interaction term is significant, researchers conclude that profiles are different across groups. Interactions are always ‘quantitative’, with the effect of condition having the same polarity across groups. For example, all groups find non-canonical sentences more difficult than canonical sentences, but the magnitude of this effect varies between groups.
Interactions between Group and Canonicity have been investigated by most studies of SLI assessing comprehension and production of relative clauses and questions across a variety of languages including English, Hebrew, Greek, Italian, Danish, and Cantonese. The majority have identified a significant Group by Canonicity interaction on at least one dependent measure (Adani, Forgiarini, Guasti & van der Lely, Reference Adani, Forgiarini, Guasti and van der Lely2014; Deevy & Leonard, Reference Deevy and Leonard2004; Friedmann & Novogrodsky, Reference Friedmann and Novogrodsky2007; Jensen de López, Olsen & Chondrogianni, Reference Jensen de López, Olsen and Chondrogianni2014; Novogrodsky & Friedmann, Reference Novogrodsky and Friedmann2006; Riches, Loucas, Charman, Simonoff & Baird, Reference Riches, Loucas, Charman, Simonoff and Baird2010; van der Lely & Battel, Reference van der Lely and Battel2003; van der Lely, Jones & Marshall, Reference van der Lely, Jones and Marshall2011). A Group by Structure interaction was also observed by Wong, Leonard, Fletcher, and Stokes (Reference Wong, Leonard, Fletcher and Stokes2004), who investigated question formation in Cantonese children with SLI, and found that they had particular difficulties with object questions. However, in Cantonese these are in fact canonical structures, exhibiting the same word order as declarative sentences with a transitive verb, and consequently the authors provide a non-movement account based on input frequency and animacy constraints. The above list does not do justice to the complexity of these studies and their detailed investigation of different error types, e.g. mis-assignment of thematic roles (Friedmann & Novogrodsky, Reference Friedmann and Novogrodsky2007). It also overlooks fine-grained distinctions in the structures used, e.g. right-branching relatives in Novogrodsky and Friedmann (Reference Novogrodsky and Friedmann2006) and cross-linguistic differences. However, it is accurate to say that when errors/items correct are counted, they all identify a distinct profile in children with SLI with regard to non-canonical structures. By contrast, a few studies do not identify significant Group by Canonicity interactions (Epstein, Hestvik, Shafer & Schwartz, Reference Epstein, Hestvik, Shafer and Schwartz2013; Stavrakaki, Reference Stavrakaki2001). However, despite their findings, the researchers do not question the assumption that profile differences exist, probably due to strong converging evidence.
With the exception of Adani et al. (Reference Adani, Forgiarini, Guasti and van der Lely2014), all of the above studies use two-way ANOVAs to analyze count data (number of items correct/incorrect). Sometimes counts are expressed as percentages, but this makes no difference to the statistical results, as the ratios between observations are unaltered. Often, typically developing children perform close to ceiling (e.g. 94% accuracy on object relatives in Novogrodsky and Friedmann, Reference Novogrodsky and Friedmann2006, and 87% for object questions in Deevy and Leonard, Reference Deevy and Leonard2004). This can be regarded as an occupational hazard when comparing profiles where groups differ greatly in ability. If a group performs close to ceiling, the variance of the data (roughly speaking the spread of datapoints around the mean) is reduced. This phenomenon is sometimes referred to as a ‘ceiling effect’, and is generally regarded as problematic for statistical analysis. This is because if variance differs greatly across different groups and/or conditions, then the residuals (roughly speaking the difference between observed and predicted values) will depart from a normal distribution. This will affect significance tests, e.g. the t-test, z-test, and F-test, as they all assume normally distributed residuals.
One way to minimize the impact of a ceiling effect is to use a transformation, e.g. arcsine, square root, or log transformation. These ensure that variances do not vary greatly across groups and/or conditions, i.e. they are ‘stabilized’. An alternative is to use an F-test which is robust to heterogeneity of variance, e.g. Games-Howell (Field, Reference Field2000, p. 276). However, there are no reliable and universally accepted guidelines to determine when to transform and how to transform, or which F-test to use. Moreover, studies vary in their treatment of the data, with some studies applying transformations to count data (e.g. Deevy & Leonard, Reference Deevy and Leonard2004; Wong et al., Reference Wong, Leonard, Fletcher and Stokes2004) and others (e.g. Friedmann & Novogrodsky, Reference Friedmann and Novogrodsky2011; Stavrakaki, Reference Stavrakaki2001) leaving count data untransformed.
An alternative to the ANOVA is to use a Generalised Linear Model (GLM), a form of regression analysis. This is distinct from the ‘General’ Linear Model which underlies the ANOVA. GLMs extend or ‘generalize’ the basic linear model so that it deals with different types of distribution. They do this by employing different ‘link functions’ (e.g. the log function for modelling count data), and assuming different distributions (e.g. the Poisson distribution which tends to arise from count data; see Howell, Reference Howell2013, for details). Mathematically speaking, there is no difference between ANOVAs and simple linear models. However, GLMs allow greater flexibility for dealing with data from different distributions, and crucially they allow for much better modelling of residuals resulting from unequal variances. They do this systematically, as different types of GLMs are specifically designed for different distributions. By comparison, when using ANOVAs, procedures for dealing with unequal variances are difficult to apply in a systematic fashion. In addition, there is evidence to suggest that GLMs give more reliable results. For example, Jaeger (Reference Jaeger2008) and Dixon (Reference Dixon2008) compared the findings of ANOVAs on arcsine transformed data with logistic regressions designed to model dichotomous data. Jaeger investigated data on relative clause comprehension, later published by Arnon (Reference Arnon2010), and Dixon conducted a simulation study. Both studies found that ANOVAs performed poorly when data approached the extremes, in comparison to the GLM. Jaeger identified a bias towards a significant interaction, while Dixon argued that the bias could increase or decrease the chances of a significant interaction depending on the shape of the data. Together, these studies suggest that GLMs may be a better means of analyzing interaction effects than ANOVAs where unequal variances arise.
A further advantage of GLMs is that one can control for both by-items and by-subjects effects using mixed effects models (Baayen, Davidson & Bates, Reference Baayen, Davidson and Bates2008). Modelling by-items effects is important in ensuring that findings generalize beyond the current set of items (Clark, Reference Clark1973). Furthermore, a failure to fully model random effects can lead to a Type I error, the incorrect rejection of the null hypothesis (Barr, Levy, Scheepers & Tily, Reference Barr, Levy, Scheepers and Tily2013; Clark, Reference Clark1973; Quené & Van den Bergh, Reference Quené and Van den Bergh2008). However, ANOVAs are unable to do this, as they cannot simultaneously model by-items and by-participant effects. For example, by-subjects ANOVAs ‘aggregate’ data at the participant level by ensuring that there is only one observation per participant for each cell of the design.
These are abstract statistical issues which are rarely discussed in child language research. However, they relate directly to theory and the way we conceptualize SLI. Numerous researchers have argued for localized syntactic difficulties based on group by linguistic construct interactions. However, ANOVAs may not be the best procedure for testing these claims. Only one previous study by Adani and colleagues (2014) has employed a GLM to analyze complex sentence profiles, but crucially they did not investigate Group by Canonicity interactions for overall errors, choosing instead to focus on different error types. Consequently, there is a need for an investigation of profile differences employing GLMs.
The focus of the study
This study uses a GLM to analyze data from the Sentence Repetition (SR) paradigm, otherwise known as Elicited Imitation. While this is ostensibly a measure of verbatim recall, and hence may depend on both STM and WM (Jefferies, Lambon-Ralph & Baddeley, Reference Jefferies, Lambon-Ralph and Baddeley2004; Willis & Gathercole, Reference Willis and Gathercole2001), it is also argued that SR involves linguistic representations in long-term memory (LTM) (Clay, Reference Clay1971; Potter & Lombardi, Reference Potter and Lombardi1998; Slobin & Welsh, Reference Slobin and Welsh1968). Short-term memory (STM) may not have sufficient capacity to support recall of sentences above a certain length, and therefore syntactic, lexical, and semantic representations in LTM are recruited (Potter & Lombardi, Reference Potter and Lombardi1998). Effectively, the sentence is not parroted, but reconstructed from activated representations in LTM. Numerous studies have demonstrated the involvement of underlying syntactic representations. First, Potter and Lombardi (Reference Potter and Lombardi1998) observed structural priming effects during SR, and these are widely assumed to involve underlying syntactic representations. Second, canonicity impacts upon repetition performance even when length is held constant and lexical factors are controlled for (Hudgins & Cullinan, Reference Hudgins and Cullinan1978; Riches, Reference Riches2012). Consequently, greater errors for non-canonical sentences must be due to structural factors. Finally, repetition of complex sentences yields consistent error patterns, e.g. transforming object relatives into subjective relatives (Riches et al., Reference Riches, Loucas, Charman, Simonoff and Baird2010), and these cannot be explained without invoking syntactic representations.
According to the reconstruction hypothesis, there is a strong overlap between the cognitive mechanisms engaged by SR, and tasks which are regarded as more naturalistic or ecologically valid, e.g. elicitation and forced-choice comprehension tasks. For example, during elicitation tasks using picture prompts, the participant must assemble the sentence from linguistic representations in LTM. According to the reconstruction hypothesis, SR involves essentially the same process, except that representations are primed by the stimulus, so the sentence is not built ‘from scratch’. Comprehension is also essential to SR as, if the sentence is poorly understood, the appropriate representations in LTM will not be activated and the sentence will not be correctly recalled. This was demonstrated by McDade, Simpson, and Lamb (Reference McDade, Simpson and Lamb1982), who found a strong association between comprehension and recall accuracy for the same stimuli. Overall, most researchers employing SR generally assume that it activates the language system at a deep level. In fact it has been argued that there is ‘general agreement by researchers’ that SR can be used to assess the child's ‘productive linguistic capacity’ (Bernstien Ratner, Reference Bernstien Ratner and Menn2000, p. 293; as cited in Seeff-Gabriel, Chiat & Dodd, Reference Seeff-Gabriel, Chiat and Dodd2010).
In addition to its cognitive underpinnings, SR offers practical advantages as it is relatively easy to score, given that there is a single target. In contrast, with more open-ended paradigms, e.g. elicitation, there may be more than one correct response. It is beneficial to have a single target because we can reliably quantify the distance between the target and response using an algorithm such as the Levenshtein Distance (LD) (Levenshtein, Reference Levenshtein1966). An adapted version of this algorithm counts the minimum number of word/morpheme additions, omissions, and substitutions required to transform one sentence into another (see ‘Appendix 2’ for worked examples; all appendices are in the online supplementary materials http://dx.doi.org/10.1017/S0305000915000847). This yields a wide measurement scale with no theoretical upper limit, though in reality the number of errors is unlikely to exceed the number of words/morphemes in the sentence, corresponding to a null response. Such a scale is beneficial because it increases statistical power and provides a sensitive measure of performance, which may correspond to the underlying strength of the syntactic representation. Additionally, it deals unproblematically with null responses, which are difficult to analyze using other paradigms (see Hakansson and Hansson, Reference Hakansson and Hansson2000, for a discussion of this issue).
Aims and hypotheses
The study investigated whether children with SLI exhibit a qualitatively different profile to language-typical peers on a task involving the production of complex sentences (SR). The study incorporated two methodological innovations. First, a GLM was employed to model the distribution of the data. Second, it used the LD, which increases statistical power and provides a sensitive performance metric.
The main hypothesis was that there would be a significant difference in profiles as manifested by a Group by Canonicity interaction. In addition to the LD, word order errors were coded to provide a more qualitative measure of performance. Again it was predicted that word order errors would also present with a Group by Canonicity interaction.
METHOD
Participants
Seventeen children with SLI aged 6;0 to 7;3 were recruited from language units attached to mainstream schools in the southeast of England. Recruitment letters were sent to Speech and Language Therapists, requesting that children meet criteria for SLI, with structural language difficulties, English as their main language, and no non-verbal learning difficulties, hearing difficulties, autism spectrum disorders, or other known syndrome. No child had been diagnosed with a disorder interfering with intelligibility, e.g. dyspraxia or oromotor difficulties, according to a screening questionnaire. Non-verbal abilities were assessed using the Wechsler Preschool and Primary Scale of Intelligence core subtests (WPPSI-3: Wechsler, Reference Wechsler2002), with all children obtaining standard scores greater than or equal to 85. Three assessments were used for assessing structural language difficulties: Word Structure (WS) from the CELF (Wiig, Secord & Semel, Reference Wiig, Secord and Semel1992), the Renfrew Action Picture Task (RAPT: Renfrew, Reference Renfrew1997), and the Test of Reception of Grammar-Electronic (TROG-E: Bishop, Reference Bishop2005). WS and RAPT assess expressive syntax, with both tests designed to elicit specific syntactic structures at both morpheme and sentence level. The TROG-E was chosen to assess receptive syntax. This version of the CELF was chosen as it is standardized across a wide age range, allowing the same assessment to be used with all children. Children were diagnosed with SLI if they fell below –1·2 standard deviations on two or more of these structural language assessments. In addition to these diagnostic assessments, the British Picture Vocabulary Scales (BPVS: Dunn, Whetton & Burley, Reference Dunn, Whetton and Burley1997), the CELF Recalling Sentences (RS) task, and the Children's test of Nonword Repetition (CNRep: Gathercole & Baddeley, Reference Gathercole and Baddeley1996) were also administered.
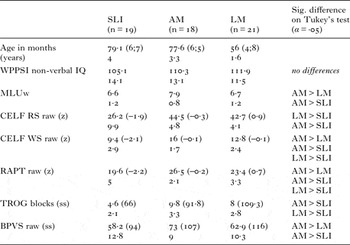
Seventeen age-matched (AM) and twenty-one language-matched (LM) children (age 4;0 to 5;0) were recruited from mainstream schools and nurseries via head teachers, with language matching accomplished via Mean Length of Utterance-in-words (MLUw). Identical instruments were used, with every child scoring > 85 on the WPPSI, and no child scoring < –1·2 standard deviations on more than one language assessment. Narratives were elicited from the children in order to calculate their MLUw for group-matching purposes. The two narratives were The Bus Story (Renfrew, Reference Renfrew1991) and Frog, Where Are You? (Mayer, Reference Mayer1969), often referred to as The Frog Story. While The Bus Story involves the experimenter telling the story first, The Frog Story involves the child building their own narrative from pictures. This narrative-based method is different to the play-based scenario typically used to derive MLU, but has the advantage that it is less influenced by interactional context, and may be more linguistically demanding, eliciting longer and more complex utterances (Hewitt, Hammer, Yont & Tomblin, Reference Hewitt, Hammer, Yont and Tomblin2005; Miles, Reference Miles2006). This, in turn, may enhance its sensitivity as a language assessment. The children's speech was transcribed using conventions proposed by Miller (Reference Miller1981). Samples contained mean 65·4 utterances (s.d. 20·9) in the SLI group, mean 68·4 (s.d. 14·6) in the AM group, and mean 55·1 (s.d. 16·1) in the LM group. Table 1 shows psychometrics and significant group differences.
Group psychometric data – means and standard deviations

notes: Raw = raw scores, z = z-score (mean = 0), ss = test standard score (mean = 100).
Stimuli
One hundred sentences were generated according to a 2 (canonicity) × 2 (length) design. Non-canonical sentences were object relatives and object questions. For relative clauses a mixture of right-branching and centre-embedded clauses were used. Examples are shown in ‘Appendix 1’. Sentences were created in pairs, such that for each non-canonical sentence there was a canonical sentence of exactly the same length and employing exactly the same words. Therefore, greater errors on non-canonical sentences cannot be ascribed to lexical and phonological factors. In addition, 2-place and 3-place predicate transitive sentences and passives were used as filler items. Length ranged from six to twelve words (mean 8·2) and was manipulated using filler adjectives and adverbs (see ‘Appendix 1’ for examples and frequencies of each construction). All nouns and verbs have a token frequency > ten words per million on either the British National Corpus (British National Corpus, version 2, 2002) , or the CELEX database; spoken and written (Burnage, Reference Burnage1990). All stimuli were spoken by a native female speaker of English with a local dialect, and recorded in a soundproof booth. Sentences were grouped into eight blocks of twenty and pseudo-randomized so that no two consecutive sentences had the same type, length, and canonicity characteristics. Sentence length gradually increased throughout the block as, in piloting, this facilitated performance on the longer sentences, a method also adopted by standardized SR assessments, e.g. the CELF.
Seventeen linguistically informed colleagues rated the plausibility of sentence pairs, e.g. the monkey chased the pig, and the pig chased the monkey, and sentences were only chosen if there was a small discrepancy between these (a maximum of 3 points on a rating scale of 7), indicating that both propositions were more or less equally probable. These simple transitive sentences were then used to create the stimuli, e.g. which pig is the monkey chasing? This process ensured that the sentences were highly reversible, i.e. changing the order of the arguments (the monkey chased the pig versus the pig chased the monkey) does not greatly affect the plausibility of the sentence. Reversibility is an important factor to control for as it may affect the likelihood that a child will make word order errors. For example, a child would be very unlikely to reverse the word order in a non-reversible sentence such as the man drew the picture.
Procedure
Administration. The SR task was demonstrated with a cuddly toy parrot and a story book called The Gossipy Parrot (Roddie & Terry, Reference Roddie and Terry2003). The experimenter read the story to the child, and at various stages the parrot commented on the story. This was achieved wirelessly via a Kensington conference pointer hidden inside the toy. The experimenter pretended not to understand the parrot, so the child had to help him by repeating what the parrot had said. The parrot was also used for the SR task itself, which was run on a laptop computer. The experimenter said “Now the parrot is going to say some more sentences. I don't understand parrots so you have to tell me exactly what the parrot says.” The child was then presented with a 5 × 4 grid, with a coloured band to show half-way. As the child heard each sentence a number appeared in the grid. This motivated the child by showing how many sentences remained. At the end, a ‘reward’ screen appeared with a picture of people clapping accompanied by applause. All sentences were heard via headphones (Sennheiser PC156), and responses were recorded to the computer via the mouthpiece. The experiment was run using DMDX experimental software (Forster & Forster, Reference Forster and Forster2003).
Assessments were conducted during three visits per child. Each visit consisted of two 30–40 minute sessions separated by a break. Sentence repetition blocks were administered in one of four pseudo-randomized orders, with orders evenly distributed within groups.
Coding. Quantitative errors were derived using the LD. For the purpose of this analysis, each morpheme was represented as a separate unit. Therefore, this measure will be described as the Levenshtein Distance in morphemes (LDm). By coding sentences in terms of morphemes, omissions of affixes will be counted by the algorithm (see ‘Appendix 2A’ for demonstrations). In addition, a more qualitative measure of structural changes was devised. Structure was deemed to have changed if any of the arguments or the main verbs changed position or syntactic function, e.g. OSV became SVO (e.g. which pig is the cheeky little monkey rescuing? → which pig is rescuing the cheeky little monkey?) or SVO became OSV. A second rater coded responses for two AM children, three LM children, and four children with SLI, corresponding to 15% of the observations. Ratings were identical for 96% of responses.
Elicitation. A central argument of the study is that SR can be used to assess representations in LTM. To verify this claim, an elicitation task was conducted which depended on structural priming. It has been widely argued that where there is no lexical overlap, structural priming reflects syntactic representations in long-term memory (e.g. Pickering & Ferreira, Reference Pickering and Ferreira2008). During the elicitation task, the experimenter described one picture using the target structure, and the child was encouraged to describe a different picture, e.g. EXPERIMENTER: This is the bread which the woman baked and this is the soup … CHILD: which the boy made. While this is not a standard priming paradigm, nonetheless the children are primed to reproduce the structure in the first clause. Importantly, all responses required a change of both verb and noun, thereby pre-empting verbatim recall, and STM demands were minimal, as completion fragments number no more than five words. This entailed producing the head of the relative clause which precluded the possibility of reversing arguments, e.g. this is the boy who made the soup. The assessment contained two warm-up items, two subject relatives, and two object relatives. An attempt was also made to prime questions, but this proved difficult. A scoring protocol was devised to reflect the main syntactic components of each structure (see ‘Appendix 2B’), with scores ranging from zero to one.
ANALYSIS
Analysis of the validity of the dependent variables
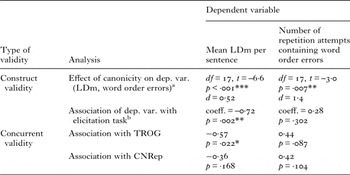
Because the LDm is a novel metric, an analysis of validity was conducted (Table 2). Measures were also obtained for a qualitative measure; the number of responses per child containing word order errors, e.g. OSV → SVO. Analyses investigated construct validity, i.e. whether the assessment was a good reflection of performance on complex sentences; the theoretical area of interest; and concurrent validity, i.e. whether they are associated with other measures which have strong empirical support as a clinical marker of SLI. Construct validity was determined by (a) investigating whether the dependent variable was influenced by canonicity, and (b) examining the association between the dependent variable and performance on the elicitation task, which demonstrates better ‘face validity’. In other words, elicitation is subjectively a more obvious measure of language production, given that children must actually create a sentence, than SR, as children merely need to repeat what the experimenter has said. For the latter, only repetitions of relative clauses were included in the analyses, to ensure that the elicitation and repetition paradigms involved identical structures. With regard to concurrent validity, the decision was made to adopt the CNRep as a dependent variable as it is a reliable clinical marker of SLI (Conti-Ramsden, Botting & Faragher, Reference Conti-Ramsden, Botting and Faragher2001). The TROG was also used as a dependent variable. Though not regarded as a clinical marker, it is nonetheless a widely used, well-standardized, and well-validated assessment of language abilities. The LDm demonstrated good validity across all measures except the CNRep, thereby demonstrating sensitivity to both syntactic knowledge/abilities and degree of language impairment. By contrast, the qualitative measure presented with good validity on the first measure only.
Validity measures for dependent variables

notes: a: results of paired t-test with canonicity as the IV; b: results report Pearson's product moment correlations and respective significance values; *** < ·001, ** < ·01, * < ·05.
Data diagnostics and choice of statistical model
The distribution of the error data (LDm) was investigated to determine the choice of regression model. The standard method for modelling count data, e.g. numbers of errors, is a Poisson regression. However, the raw data were strongly rightward skewed (see ‘Appendix 3’). This distribution is characteristic for count data where there are high rates of zero values (i.e. sentences where no error was made) resulting in ‘overdispersion’ (where the variance is greater than the mean). There are a couple of methods for dealing with overdispersion. First, an extra parameter accounting for the relationship between the mean and variance may be added. This type of regression is called a ‘negative binomial regression’. In addition, zero inflation (or ‘zero truncation’) may be applied. This combines a Poisson model with a logit model to account for excess zeroes. ‘Appendix 3’ shows statistics of model fit for a variety of models using two modules in R (R Development Core Team, 2014), lme4 (Bates, Maechler, Bolker & Walker, Reference Bates, Maechler, Bolker and Walker2014), and glmmADMB (Skaug, Fournier, Nielsen, Magnusson & Bolker, Reference Skaug, Fournier, Nielsen, Magnusson and Bolker2011). It can be seen that the best-fitting model was the zero-inflated negative binomial model, which significantly improves on the next best model.
Analysis of errors (LDm)
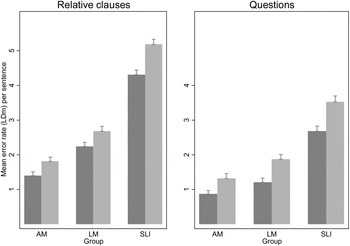
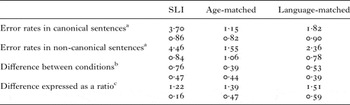
Descriptives are shown in Table 3 and Figure 1. Differences in raw errors as a function of canonicity clearly vary across groups, with a larger difference observed in the SLI group. This is consistent with the idea that children with SLI find non-canonical sentences especially difficult. However, when data are presented as ratios a different picture emerges. The ratio shows the number of errors in non-canonical sentences per error in canonical sentences. For example, the children with SLI made 1·22 errors in non-canonical sentences for each error in canonical sentences. The ratio is a mirror image of the difference data, with the SLI groups exhibiting the smallest ratios, and the LM children exhibiting the largest ratios.
Error rates by Sentence Type and Canonicity. notes: Error bars show standard error of the mean; dark bars show performance on non-canonical sentences; lighter bars show performance on canonical sentences.

Errors by Group and Canonicity (mean and s.d.)

notes: a: mean number of errors per sentence per participant; b: for each participant, the mean number of errors per canonical sentence was subtracted from the mean number of errors per non-canonical sentence, and then means and standard deviations of this measure were obtained; c: for each participant, the total number of errors in non-canonical sentences was divided by the total number of errors in canonical sentences, and then means and standard deviations of this measure were obtained.
To begin with, a traditional by-subjects ANOVA was conducted with Group and Canonicity as the independent variable, and the LDm as the dependent variable. The LDm was divided by the number of morphemes in the sentence to give a rate variable (errors per morpheme). This ensures that the ANOVA is consistent with the GLMs (below), which also modelled the errors as rates. The mean rate was then calculated for each participant by Canonicity combination. There was a significant effect of Group (F(2,52) = 51·3, p < ·001***, η 2 p = 0·969), a significant effect of Canonicity (F(1,52) = 95·5, p < ·001***, η 2 p = 0·647), and a significant interaction (F(2,52) = 4·07, p = ·023*, η 2 p = 0·135). Planned contrasts found a significant effect for the SLI versus AM comparison (F(1) = 7·76, p < ·007**), but the SLI versus LM contrast just missed significance (F(1) = 3·92, p = ·053).
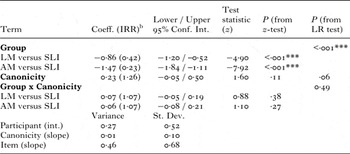
A mixed effects negative binomial regression with zero inflation was conducted. Like the ANOVA this modelled the effects of Group, Canonicity, and the Interaction term. Raw errors per sentence were entered as the dependent variable. In order to turn these into rates, sentence length in morphemes was set as the ‘exposure’, i.e. the size of the unit within which the errors occurred (glmmADMB only provides an ‘offset’ option, and to transform this into the exposure we take the square root of the rate measure; the number of morphemes). Group was treatment coded, with the SLI group specified as the reference group. Analyses adopted a maximal random effects structure, with participant and item entered as intercepts, and by-participant slopes for canonicity (Barr et al., Reference Barr, Levy, Scheepers and Tily2013). The association between participant (intercept) and Canonicity (slope) was low (r = –0·14), and therefore the latter was retained (Baayen et al., Reference Baayen, Davidson and Bates2008). Though the glmmADMB analysis reports significance (see Table 4), an alternative procedure using likelihood ratio tests was also conducted as it is thought to provide better estimates (Barr et al., Reference Barr, Levy, Scheepers and Tily2013). Coefficients have been reported as Incidence Rate Ratios (IRR) to aid interpretation. The IRR for the SLI versus AM contrast was 0·23, signifying that each child in the AM group made 0·23 errors for each error made by a child in the SLI group. Overall, there was a significant effect of Group, the effect of Canonicity just missed significance, and the Group by Canonicity interaction did not approach significance.
Analyses of LDm using a zero-inflated negative binomial regressiona

notes: a: random effects structure in R notation; (1 + Canonicity|Participant) + (1|item); b: IRR = Incidence Rate Ratio; *** < ·001, ** < ·01, * < ·05.
Analysis of qualitative errors
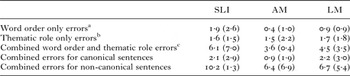
Descriptives are shown in Table 5. Most errors involve both word order changes and the swapping of thematic roles, e.g. there's the cat that the dog chased → there's the cat that chased the dog. Here an object relative (within a presentational cleft) is changed into a subject relative, but the nouns have remained in the same positions, thereby swapping thematic roles (and also syntactic functions). As this error type was by far the most common it was selected for the subsequent analysis. The bottom rows in the table show this error type summarized by condition. The children with SLI appear to be particularly sensitive to the structure of the sentence, demonstrating a strong tendency to transform canonical into non-canonical sentences.
Qualitative errors by Group Percentage of repetition attempts exhibiting each error type (mean, s.d., range)

notes: a: e.g. There's the cat that the dog chased → There's the dog that chased the cat; 2: e.g. There's the cat that the dog chased → There's the dog that the cat chased; 3. e.g. There's the cat that the dog chased → There's the cat that chased the dog.
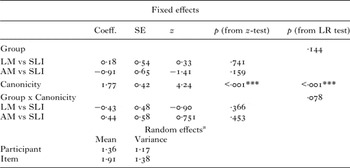
The data were subsequently analyzed using a mixed effects logistic regression to model dichotomous data (Jaeger, Reference Jaeger2008). Results are shown in Table 6. The independent variables were Group, Canonicity, and their interaction, and the dependent variable was coded 1 if the child made the error type described above, and 0 if such an error was not evident. Details of the model-fitting procedure are shown below the table. There was a significant main effect of Canonicity, but no significant effect of Group. The Group by Canonicity interaction demonstrated a trend towards significance.
Analysis of word order errors

notes: a: A fully-specified random effects model was fitted. This did not converge. The parameter for the correlation between Participant (intercept) and Canonicity (slope) was removed (Baayen et al., Reference Baayen, Davidson and Bates2008), but the model still did not converge. Finally, a model removing Canonicity as a random slope, but retaining random intercepts for Participant and Item was fitted; (1|participant) + (1|item). This final model converged and is shown above. In addition, a model with (1 + canonicity|participant) was also run, as proposed by Barr et al. (2013), who argue that it is important to run random slopes models in cases of non-convergence. This model yielded identical results in terms of significance. *** < ·001, ** < ·01, * < ·05.
Investigation of individual differences in the SLI group
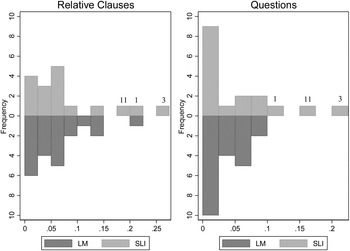
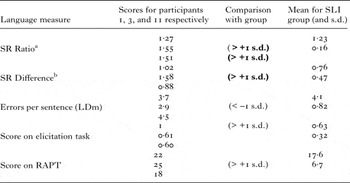
Histograms were plotted to investigate individual differences in both the LDm and above error type. While LDm performance was relatively homogenous, with few outlying children in any of the groups, histograms identified three children with SLI who make high rates of such errors (see Figure 2). Scores on other language assessments were inspected to find out if these children belong to a Grammatical or Syntactic SLI subgroup (Friedmann & Novogrodsky, Reference Friedmann and Novogrodsky2011; van der Lely, Reference van der Lely2005). Scores are shown in Table 7. The possibility of a subgroup was partially corroborated for children 3 and 11. They were both outliers (performance ±1 standard deviation) on the ratio measure, while 3 was also an outlier on the difference measures. Both of these measures are sensitive to extreme difficulties with non-canonical structures. However, there was no evidence that these children were outliers on more general linguistic measures.
Histograms of word order errors by group and structure. Proportion of repetition attempts changing word order, but maintaining serial order of NPs. note: Numbers show ID numbers for outlying children with SLI.

Analysis of SLI subgroup

notes: a: Ratio = number of errors in non-canonical sentences per error in canonical sentences; b: Difference = mean error rate for non-canonical sentence minus mean error rate per canonical sentence; First three measures are negatively scored with high scores denoting poor performance, while second two measures are positively scored with high scores denoting good performance. Bold values show performance substantially worse than group.
DISCUSSION
Complex sentence profiles in SLI were investigated using SR. The ANOVA identified a significant interaction between Group and Canonicity when the children with SLI were compared to the AM group. Inspection of the means (Table 3, Figure 1) indicates a larger effect of Canonicity in the SLI group, suggesting that this interaction is driven by specific difficulties with non-canonical sentences in this group. A group by canonicity interaction for the SLI versus AM comparison is consistent with a number of previous studies of complex sentence profiles (Friedmann & Novogrodsky, Reference Friedmann and Novogrodsky2011; Jensen de López et al., Reference Jensen de López, Olsen and Chondrogianni2014; Riches et al., Reference Riches, Loucas, Charman, Simonoff and Baird2010). However, the interaction term for the SLI versus LM contrast just missed significance (p = ·053). In contrast to the ANOVA, a negative binomial model regression with zero inflation did not identify any differences in profiles. This finding conflicts with the majority of the research literature. A qualitative measure of word order errors identified a trend towards a significant interaction between Group and Canonicity (p = ·078), such that children with SLI tended to transform non-canonical into canonical sentences. This effect was driven by a subgroup of three children who made elevated rates of such errors.
An important finding of the study is that the significance of the interaction term is dependent on our choice of statistical model. While the ANOVA identified a significant interaction (SLI versus AM), none was observed for the negative binomial regression with zero inflation. Moreover, differences in p-values were large. This has strong theoretical implications as interpretation of the interaction term determines whether we view SLI as a disorder characterized by severe deficits in particular subcomponents of the language system, or systems subserving language. There are two statistical arguments in favour of the GLM, as outlined in the literature review. First, the best-fitting regression (negative binomial with zero inflation) allowed us to model changes in variance as the data approached the extremes. GLMs are more effective than ANOVAs in this regard (Jaeger, Reference Jaeger2008). Second, the GLM incorporated a fully specified random effects structure, modelling the effect of both items and participants. Both of these factors allow for a more reliable investigation of interaction effects (Barr et al., Reference Barr, Levy, Scheepers and Tily2013; Clark, Reference Clark1973; Jaeger, Reference Jaeger2008).
One way to conceptualize the difference between the two analyses is to think in terms of additive and multiplicative models. According to the GLM, the Incidence Rate Ratio for the Canonicity term is 1·26. This means that to obtain error rates for non-canonical sentences, we must multiply error rates for canonical sentences by 1·26. This multiplicative relationship stems from the use of a log link function, as when logs are added the underlying bases are multiplied, e.g. elog(x) +log(y) = x * y (e = natural logarithm). By contrast, ANOVAs on untransformed data use an additive model based on absolute differences between conditions. This difference matters when investigating interaction effects. For example, glancing at Figure 1, absolute differences between conditions are greater in the SLI group, which drives the significant Group by Canonicity interaction in the ANOVA on untransformed data (SLI versus AM contrast only). However, the relative heights of the bars vary little across the groups, with the mean for non-canonical sentences approximately 26% higher than the mean for canonical sentences. This leads to an absence of profile differences when analyzed using the GLM.
The use of a multiplicative model is justified by the statistical tests of model fit. However, it is also strongly desirable to develop a psycholinguistic model which operates in a multiplicative fashion. In fact, most formal accounts of language processing, i.e. those adopting algebraic notation, posit multiplicative relationships. For example, Gibson (Reference Gibson1998, p. 16) argues that the speed of integration at the trace is equal to: Constant * (Energy Resources / Available Memory Resources). If we imagine that the Constant varies across groups, and Energy Resources vary as a function of Canonicity, then we have a theoretical framework consistent with our multiplicative statistical model. Just and Carpenter's (Reference Just and Carpenter1992) CC-reader also posits multiplicative relationships. For example, when activation flows from one ‘element’ to another it is multiplied by a constant (p. 135). This mirrors the basic design of artificial neural networks where synaptic weights multiply the activation by a given value.
In addition to these theoretical arguments, there is also an empirical measure which, in studies of children with SLI, has consistently demonstrated multiplicative properties: speed of processing. Children with SLI are about a third slower than control children across a range of linguistic and non-linguistic tasks (Kail, Reference Kail1994). In other words, we multiply the RTs of typically developing children by 1·33 to obtain the SLI data. Unfortunately, there is currently little evidence identifying speed of processing as a primary determinant of language difficulties (Leonard, Weismer, Miller, Francis, Tomblin & Kail, Reference Leonard, Weismer, Miller, Francis, Tomblin and Kail2007). Nonetheless, studies of processing speed in SLI lend validity to formal models positing multiplicative relationships.
If we accept the statistical and theoretical arguments outlined above, we must conclude that profiles, as manifested by an interaction effect, do not vary across groups. Moreover, the discrepancies between the results for the GLM and the ANOVA support the claim that the latter can spuriously inflate the significance of interaction terms (Jaeger, Reference Jaeger2008). Given these limitations, we should be extremely cautious when using interaction terms, combined with an inspection of mean scores, to infer a qualitative difference in performance characterized by a localized deficit. In addition, if there are no genuine differences in profiles, we ought to conceptualize children with SLI as ‘low-language’ children, i.e. children at the tail end of the normal distribution, as opposed to a distinct diagnostic category. While this viewpoint differs from most experimental studies, it is nonetheless consistent with large-scale epidemiological studies. For example, in a study of 1,529 children, Tomblin and Zhang (Reference Tomblin and Zhang2006) found that a single factor explained performance on range of different language assessments measuring expressive and receptive vocabulary, and expressive and receptive sentence-level syntax. There also exist theoretical models which account for a range of linguistic difficulties in SLI using a single language-related factor, thereby undermining the claim for localized difficulties. For example, it has been suggested that lexical and morphological development are closely synchronized, with lexical learning providing the raw materials for acquiring morphemes (Conti-Ramsden & Jones, Reference Conti-Ramsden and Jones1997).
Though calling into question theories of profile differences, the data did support the claim that children with SLI have difficulties with thematic role assignment (Friedmann & Novogrodsky, Reference Friedmann and Novogrodsky2007). While changing object relatives into subject relatives, they failed to switch Noun Phrases in order to preserve meaning, e.g. there's the cat that the dog chased → there's the cat that chased the dog, and were therefore oblivious to thematic role changes. It is also true that thematic role errors tended to occur in object relatives, which at first glance supports the argument that thematic role assignment is particularly difficult in the context of non-canonical sentences. However, thematic role errors were only observable precisely because the non-canonical sentences resulted in changes to word order. As canonical sentences rarely elicited such word order errors, it is difficult to determine whether these posed difficulties with thematic role assignment. Overall, the data indicate difficulties with thematic role assignment but, arguably, the paradigm is not well suited for investigating whether these are subject to structural constraints.
Limitations
From a statistical perspective, there are a number of potential difficulties with the study. The claim of no differences in profiles is based on a null result which may reflect limited statistical power. It could be argued that the confidence intervals for the crucial interaction term (Table 4) were relatively narrow, suggesting good generalization to different populations and/or items. Unfortunately, there are no objective criteria for determining ‘acceptable’ intervals. Nonetheless, even if the study were underpowered, the contrasting findings for the ANOVA and GLM support the key claim that one's choice of model may critically affect the interaction term. Another statistical issue is the strong rightward skew in the data, which required a complex analysis. It could be argued that these kinds of data are atypical, and therefore should not form the basis for more general claims related to quantitative methods. However, given that near-ceiling, or near-floor, performance is widely observed in the research literature (e.g. Deevy & Leonard, Reference Deevy and Leonard2004; Novogrodsky & Friedmann, Reference Novogrodsky and Friedmann2006), it is likely that the distribution observed in the current study is relatively common. A further statistical issue is the nature of the dependent variable. The LDm is only quasi-count, in that it calculates many different types of errors (addition, substitution, omission), and the minimum distance can involve more than one set of operations. However, count models (e.g. negative binomial) clearly fit the distribution of the data better than non-count models (Gaussian), suggesting that treating the LDm as a count variable is statistically justifiable. Finally, it should be noted that the random effects for the logistic regression needed to be simplified for the model to converge, which may reflect limited statistical power. Such simplification is likely to increase p-values, and therefore impact on moderately significant effects. As there were no moderately significant terms, it is debatable whether simplification of random effects greatly impacts on the findings.
Moving on to theoretical considerations, it could be argued that the study did not find different profiles because it failed to recruit children with genuine syntactic difficulties. In support of this there was clear heterogeneity with regard to qualitative error profiles, with a group of three children with SLI exhibiting a very strong tendency to transform non-canonical into canonical sentences. This is consistent with claims for a subgroup of language-impaired children with particularly severe syntactic difficulties (Friedmann & Novogrodsky, Reference Friedmann and Novogrodsky2011; van der Lely, Reference van der Lely2005). Analysis of other measures partially supported this interpretation, with two children exhibiting a particularly high error rate on non-canonical sentences. This heterogeneity suggests that the screening measures may not have succeeded in identifying children with genuine structural language difficulties, and this would account for the failure to identify an atypical profile in the group as a whole. While this remains a possibility, it should be noted that the language screening measures did assess structural abilities, e.g. syntactic morphemes (CELF-WS) and complex sentences (TROG). Moreover, setting aside debates on screening protocols, the discrepant findings for the ANOVA and GLM support the key claim that inferences based on interaction terms are problematic. Overall, though the study critiques claims of a localized syntactic deficit in SLI, it nonetheless raises the possibility of a relatively rare SLI subgroup exhibiting localized syntactic difficulties. To resolve this issue it is clearly important that studies investigate individual as well as group profiles.
Another potentially problematic aspect of the study is the relatively strong performance of the LM children on a number of language assessments, though crucially not the MLUw, which was adopted as the matching variable. This complicates the language-matching process. Nonetheless, it is unlikely that a better-matched LM group would have impacted on the main finding of the study: the lack of a significant profile difference according to the GLM.
A final extremely important point to make is that analyses of cross-sectional data are limited as they do not reveal developmental trajectories. Highly powered longitudinal studies at the macro-level, i.e. across linguistic domains, demonstrate that children with SLI are more delayed in their performance on morphosyntactic assessments than they are on vocabulary assessments (Rice, Reference Rice2013). These growth curves indicate that certain subdomains, e.g. morphosyntax, may be more severely affected/delayed than others. In addition, the current study identified a further asynchrony, with the SR performance of the children with SLI lagging behind those of developmental controls. In conclusion, while inferences based on cross-sectional data are problematic, existing evidence for qualitative differences from longitudinal data is harder to dismiss. Consequently, longitudinal datasets may provide a better way of addressing the delay-versus-difference debate.
Future directions
It is widely argued that SLI is characterized by qualitatively unusual profiles. However, the current analysis suggests that existing methods to determine profile differences in cross-sectional data may be unreliable, and GLMs may offer a better alternative. If the claims are correct, then the move away from ANOVAs towards GLMs, currently popular in the research literature, may result in a weakening of the claim for distinct syntactic profiles, and in a move towards a conception of SLI as ‘low-language’ children. It would also be interesting to find out whether GLM analyses of already published data further support the claim that children with SLI are qualitatively distinct. As a caveat, the analysis does not address other evidence in favour of SLI as a distinct category, including the existence of developmental asynchronies (Rice, Reference Rice2013), and idiosyncratic error types, such as difficulties assigning thematic roles (Friedmann & Novogrodsky, Reference Friedmann and Novogrodsky2007).
While there is strong evidence to support the use of SR as a measure of linguistic competence (Potter & Lombardi, Reference Potter and Lombardi1998), it is a relatively artificial task and is likely to tap into other mechanisms such as Phonological STM (Riches, Reference Riches2012). Therefore, it is recommended that GLMs be used to analyze profiles in more ecologically valid comprehension and elicitation tasks. GLMs could also be extended to investigate other types of profiles, for example profiles within linguistic subdomains, such as regular versus irregular verb morphology as investigated by van der Lely and Ullman (Reference van der Lely and Ullman2001).
SUPPLEMENTARY MATERIALS
For supplementary materials for this paper, please visit http://dx.doi.org/10.1017/S0305000915000847.