Introduction
Freshwater ecosystems are particularly vulnerable to anthropogenic changes. These ecosystems are usually exposed to multiple combined stressors, such as land-use intensification and the construction of hydroelectric plants (Pineda et al. Reference Pineda, Velho, de Carvalho and Rodrigues2024; Woodward et al. Reference Woodward, Perkins and Brown2010). In particular, damming rivers to build reservoirs is one of the biggest threats to freshwater biodiversity (Du et al. Reference Du, Xia, Zeng and Tu2024). Reservoirs provide various benefits to human society, including electricity generation, flood control, agricultural irrigation, recreation, and water supply (Azevedo-Santos et al. Reference Azevedo-Santos, Fearnside, Arcifa, Tonella, Giarrizzo, Pelicice, Agostinho, Magurran and LeRoy Poff2024; Chen et al. Reference Chen, Chen, Chen, Lin, Zhuang, Zhang, Ni, Xia, Lin, Xiao, Tang, Feng and Ma2024; Wang et al. Reference Wang, Li, Zhong, Yi, Yue, Han, Wu, He and Liu2024). Despite the benefits, the construction of dams triggers multiple environmental changes in rivers, including changes in river dynamics (altering drought and flood patterns), sediment loading, nutrient availability, and water quality, which in turn harm aquatic biodiversity (Guimarães Durán et al. Reference Guimarães Durán, Lansac-Tôha, Meira, Santana, Oliveira, Matos and Velho2024).
Among the impacts caused by dam construction, the replacement of lotic systems with lentic environments stands out, as it profoundly alters the structure and functioning of aquatic ecosystems (Agostinho et al. Reference Agostinho, Gomes, Pelicice, Agostinho, Gomes and Pelicice2007). During the reservoir filling process, these changes become even more intense, as the flooding of large areas leads to the submersion of soils and vegetation, producing abrupt modifications in the physical and chemical conditions of the water (Sevindik et al. Reference Sevindik, Çetin, Tekbaba and Güzel2025; Stamenković et al. Reference Stamenković, Stojković Piperac, Čerba, Milošević, Ostojić, Đorđević, Simić, Cvijanović and Buzhdygan2022). The blockage of sediment transport in upstream regions, as well as the deposition of these materials in the lacustrine zone of the reservoir, contributes to the limnological reconfiguration of the system (Domingues et al. Reference Domingues, Sobrino and Galvão2007).
In addition, the formation of the lentic environment establishes a new hydrodynamic regime, characterised by longer water residence times and the occurrence of vertical stratification (Li et al. Reference Li, Wang, Liu, Yang, Liu and Xu2022; Lu et al. Reference Lu, Tang, Li and Li2022). This process creates distinct environmental compartments between the strata of the water column. While the surface strata are influenced by light penetration and photosynthetic activity, the deeper strata tend to exhibit hypoxic conditions, intensified by the decomposition of organic matter and greater accumulation of detritus (Li et al. Reference Li, Wang, Liu, Yang, Liu and Xu2022). These transformations promote pronounced environmental heterogeneity, recognised as one of the main ecological mechanisms capable of influencing the structure of biological communities (MacArthur and MacArthur Reference MacArthur and MacArthur1961; Wetzel Reference Wetzel2001). Thus, the new ecological scenario resulting from filling and stratification can strongly modulate the distribution, abundance, and diversity of planktonic communities.
The hydrological and limnological reorganisation caused by damming exerts direct effects on the structure and dynamics of aquatic communities. Differences between strata and filling periods structure the community vertically and drive ecological reorganisation processes over time (Domingues et al. Reference Domingues, Sobrino and Galvão2007). Several studies in tropical reservoirs have shown that filling leads initially to the predominance of opportunistic and tolerant species, followed by a gradual increase in the proportion of more competitive and specialised species (Araujo et al. Reference Araujo, Dineli Bobrowiec, Stevens, Moura, Sábato, Sábato and Magnusson2024). This pattern is consistent with the classical ecological succession model proposed by Clements (Reference Clements1916) and with the life-history strategies theory formulated by Pianka (Reference Pianka1970), which proposes that, after a disturbance, ecosystems undergo a directional replacement of species, with increasing stability, energy efficiency, and structural complexity over time (Odum Reference Odum1969). In tropical reservoirs, these transitions are particularly rapid and intense, given the high temperatures, productivity, and nutrient availability immediately after flooding.
Among planktonic microbial communities, ciliate protists stand out for their functional and ecological roles in aquatic environments. As intermediate consumers, they prey on bacteria and microalgae, regulating the abundance of producers and decomposers and mediating the flow of energy and matter in the pelagic food web (Oliveira et al. Reference Oliveira, Lansac-Tôha, Meira, Progênio and Velho2024). Their high sensitivity to environmental changes and short generation times make them effective indicators of disturbances and ecological transitions (Gu et al. Reference Gu, Huang, Zhang, Li, Wang, Wang, Sun, Wang, Zhang, Jiao and Xu2022). Recent studies show that selective predation by ciliates and other microorganisms not only shapes microbial diversity but also affects global processes such as biological carbon export and trophic efficiency (Taniguchi and Menden-Deuer Reference Taniguchi and Menden-Deuer2023). In tropical reservoirs, particularly under vertical stratification and abrupt changes caused by filling, planktonic ciliates play a central role in the initial ecological reorganisation, influencing community structure and potentially modulating the amount of carbon transferred to higher trophic levels or retained within the microbial loop (Azam et al. Reference Azam, Fenchel, Field, Gray, Meyer-Reil and FJMEPS1983). Some recent studies have pointed out that hydrological changes caused by dams can affect ciliate communities. Guimarães-Durán et al. (Reference Guimarães Durán, Lansac-Tôha, Meira, Santana, Oliveira, Matos and Velho2024) demonstrated that reservoir formation may lead to substantial shifts in species composition, with progressive species loss over time. Similarly, Kulaš et al. (Reference Kulaš, Gulin, Matoničkin Kepčija, Žutinić, Sertić Perić, Orlić, Kajan, Stoeck, Lentendu, Čanjevac, Martinić and Gligora Udovič2021) showed that ciliates respond sensitively to changes in flow regime and environmental pressure, reinforcing their potential as bioindicators. These findings highlight how dam-induced changes in stratification, nutrient dynamics, and hydrological stability can significantly influence the structure and functioning of ciliate assemblages.
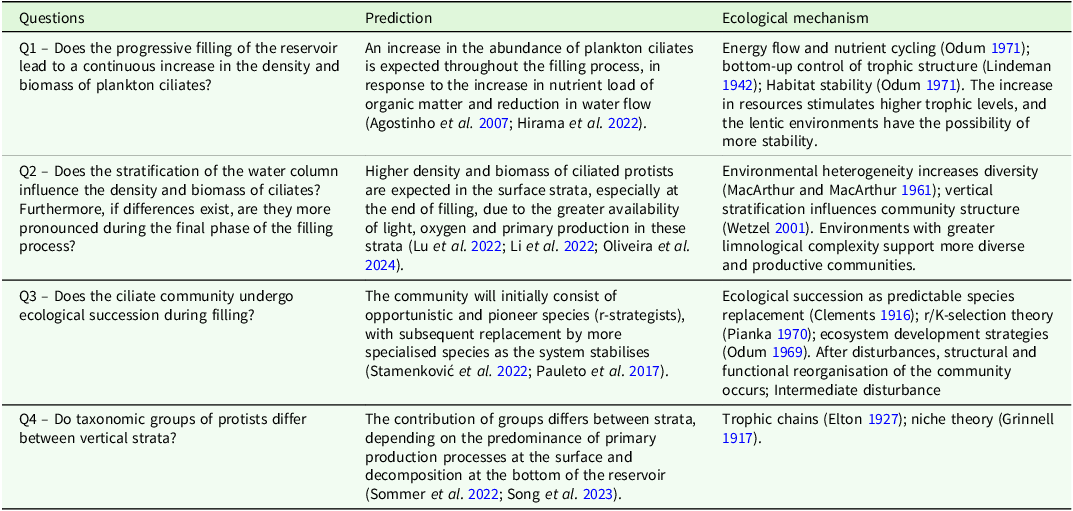
Despite their ecological importance, ciliate protists remain underrepresented in monitoring and environmental assessment studies in tropical reservoirs, especially during the filling phase. This stage represents a critical window of biotic reorganisation, marked by profound changes in trophic pathways and nutrient cycling (Al et al. 2022). Thus, this study aims to fill a relevant gap in the literature by investigating how the density, biomass, and community structure of ciliate protists vary throughout the reservoir filling process, considering vertical stratification, ecological succession, and potential impacts on carbon metabolism (Table 1).
Question (hypotheses), predictions, and proposed ecological mechanisms to explain variations in the density and biomass of ciliate protists during the filling process of the Santa Clara Reservoir (Paraná, Brazil). The hypotheses consider vertical effects (water column stratification), temporal effects (filling periods), and microbial ecological succession resulting from the formation of the new reservoir

Supplementary Material 1 – Variation of depth along the reservoir filling. Minimum = 8 metres; Maximum = 59.50 metres.
Supplementary Material 2 – Distribution of environmental parameters in the strata (surface and bottom). The central line in the graphs indicates the median values. The bars represent, respectively, the lowest and highest values within 1.5 times the interquartile range below the percentage limits and the black dots, above or below the plots, indicate the outlier values.
Supplementary Material 3 – Distribution of environmental parameters in the filling periods (beginning, middle and end). The central line in the graphs indicates the median values. The bars represent, respectively, the lowest and highest values within 1.5 times the interquartile range below the percentage limits and the black dots, above or below the plots, indicate the outlier values.
Methods
Study area
The Santa Clara Reservoir is located on the Jordão River, in the central-southern region of the Paraná State, Brazil (25°38′S; 51°57′O; Figure 1). This reservoir has a depth of 67 metres and a surface area of 20 km2, with the capacity to generate 120 Megawatts of energy. The filling process began on April 21, 2005, and was completed on June 22, 2005, covering 60 sampling days.
Study area with the location of the sampling station. The Santa Clara Reservoir is located in the state of Paraná, Brazil. * = sampling station.

The initial reservoir filling was separated into three periods: beginning, middle, and end filling periods. The beginning of the filling period was defined from day 1 (D1) to day 9 (D9) of filling. The intermediate filling period (middle), obtained by stabilising the filling of the reservoir, was determined between day 13 (D13) and day 28 (D28) of filling. Finally, the end of the filling period was defined between days 32 (D32) and 60 (D60), when the reservoir was totally filled. The beginning filling period encompassed the earliest reactions to changes in hydrology; the middle of filling lasted until the end of the first month, accounting for roughly half of the estimated time required for full reservoir filling; the end of filling was characterised by diminished hydrodynamic activity in the lacustrine area, with vertical stratification becoming the dominant feature.
Sampling
During the reservoir filling process, one sample per stratum was taken daily until day 9, followed every three days until day 38, and then on days 52 and 60, totalling 18 samples in each stratum. The samples were obtained at the subsurface (30 cm deep) and close to the bottom (depth that changes along with the filling). The depth ranged from a minimum of 8 metres (beginning of filling) to a maximum of 59.50 metres (end of filling) during the sampling period (See Supplementary Material 1). To collect the plankton ciliates community, five litres of water (Oliveira et al. Reference Oliveira, Lansac-Tôha, Meira, Progênio and Velho2024) were collected from each strata (surface and bottom), using a Van Dorn bottle. These 5L were concentrated into 100mL using a plankton net with a mesh opening of 10 micrometres. The samples collected for estimating the density and biomass of protists were preserved in 100 mL glass jars and fixed with a solution composed of alkaline Lugol, formaldehyde buffered with calcium borate and sodium thiosulphate, as described by Sherr and Sherr (Reference Sherr, Sherr, Kemp, Sherr, Sherr and Cole1993).
The following abiotic variables were measured in the field: water temperature (℃) and dissolved oxygen (mg/L) were measured using a YSI meter (Model 55-12FT). The variables pH and electrical conductivity (µS/cm) were measured using a conductivity metre (Digimed brand), while turbidity (NTU) was obtained using a LaMotte turbidimeter. The concentrations of total alkalinity (mEq/L), Chlorophyll-a (µg/L), total phosphorus (µg/L), total nitrogen (µg/L), suspended matter (mg/L), and dissolved organic carbon (mg/L) (Carmouze Reference Carmouze1994) were determined in the Basic Limnology laboratory at the State University of Maringá.
Laboratory analysis
To estimate the density and biomass of ciliated protists, each sample (100 mL) was previously stained with the “rose bengal” dye. After that, the samples were placed in sedimentation chambers (10 mL), following the method described by Utermöhl (Reference Utermöhl1958) and quantified using an inverted microscope (Olympus, model CK40) at 400x magnification. To estimate biomass, up to 30 cells for each group were measured (width and length) using micrometric ocular and their biovolume (µm3) was calculated from approximate geometric shapes. The depth of each cell was assumed to be half the width of the cells. The carbon content (µgC.L−1) was estimated using the factor of 110 carbon femtograms (fgC; Weisse, Reference Weisse1991). Community density and biomass were expressed in cells.L−1 and μgC.L−1, respectively. Ciliate protists were identified at the group level, based on the higher-level classification scheme provided by Foissner and Berger (Reference Foissner and Berger1996) and Foissner et al. (Reference Foissner, Berger and Schaumburg1999). Since species-level identification was not possible with the available material, taxa were assigned to the most consistent higher hierarchical category used in these works (e.g., class, subclass, or order).
Data analysis
In order to assess the variation in environmental conditions (physico-chemical/abiotic factors) and the differences between the strata and filling period, a principal component analysis (PCA; Greenacre et al. Reference Greenacre, Groenen, Hastie, d’Enza, Markos and Tuzhilina2022) was performed.
To visualise how the attributes of the taxonomic groups varied between filling days and between periods, for both strata, stacked area line graphs (for visualisation between days) and relative contribution graphs (in percentage for visualisation between the three filling periods) were formulated. These graphs were created using the ggplot2 package (Wickham et al. Reference Wickham2016).
To test our hypothesis, which considers the differences between filling in the community for both strata, a linear mixed-effect model (LMM) was employed. These models were chosen due to the repetition of the “day” factor, which was included as a random effect to control dependence in the data, and “strata” as a fixed effect. To conduct this analysis, all the assumptions were verified. The models were adjusted using the “lmer” function from the lme4 package (Bates et al. Reference Bates, Maechler, Bolker, Walker, Christensen, Singmann, Dai, Scheipl, Grothendieck, Green, Fox, Bauer, Krivitsky, Tanaka, Jagan and Boylan2015). All LMM results with p-values < 0.05 were considered significant.
To identify tendencies of density and biomass over the study time, we performed a generalised additive model (GAM) to evaluate potential temporal trends in these metrics between surface and bottom along the filling periods. The GAMs were implemented using the “mgcv” package in R (Wood Reference Wood2016), separately for density and biomass. We adopted a negative binomial distribution with a log link function for both variables to account for overdispersion and the discrete nature of the data. GAMs extend the classical generalised linear model (GLM) framework by replacing the linear predictor with a non-parametric smoothing function, which allows for the modelling of potentially nonlinear temporal patterns (Wood Reference Wood2006).
All analyses were performed with the R 4.4.3 software (R Core Team 2024) using vegan (Oksanen et al. Reference Oksanen, Blanchet, Friendly, Kindt, Legendre, McGlinn, Minchin, O’Hara, Simpson, Solymos, Stevens, Szoecs and Wagner2017), lmerTest (Kuznetsova et al. Reference Kuznetsova, Brockhoff and Christensen2017), emmeans (Lenth Reference Lenth2022), and tidyverse packages (Wickham et al. Reference Wickham, Averick, Bryan, Chang, D’Agostino McGowan, François, Grolemund, Hayes, Henry, Hester, Kuhn, Lin Pedersen, Miller, Bache, Müller, Ooms, Robinson, Seidel, Spinu, Takahashi, Vaughan, Wilke, Woo and Yutani2019).
Results
Principal components analysis
The principal component analysis (PCA; Figure 2) revealed a segregation between the strata and filling period analysed (surface and bottom, and beginning, middle and end of the filling period), based on the differences in environmental characteristics between them.
Principal Component Analysis (PCA) showing the distribution of strata (surface and bottom) and filling period (beginning, middle and end). The first principal axis (Dim1) explained 32.4% of the total variance in the data, while the second principal axis (Dim2) explained 24.5%, totalling 56.9% of the accumulated variance. TN = Total Nitrogen; Turb = Turbidity; DO = Dissolved Oxygen; DOC = Dissolved Organic Carbon; TP = Total Phosphorus; Cl = Chlorophyll-a; Cond = Conductivity.

The observed segregation was clearly evidenced along the axes. In general, on the one hand, Axis 1 highlights a clear vertical segregation in environmental characteristics. Surface samples were positively correlated with this axis, being associated with higher values of conductivity (Cond), dissolved organic carbon (DOC), Chlorophyll-a and pH (Figure 2). Conversely, bottom samples, especially from the middle and end of the filling period, were negatively associated with Axis 1 and correlated with higher turbidity (Turb) and total nitrogen (TN). Bottom samples from the beginning of the filling period showed intermediate positioning, partially overlapping with surface samples from the same period.
On the other hand, Axis 2 primarily accounted for temporal segregation among the filling periods. Samples from the beginning and middle of the filling period were positively correlated with this axis, being associated with higher total phosphorus (TP) values. In contrast, samples from the end of the filling period were negatively correlated with Axis 2, showing stronger associations with higher water temperature and dissolved oxygen (DO) (Figure 2). Detailed values of environmental variables for each stratum and filling period are presented in Supplementary Materials 2 and 3.
Density and biomass by strata and filling period
The GAM graph of planktonic ciliate community between strata and days of filling revealed distinct patterns between the two strata over the 60 days of reservoir filling. For total density (Figure 3A), an initial growth of the attribute was observed in both strata. However, the surface maintained higher density values throughout the period. At the end of the period (D60), the attribute values were lower than the initial values, indicating a reduction in community density.
Smoothing curves obtained from generalised additive models (GAMs) showing temporal fluctuations in density (cells.L−1) and biomass (µgC.L−1) of ciliates across the strata per days of filling. Density and biomass data were logarithmised only in the graphical display, to improve the observation.

Regarding biomass (Figure 3B), the same difference was observed between the strata. Both strata showed initial growth, with the surface showing a stabilisation during the final days of filling. However, at the bottom, despite an initial growth trend, lower biomass values were observed in this strata.
The results of the linear mixed-effect models (LMM) indicated differences between the filling days for both strata, with the surface strata being the most representative, having significance for both attributes (T value = 8.115, p = 0.011 for density; T value = 5.063, p = 0.037 for biomass).
The density and biomass of ciliates varied over the sampling days, with higher density values observed in the middle period at the surface, while at the bottom, the values remained relatively low, with little increase over the same period (Figure 4A). For the biomass (Figure 4B), there was an increase in the attribute at the surface over time (highest value on D28). At the bottom, biomass values remained low and stable, maintaining the pattern of less temporal variation in this strata.
Variation in the richness of taxonomic groups in density (A) and biomass (B) between filling days for the ciliated protist community between the two strata (bottom and surface). The central line in boxplots denotes the median values, and bars represent the smallest and largest value within 1.5 times the interquartile range below the percentage limits. The “Y” axis in boxplots was logarithmised for better graphical observation.

Regarding the filling period, the values varied between the surface and the bottom. For the surface, higher values of the attributes (density and biomass) were observed in the middle and end of the filling. At the bottom, there were no clear differences between the filling periods for the attributes.
Composition of taxonomic groups
The density values of planktonic ciliates ranged from a minimum of 35 cells.L−1 to a maximum of 11,230 cells.L−1among the filling periods at the surface, while at the bottom, values varied from 15 cells.L−1 to 1,685 cells.L−1 across the filling periods. The highest densities were observed on D16 at the surface (middle of the filling period) and on D13 at the bottom (also middle of the filling period). Regarding biomass, the values ranged from 181.63 µgC.L−1 to 309,867.68 µgC.L−1 at the surface, while at the bottom, they varied between 46.59 µgC.L−1 and 3,427.29 µgC.L−1. The highest biomass at the surface occurred on D28 (middle of the filling period), and on D25 at the bottom (middle of the filling period).
Throughout the study, 13 taxonomic groups of protist ciliates were recorded, showing differences in biomass and density contribution along the filling period. Regarding the strata (surface and bottom), there were differences between the taxonomic groups for the different attributes. The highest density (Figure 5A) and biomass (Figure 5C) values occurred at the surface, with the Oligotrichida, Gymnostomatida, and Peritrichia being the most representative. On the bottom, the density (Figure 5B) and biomass (Figure 5D) were lower and more stable along the studied period, with a predominance of Oligotrichida, Prostomatida, and Hymenostomata groups.

When analysing the relative contribution of taxonomic groups along the three filling periods, distinct patterns were observed between the surface and bottom strata (Figures 5 and 6). In general, the analysis of the percentage distribution of density and biomass revealed well-defined variations between the different strata. On the surface, density represented 85.3% of the total for this attribute, compared to 14.7% for the bottom. Similarly, for biomass, the surface showed higher percentage values, representing 98.1% of the total, while the bottom represented only 1.9% of the attribute.
Percentage of density and biomass of taxonomic groups of protist ciliates. Other less representative Groups = Pleurostomatida, Cyrtophorida, Suctorida, and Nassulida.

Specifically, considering the percentage distribution among the ciliate groups, at the surface, the highest contributions to density were recorded for Oligotrichida during the beginning of the filling (46.7%), Gymnostomatida in the middle period (51.5%), and Peritrichia at the end (65.2%). In terms of biomass, Hymenostomata were the most dominant in both the beginning (31.6%) and middle (68.7%) of the filling, while Peritrichia showed the highest contribution at the end of the period (56%) (Figure 6). At the bottom, Oligotrichida strongly dominated density in the beginning (82.3%) and middle (63.2%) phases. In the final stage, however, Prostomatida became the most representative group, contributing 29.4% to total density. Regarding biomass, the highest contributions were from Oligotrichida in the beginning (54%), Hymenostomata in the middle (59.2%), and again Prostomatida at the end of the filling, with 73% of the total biomass (Figure 6).
Discussion
In this study, we examined the dynamics of the planktonic ciliate community during the initial filling of a tropical reservoir. We addressed four hypotheses related to (Q1) temporal trends in ciliate density and biomass during filling, (Q2) the role of vertical stratification, (Q3) successional replacement of taxonomic groups, and (Q4) differences in group composition between strata. Overall, the first hypothesis was not fully supported: density and biomass did not increase continuously throughout the filling period, but rather showed an initial increase followed by a decline towards the end of filling. By contrast, the second, third, and fourth hypotheses were supported by our data, as density and biomass were consistently higher at the surface, the community exhibited a clear successional signal, and the contribution of taxonomic groups differed markedly between strata. In the following sections, we discuss each hypothesis in turn and place our findings in the context of previous work on reservoir filling.
In the same reservoir and filling event, Jati et al. (Reference Jati, Bortolini and Train2017) analysed phytoplankton functional groups and showed that low light availability and strong mixing constrained primary production, while mixotrophic flagellates dominated and the microbial loop represented an important pathway for carbon transfer. Building on this limnological background, our study focuses on the next trophic level of the microbial food web by examining planktonic ciliates, which link bacteria and phytoplankton to higher consumers. Using a higher temporal resolution and two contrasting strata (surface and bottom), we quantify how intermediate consumers responded to the same hydrological transition, both in terms of density and biomass and in terms of shifts in taxonomic groups. In this way, our study supported the Jati et al. (Reference Jati, Bortolini and Train2017) findings, and adds notable new insights: it extends the trophic surge framework to microbial consumers, documents a rapid successional sequence of ciliate groups over a short filling window, and provides a high-resolution description of vertical differences in planktonic communities’ structure during reservoir filling.
Our findings also allow us to propose a conceptual model that links the disturbances associated with reservoir filling to changes in planktonic ciliate density, biomass, and taxonomic groups composition in the surface and bottom strata (Figure. 7). We stress, however, that this model is built on data from a single reservoir and a relatively short filling period, and should therefore be viewed as a preliminary, working hypothesis whose generality must be tested with additional, independent datasets.
A model of the dam and filling effect on the ciliate community attributes. The numerals 1, 2, and 3 represent the filling periods (beginning, middle and end, respectively).

Concerning the environmental variables, the greater relevance of pH and dissolved oxygen at the surface, particularly during the initial filling period (Wang et al. Reference Wang, Li, He, Shi and He2021), is due to enhanced photosynthetic activity by autotrophic organisms, which also serve as resources for protists (Lin et al. Reference Lin, Wang, Chen, Fang, Zhang and Cao2021; Massicote et al. Reference Massicotte, Asmala, Stedmon and Markager2017). In contrast, the bottom strata were characterised by higher concentrations of total nitrogen, turbidity, and total phosphorus, suggesting nutrient enrichment and particulate accumulation due to sedimentation and reduced vertical mixing (Beutel and Horne Reference Beutel and Horne2018; Noori et al. Reference Noori, Ansari, Bhattarai, Tang, Aradpour, Maghrebi, Torabi Haghighi, Bengtsson and Kløve2021). This vertical stratification highlights the spatial heterogeneity of the reservoir and indicates that distinct ecological processes operate across depths, such as intensified interspecific competition at the bottom (Wang et al. Reference Wang, Liao, Wang, Yuan, Hu, Xing and Xu2023). Complementarily, the transformation from a lotic to a lentic environment, after a damming, may result in low concentrations of suspended material and nutrients near the dams, influencing the plankton communities (Mendonça et al. Reference Mendonça, Velho, Vieira and Carvalho2025). Regarding the vertical stratification in the filling of the reservoir, Turgeon et al. (Reference Turgeon, Solomon, Nozais and Gregory-Eaves2016) highlight that this process triggers a series of predictable but temporary ecological changes, based on the trophic surge hypothesis (TSH). This phenomenon is driven by the decomposition of submerged terrestrial organic matter, releasing a large amount of nutrients, such as phosphorus, into the water column (Mendonça et al. Reference Mendonça, Velho, Vieira and Carvalho2025). This influx of nutrients stimulates a rapid increase in primary productivity, which, in turn, supports growth in the populations of plankton ciliates (Lin et al. Reference Lin, Wang, Chen, Fang, Zhang and Cao2021; Massicote et al. Reference Massicotte, Asmala, Stedmon and Markager2017).
Accordingly, our results showed significantly higher values of density and biomass at the surface across the sampling period. These patterns were supported by the linear mixed-effects models and GAMs, which revealed higher and more variable values in the surface strata, particularly in the middle phase of filling. In contrast, the bottom exhibited lower and more stable values for both attributes. The elevated oxygen and light availability in the surface strata likely favour greater metabolic activity, growth, and reproduction among heterotrophic ciliates (Velho et al. Reference Velho, Lansac-Tôha, Buosi, de Meira, Cabral and Lansac-Tôha2013; Zhu et al. Reference Zhu, Qin, Ma, Xi, Zuo, Pan and Li2020). Conversely, the elevated turbidity and sedimentation observed at the bottom likely constrain protist development, and low oxygen conditions in the deeper strata may reduce diversity (Suter et al. Reference Suter, Pachiadaki, Taylor and Edgcomb2022).
Over time, we observed a clear successional pattern in the ciliate community. In the early days of filling (D1–D9), Hymenostomata dominated both strata, reflecting their benthic or littoral habits and broad trophic flexibility (Velho et al. Reference Velho, Lansac-Tôha, Buosi, de Meira, Cabral and Lansac-Tôha2013). Over the middle period of filling (D13–D28), Gymnostomatida became the dominant group, particularly at the surface, likely due to increased organic matter in the environment. These organisms are considered indicators of enriched conditions (Buosi et al. Reference Buosi, Pauleto, Lansac-Tôha and Velho2011; Foissner Reference Foissner1995), and their increase may also be related to the predation of Hymenostomata, which were abundant earlier (Novais et al. Reference Novais, Medeiros, Rocha, Fraga, Queiroz and Silva2024). The peaks of Colpodea and Peritrichia in abundance and biomass at the surface, at the end of the filling phase, might be related to the fact that they are highly adaptable and reproduce rapidly under favourable conditions. Besides that, Peritrichia, though not strictly planktonic, can attach to organic substrates and exploit bacteria as food resources (Cleven Reference Cleven2004; Pascualat et al. Reference Pascualat, Siebert, Garraza, Nenda and Küppers2024; Velho et al. Reference Velho, Lansac-Tôha, Buosi, de Meira, Cabral and Lansac-Tôha2013).
The observed shifts in dominant taxonomic groups indicate rapid adaptation of surface ciliate communities throughout the filling period (Guo et al. Reference Guo, Wu and Huang2020). In contrast, the bottom community showed higher initial peaks, followed by greater temporal stability, suggesting a response to changes in nutrient availability and light penetration (Sommer et al. Reference Sommer, Sonntag, Rastl, Summerer and Tartarotti2022; Zhang et al. Reference Zhang, Liu, Huang, Li, Si, Feng, Huang and Miao2021). Biomass patterns further supported these dynamics: at the surface, biomass was more evenly distributed among taxonomic groups, while at the bottom, peaks were concentrated on specific days, likely due to dominance by large-bodied taxa in response to sediment or organic matter input (Song et al. Reference Song, Liu, Xie, Li, Liu, Sen and Wang2023).
The concurrent increase in density and biomass, especially at the surface, implies that the most abundant plankton ciliates were also larger in size (Grossman et al. Reference Grossmann, Jensen, Heider, Jost, Glücksman, Hartikainen, Mahamdallie, Gardner, Hoffmann, Bass and Boenigk2016). This is consistent with the dominance of Hymenostomata and Gymnostomatida, which possess diverse feeding strategies and high carbon assimilation capacity (Novais et al. Reference Novais, Medeiros, Rocha, Fraga, Queiroz and Silva2024; Pauleto et al. Reference Pauleto, Oliveira, Segovia, Meira, Lansac-Tôha, Buosi and Velho2017). In general, protists, particularly mixotrophic and bacterivorous forms, thrive under high resource availability, such as that provided by decomposing vegetation and nutrient-rich water during the mid-filling phase (Branco et al. Reference Branco, Leal, Huszar, Farias, Saint’Pierre, Sousa-Filho, Palermo, Guarino, Gomes and Kozlowsky-Suzuki2019; Jati et al. Reference Jati, Bortolini and Train2017).
Towards the end of the filling period, the decline in density and biomass at both strata may reflect the increasing influence of top-down control by metazooplankton, which are known to exert predation pressure on protists in newly formed reservoirs (Paterson et al. Reference Paterson, Findlay, Beaty, Findlay, Schindler, Stainton and McCullough1997; Segovia et al. Reference Segovia, Pereira, Bini and Velho2014; Šimek et al. Reference Šimek, Grujčić, Nedoma, Jezberová, Šorf, Matoušů, Pechar, Posch, Bruni and Vrba2019). While microbial communities develop rapidly at the onset of flooding, subsequent increases in zooplankton abundance can suppress these populations. In addition, metazooplankton can potentially reduce ciliate abundance by competition for resources (phytoplankton and bacteria), in which they exert grazing pressure (Carpenter et al. Reference Carpenter, Cole, Hodgson, Kitchell, Pace, Bade, Cottingham, Essington, Houser and Schindler2001; Reynolds Reference Reynolds2006). This reinforces the ecological role of microbial food webs and their integration into reservoir dynamics (Chkili et al. Reference Chkili, Saint Béat, Kousri, Meddeb, Gauvin and David2024).
Overall, our findings suggest that plankton ciliate communities in reservoirs shift from homogeneous to heterogeneous configurations during the filling process (Mukherjee et al. Reference Mukherjee, Grujčić, Salcher, Znachor, Seďa, Devetter, Rychtecký, Šimek and Shabarova2024). These shifts are shaped by vertical stratification, abiotic changes, organic matter availability, and biotic interactions. Studying these communities provides important insights into ecological processes triggered by dam construction (Guo et al. Reference Guo, Zheng, Teng, Wang and Song2021). The density and biomass of ciliates are reliable indicators of environmental quality and trophic dynamics, reinforcing their value in ecological monitoring and reservoir management (Mieczan Reference Mieczan2014).
Conclusion
The results support our hypothesis, in which the strata and filling periods did influence these attributes. The surface of the reservoir exhibited higher density and biomass of ciliated protists compared to the bottom. This difference between strata was driven by distinct environmental variables, reflecting the heterogeneity of the reservoir.
The ciliate community proves to be a sensitive indicator of environmental changes, reflecting the ecological conditions of the reservoir. The rapid response of these organisms to physicochemical and biological alterations during the filling process reinforces their role as bioindicators of water quality and ecosystem health. Our results highlight the role of ciliated protists as indicators of environmental quality and trophic processes, reinforcing their importance for the monitoring and sustainable management of tropical reservoirs. Understanding these processes is essential to mitigating environmental impacts and ensuring biodiversity conservation in freshwater environments. During and after the filling of a dam, it is advisable for dam managers to mimic the natural flow of the river as much as possible in order to minimise the impact on downstream ecosystems.
Supplementary material
The supplementary material for this article can be found at https://doi.org/10.1017/S0266467425100424
Acknowledgments
We thank the Center for Research in Limnology, Ichthyology, and Aquaculture (NUPELIA) of the State University of Maringá, which provided all the support and infrastructure necessary for the study. We also thank the Foundation Coordination for the Improvement of Higher Education Personnel (CAPES; Grant number: 001) for funding the research and National Council for Scientific and Technological Development (CNPq) for continuously supporting the research developed by LFMV. We would like to express our gratitude to the reviewers for their voluntary contribution to improving the manuscript.
Ethical statement
None.
Competing interests
The authors declare no competing interests and all authors consent to this submission.