


INTRODUCTION
Arecent change in political strategy brings two long-standing and distinct areas of political science research into tension. Consider these seemingly unrelated questions: How does a candidate advertise to general election voters? What kind of person becomes a political activist? Past research has provided fairly consistent answers to these questions. General election campaigns tend to advertise with vague and generic messages, conveyed by candidates or surrogates portrayed as the everyman. The activists who dedicate time to party organizations tend to be ideologically extreme and they are demographically distinct from typical citizens. So what happens when a campaign recruits activist volunteers to act as its surrogates, having them knock on doors of millions of swing voters? Are the individuals who are willing to volunteer for campaigns well-equipped to convey messages that appeal to general election voters? Using an original survey of campaign volunteers, we suggest that grassroots mobilization activities pursued by political campaigns are highly constrained because of the atypical citizens who are willing to participate in electioneering.
The objective of this article is to develop and test a theory of “ground campaign” tactics. Whereas most political science studies of campaign strategy in the last few decades have investigated broadcasted mass appeals, the recent shift toward direct contacting efforts, which has been documented in academic writing (Hersh Reference Hersh2015; Hillygus and Shields Reference Hillygus and Shields2008) and popular writing (Issenberg Reference Issenberg2012), necessitates that we develop and revise theoretical models to capture this aspect of U.S. elections. The number of citizens participating in campaign canvassing efforts is far from trivial. The 2012 Obama campaign reportedly recruited 2.3 million volunteers, roughly one of every hundred adults in the United States. Internal Obama campaign documents claim that in a single day, November 6, 2012, 100,000 of these volunteers, in conjunction with paid campaign staff, knocked on 7 million doors (2012 Obama Campaign Legacy Report 2013). Similarly, the Romney campaign reports having contacted voters over 225 million times (Voter Contact Summary 2012). In spite of the abundance of research in the last fifteen years on the effectiveness of direct voter contact (e.g., Gerber and Green Reference Gerber and Green2000), political scientists have only begun to understand the strategy of direct voter contact.
We consider canvassing strategy as a principal-agent problem. In a mass media-oriented strategy, a candidate and team of advisers control the message transmitted to voters. In direct contacting strategies, the campaign message is mediated by thousands of volunteers. We draw attention to the problem of a campaign wanting to convey moderate, everyman messages through the vehicle of ideological and atypical messengers. A candidate may wish to capitalize on the free labor and potent strategy of using volunteers to interact with general election voters; however, the individuals willing to volunteer for campaigns may be poorly equipped as agents for the campaign. A campaign or party organization may establish processes designed to mitigate these inefficiencies; however, they have little leverage since most campaign workers perform their assigned tasks for free. Even well-financed campaigns may be unable to recruit their ideal agents. This principal-agent problem has important implications for how campaigns are waged and how voters learn about politics.
After first articulating the principal-agent problem of the ground campaign and generating hypotheses, we analyze an original survey of 3,095 staff and volunteers that we fielded in partnership with the 2012 Obama campaign and with other Democratic campaigns. We asked respondents questions identical to questions that we also posed to representative samples of the mass public. This is the first large-scale study of ground campaign volunteers, and it was conducted in real time, fielded from June through Election Day, in cooperation with the campaign popularly viewed as most adept at utilizing these tactics. Unlike other aspects of campaigning, such as financial contributing and television advertising, which have been studied in detail and for which comprehensive databases exist (e.g., Krasno and Green Reference Krasno and Green2008 and Bonica Reference Bonica2013), our survey represents the first documentation of these crucial campaign surrogates involved in direct voter contact.
Empirically, we will first show that Obama’s 2012 campaign workers were extremely liberal, even relative to strong Democrats who match the observable demographic profile of the workers. We will show that workers care about different issues than voters care about, and that their perceptions about what voters care about deviate from what issues voters actually think are important to the electorate. Volunteers working in swing states do not resemble, demographically or attitudinally, the voters they are engaging in those states, and in part this is explained by the campaign relying on out-of-state volunteers for direct contact. Liberal volunteers from California, New York, Maryland, Massachusetts, and Illinois cross state lines and interact with swing voters in battleground states, contributing to the disconnect between campaign messengers and the recipients of those messages. Most importantly, we examine plausible ways that the Obama campaign might have worked to mitigate the principal-agent problem, and we find little evidence that the campaign succeeded in doing so.
Direct contact is a tool of strategic communication, and as such a tool, the ideological and demographic mismatch between workers and voters is quite surprising. The utilization of large numbers of ideologically extreme volunteers to interact with swing voters requires us to re-evaluate classic theories of political communication. Imagine Barack Obama running a national television advertisement just before the general election, and instead of presenting a farmer, factory worker, or suburban mom explaining why they are supporting the President, the stereotypical liberal, coastal, college student explains why he or she supports the President. On TV, this would seem like a serious strategic misstep. But as we will show, the typical Obama volunteers knocking on the doors of millions of swing voters in swing states are much more like the college student than the factory worker, farmer, or mom. Though the Obama campaign developed sophisticated targeting models to guide the volunteer-based operation and strategically opened local offices so that neighbors, in theory, could contact neighbors (Masket Reference Masket2009; Sides and Vavreck Reference Sides and Vavreck2013), the Obama campaign was highly constrained in the workers it could utilize to carry its message to swing voters.
Before commencing with the theoretical and empirical investigations, two points of clarification should be emphasized. First, our study is primarily focused on the Obama campaign, but we have reason to believe that our findings are generalizable to other campaigns that utilize volunteer surrogates.Footnote 1 While the Obama campaigns garnered an unusually high rate of volunteers, volunteer-based canvassing is quite widespread in American political campaigns. Below the Presidential level, where budgets do not typically permit television advertisements, ground campaign efforts are a campaign’s chief method of voter engagement. At higher level of campaigns, there is widespread and increasing awareness among campaign operatives that personal contact is an effective method of mobilization (Green and Gerber Reference Green and Gerber2008). The best practices and techniques from academic field experiments about voter contact have been adopted by practitioners in recent years. Given the Obama campaign’s resources and supposed expertise in ground campaign strategies, this is plausibly the toughest case for demonstrating the extent of the principal-agent problem in campaign strategy.
Second, since the landmark Gerber and Green (Reference Gerber and Green2000) study of get-out-the-vote efforts, political science research on ground campaign strategies has overwhelmingly been focused on campaign effects. Our study is about elite strategy and organization, not about campaigns’ effects on voters. In that sense, it has more in common with studies of campaign messaging like Vavreck (Reference Vavreck2009) and Sides (Reference Sides2006) than with past studies of ground campaign tactics. These two distinct research agendas are, of course, in conversation with one another. Research on campaign effects has inspired real campaigns to pursue these strategies more aggressively (see Issenberg Reference Issenberg2012). In turn, our study of ground campaign organization points to new avenues for research on campaign effects, such as how the ideological distinctiveness of volunteer canvassers affects the opinions of voters with whom they engage. We will return to the implications of our findings for research on campaign effects in the Conclusion.
THE GROUND CAMPAIGN’S PRINCIPAL-AGENT PROBLEM
Campaigns, particularly Democratic campaigns, have for a long time placed some emphasis on grassroots mobilization. For example, trade unions have worked to get out the vote among their networks. However, the story of campaign messaging from approximately 1960 to 2000 was primarily a story of television communication and other mass media appeals. Direct targeting was revived as a prominent feature in Presidential campaigns when Karl Rove, an early targeting innovator, managed the Bush campaigns (Hillygus and Shields Reference Hillygus and Shields2008; Issenberg Reference Issenberg2012). Recent research (Hersh Reference Hersh2015) and the campaigns’ own assessments (2012 Obama Campaign Legacy Report 2013) suggest that the 2008 and 2012 Obama campaigns were especially engaged in this strategic avenue.
The Obama campaign was able to capitalize on much-improved data and technology, as well as the enthusiasm of supporters who participated in large numbers in volunteer-based persuasion and mobilization efforts. Following Obama’s victory in 2008, the Republican campaign in 2012 put substantial effort into grassroots voter recruitment as well. The shift in campaign strategy means both that campaigns advertise to voters differently than before—using targeted appeals transmitted by volunteer activists—and that a campaign’s interaction with the theoretical median voter is carried not just through the airwaves, but increasingly through thousands of surrogates.
The Principals
We view direct contacting strategies as a principal-agent problem. The principals here are defined as a candidate and the candidate’s inner team of advisers. The principals’ chief objective is to win election. They have a set of preferences about how best to convey messages to voters in order to achieve their goal. We may assume that the principals, at least in a Presidential campaign, have some level of professional competence in crafting and transmitting messages.
The canonical messaging strategy for a campaign in a two-stage election, under what Grofman (Reference Grofman2004) calls “the classic comic-book version of Downs (Reference Downs1957),” entails matching the ideological position of the median primary voter in the first-stage election and then shifting to the position of the median general election voter in the second stage.Footnote 2 Candidates first appeal to the active party members who compose the primary electorate and then shift and appeal to the more moderate and less engaged voters who compose the general electorate. While research on political representation has shown that candidates do not or cannot shift so easily across the ideological spectrum between the party median and the electoral median (Ansolabehere, Snyder, and Stewart Reference Ansolabehere, Snyder and Stewart III2001; Owen and Grofman Reference Owen and Grofman2006), scholars of campaign advertising have found that campaigns do indeed try to appeal to the median voter in general election campaign communications.
A campaign’s attempt at targeting the median general election voter has several empirical manifestations: First, campaigns rarely mention their party affiliation in public communications, such as on their websites (Druckman, Kifer, and Parkin Reference Druckman, Kifer and Parkin2009) or in their television advertisements.Footnote 3 Second, campaign advertisements tend to be moderate, noncommittal, and vague (e.g., Sides (Reference Sides2006)), and voters respond well to these ambiguous messages (Hersh and Schaffner Reference Hersh and Schaffner2012; Tomz and Van Houweling Reference Tomz and Van Houweling2009). Third, candidates deliver messages in recognition that voters often make decisions based on low-information cues. Voters pay attention to superficial features like candidates’ physical appearance and demographic traits (Lenz and Lawson Reference Lenz and Lawson2011; Popkin Reference Popkin1991), and they are more likely to accept messages from individuals with whom they can identify (Zaller Reference Zaller1992). Consequently, campaigns are attentive to how their advertisements portray the characteristics of the candidates and their supporters, favoring portrayals of the down-to-earth everyman (Popkin Reference Popkin1991). When they can control messaging, campaigns depict themselves in the ideological center and leverage information shortcuts that appeal to voters close the electoral median.
The Agents
When a candidate’s positions are conveyed through mass-media advertisements and are tightly controlled by the principals, a model that takes into account the preferences and behaviors of surrogates is unnecessary. Furthermore, if surrogates are machinelike regurgitators of a campaign’s message, a principal-agent model is unnecessary. However, if the positions taken by a candidate are relayed through a large and unruly group of volunteers who have substantial leeway in conveying a campaign’s message and who themselves may hold positions far different from the candidate’s positions or the targeted voters’ positions, then it is necessary to consider the motivations and interactions between the principals and agents. If principals are functionally restricted in their choice of messengers to the pool of individuals whose own political dispositions are to the extreme of the party medians, the campaign may not be able to use these messengers to adeptly convey their desired message.
Who are the agents willing to act as door-to-door canvassers and phone-bankers on a campaign? From works by Olson (Reference Olson1971), Stone and Abramowitz (Reference Stone and Abramowitz1980), and Verba, Schlozman, and Brady (Reference Verba, Schlozman and Brady1995), to more recent work by Bawn et al. (Reference Bawn, Cohen, Masket, Noel and Zaller2012) and Layman et al. (Reference Layman, Carsey, Green, Herrera and Cooperman2010), there is a clear set of expectations about the kinds of people who participate in time-based political activities like campaign activism. Volunteering is costly and typically results in no material benefits. Those who volunteer for party activities do so because they derive solidary and expressive benefits, and because they have the resources, like time and civic skills, to do so.Footnote 4 Relatedly, parties are sometimes depicted as coalitions of “intense policy demanders” (Bawn et al. Reference Bawn, Cohen, Masket, Noel and Zaller2012; Cohen et al. Reference Cohen, Karol, Noel and Zaller2009); they are controlled by ideologues with policy demands that diverge from the electoral median. In this theoretical framework, volunteers and ground-campaign staffers ought to have stronger and clearer ideological convictions than the typical citizen, and even than the typical party supporter. This is also consistent with public opinion findings that those with the strongest cognitive engagement in politics are ideologically extreme compared to the typical citizen (Zaller Reference Zaller1992).
Incentives, Limitations, and Oversight
If principals opt to use canvassers to carry their message, what is their ideal communications formula? From prior research, we know that when principals have tight control over their message, such as in TV ads, they tend to communicate to voters with moderate messages and everyman surrogates (Popkin Reference Popkin1991; Sides Reference Sides2006). We also know messages are more effective when they are conveyed neighbor-to-neighbor rather than by out-of-area activists (Middleton and Green Reference Middleton and Green2008; Rogers, Fox, and Gerber Reference Rogers, Fox and Gerber2012; Sinclair Reference Sinclair2012; Sinclair, McConnell, and Michelson Reference Sinclair, McConnell and Michelson2013), and campaigns urge their canvassers to emphasize personal connections they have to the voters, such as if they are from the same neighborhood.Footnote 5 Finally, we know that the kinds of voters who are targeted for campaign appeals—low-turnout partisans and undecided voters—tend to be more concerned about nonideological valence issues, like the state of the economy, rather than ideological issues (Zaller Reference Zaller1992, Reference Zaller1998).
While the strategic ideal may be the conveyance of moderate and vague messages by messengers who are similar to the targeted voters, it is unlikely that campaigns can meet this ideal. Herein lies the principal-agent problem. In the broadest sense, the principals and agents in this framework share a common goal: they both want to win the election for their side. In a similar sense, principals and agents in common economic models, such as firms and workers, or in common political institutional models, such as Congressmen and bureaucrats, share broad goals of maintaining a profitable business or a well-run government (see Miller Reference Miller2005). But when exploring the relationship between players beyond these superficial shared goals, it is clear that the principals and agents diverge in important ways.
Crucially, campaign workers do not need to be intentionally undermining the campaign in order for a principal-agent problem to exist. Campaign workers have personal incentives, like the desire to avoid uncomfortable conversations, appear to know the candidate’s position when they do not know them, and prioritize their own pet issues over the campaign’s issues.Footnote 6 These incentives can lead to a tension between the goals of principals and the execution by the agents. This is similar to a firm’s principal-agent problem, wherein workers want to maximize the firm’s profit but they also want to maximize their individual earnings. This additional incentive may create problems for management.
Even the volunteer who tries to communicate exactly according to principal’s script may fail as an agent. Suppose a campaign is able to select volunteers who may be mismatched to targeted voters in their demographics and ideologies, but who have other assets such as enthusiasm, charisma, and loyalty to their candidate. The loyal and enthusiastic agents may not be able to serve as good communicators to swing voters, for two reasons. First, voters derive signals from cues like the race, age, language, and accent of volunteers that are mostly outside of a volunteer’s control (see Bedolla and Michelson Reference Bedolla and Michelson2012). Because of the heuristics commonly used by voters, a volunteer possessing certain demographic traits may never be a good agent to speak on behalf of a campaign to a given set of voters, no matter what the volunteer says. Second, individuals with strong ideological preferences often project their ideology on that of their preferred candidate (Conover and Feldman Reference Conover and Feldman1982; Markus and Converse Reference Markus and Converse1979), so they may actually believe they are serving as good agents and promoting the candidate’s message, when in fact they are not. A loyal worker who only wants to represent a candidate well might have a distorted view of the candidate’s positions. Consider that across years in the American National Election Study (NES) time series, Democratic respondents who claimed that they worked for a party or a candidate rated the Democratic presidential candidate as almost a half point more liberal on a seven-point ideology scale as compared to Democratic respondents who did not claim to work for a candidate. This is suggestive of a kind of projection that may make it hard for even a loyal campaign worker to serve as an ideal agent.Footnote 7
Added to the numerous ways that the agents may pursue the principal’s goals sub-optimally, the principals are constrained in their ability to control the agents: they have limited ability to observe the agents in action and, since the agents are primarily volunteers, they cannot fire or threaten them with sanctions. Campaigns, of course, are not ignorant of the principal-agent problem, and so they can utilize strategies to keep their canvassers in check, such as (1) giving workers preset scripts to control messaging (Nickerson Reference Nickerson2007);Footnote 8 (2) sending canvassers in pairs and gathering phone callers into centralized locations to facilitate monitoring (Bedolla and Michelson Reference Bedolla and Michelson2012) (but see Linardi and McConnell (Reference Linardi and McConnell2011) on the limits of monitoring); (3) recruiting and screening volunteers rather than simply accepting any person who wishes to volunteer; (4) cultivating a culture where good work is honored and bad work is stigmatized by peers (see Linardi and McConnell Reference Linardi and McConnell2011; Benabou and Tirole Reference Benabou and Tirole2006); and (5) strategically placing volunteers, such as by recruiting neighbors to target neighbors, and by sending volunteers to target voters who shared their core traits. These strategies are akin to procedural rules that keep agents in line with principals in an institutional setting (McCubbins, Noll, and Weingast Reference McCubbins, Noll and Weingast1987).
Applications of the PA Problem
The principal-agent (PA) problem has been documented in past campaigns. The 1968 campaign of Eugene McCarthy attracted, by the standards of the time, a large number of young, enthusiastic volunteers. The McCarthy campaign, apparently aware of the problem posed by the appearance and ideology of its volunteer supporters, famously urged young volunteers to “get clean for Gene,” for example by trimming their long hair and beards. On the other side of the aisle, Ron Paul’s recent campaigns brought many volunteers to Iowa to help canvass ahead of the caucuses, and according to the New York Times, volunteers were told “to look, dress, shave, sound, and behave in a way that will not jeopardize Mr. Paul’s chances.”Footnote 9 Studying numerous community-based campaigns, Bedolla and Michelson (Reference Bedolla and Michelson2012) write that “the most overarching finding from our in-depth analysis. . .is how difficult it is for community organizations to recruit, train, and motivate high-quality canvassers (133).”
While a concern about suboptimal agents is likely to be salient in many campaigns that rely on volunteer workers, the features of the principal-agent problem described here do not necessarily apply to all ground campaigns. For example, a direct voter contact strategy employed by labor unions is different. Unions have a more stable, known pool of surrogates. Unions are standing organizations to which agents are tied long-term, and they may establish formal standards of oversight and sanctions. But the typical candidate campaign, which arises for a short-term election season and relies on willing volunteers, exhibits the features of the principal-agent problem.
If there ever was a campaign that we might expect to align agents with the principals’ incentives, it is the technologically sophisticated and resource-rich Obama 2012 campaign. And indeed, the Obama campaign reportedly used organizational strategies to align agents with the principal’s goals. Nevertheless, when one’s agents are hundreds of thousands of free-laboring canvassers who converse with voters on behalf of the campaign but with little oversight possible, differences in information, competence, or suitability between principals and agents cannot be easily overcome. Furthermore, we suspect that some of the strategies utilized by the campaign to help volunteers make personal connections to voters, such as encouraging canvassers to go off-script and relate personal stories and motivations for supporting Obama (McKenna and Han Reference McKenna and Han2013), may backfire when volunteers are so different from the population they are engaging.
A diverse set of evidence in the literature on campaigns suggests that voters often make judgements about candidates using cues based on characteristics of candidates’ supporters. Popkin (Reference Popkin and Groffman1995) uses many examples to argue that “because voters are necessarily uncertain about what a candidate will do if elected, they take into account the demographic characteristics of the candidate’s supporters” (Popkin Reference Popkin and Groffman1995, 28). A similar point has been made through an experimental design. Darley and Cooper (Reference Darley and Cooper1972) conducted a field experiment in which they randomized the appearance of young campaign workers, finding that the appearance of canvassers influenced the effectiveness of communication with voters, the voters’ ascription of policy to a candidate, and even vote choice.
Related research emphasizes how voters can infer the political identities of others based merely on appearances. Laboratory subjects can decipher the political party affiliation of both unfamiliar elected officials and college students (Rule and Ambady Reference Rule and Ambady2010) and can identify the political ideology of unknown politicians (Bull and Hawkes Reference Bull and Hawkes1982), including those from other countries (Samochowiec, Wänke, and Fiedler Reference Samochowiec, Wänke and Fiedler2010).Footnote 10 These inferences can be based on the appearance and characteristics of a candidate’s supporters: Berinsky et al. (Reference Berinsky, de Benedictis-Kessner, Goldberg and Margolis2014) use a survey experiment to demonstrate that the images of a candidate’s putative supporters as displayed on campaign material are used by voters to infer traits about the candidate.
Not only do voters draw inferences about candidates from supporters, but studies on mobilization have also demonstrated the importance of the identities of canvassers. Leighley (Reference Leighley2001) uses surveys to demonstrate that African American citizens are most successfully mobilized by other African Americans. Shaw, de la Garza, and Lee (Reference Shaw, de la Garza and Lee2000) also use surveys and validated vote returns to demonstrate that voting among Latinos in 1996 was strongly influenced by contact by Latino political groups. Michelson (Reference Michelson2003) and Michelson (Reference Michelson2006) use field experiments to study the most effective mobilization techniques for certain Latino voters, finding “solid evidence that face-to-face canvassing can have a statistically significant and substantively large effect on voter turnout when the canvasser and the targeted voter share ethnicity and political partisanship” (Michelson Reference Michelson2003, 258) and that Latino voters were most successfully reached by Latino contactors (Michelson Reference Michelson2006).Footnote 11 A field experiment analyzed by Sinclair (Reference Sinclair2012) and Sinclair, McConnell, and Michelson (Reference Sinclair, McConnell and Michelson2013) found that volunteers canvassing within their ZIP code were much more effective at increasing turnout than volunteers working out of their area. A study by Middleton and Green (Reference Middleton and Green2008) found some of the largest mobilization effects in the literature in a context in which canvassers were all local. Bedolla and Michelson (Reference Bedolla and Michelson2012) found strong positive effects of canvassing on turnout when canvassers were drawn from the same communities as targeted voters, thus facilitating “sociocultural interaction.” Taken together, these studies suggest that campaigns failing to match canvassers and voters will not be as effective as those that do, all else equal.
Several recent studies of campaign effect suggest that the ground campaign efforts to persuade and mobilize voters may be suboptimally helping campaigns, and that the culprit may be ill-suited messages and messengers. A field experiment conducted with an Obama-supporting organization in 2008 and analyzed by Bailey, Hopkins, and Rogers (Reference Bailey, Hopkins and Rogers2013) found that voters who were contacted by in-person canvassers, but not by mail, actually became less likely to support Obama than the control group. A series of survey experiments by Hersh and Schaffner (Reference Hersh and Schaffner2012) suggest that when campaigns mistarget voters based on simple demographic traits, like delivering a Hispanic message to a non-Hispanic voter, the message backfires. Gillespie (Reference Gillespie2005) found that in a field experiment in which Yale students who were racial minorities canvassed in Newark, voters perceived the out-of-area college students in a negative light; the mobilization effort failed to produce votes. These findings illustrate that the strategy of targeting is quite important to its effectiveness. The wrong message or messenger can be ineffective or even counterproductive. Messengers who are liable to go off-message or who, in the very appearance, portray their candidate as off-median, may do their principals more harm than good.
In sum, a campaign may decide to try to increase the potency of its messaging by ceding control of its message to low-level canvassers. In doing so, it must rely on people who are willing to volunteer as political activists, whom past research suggests are distinctive in their demographic traits and political beliefs. Since voters are likely to use low-information cues in evaluating candidates, they may pass judgment on a candidate based on even artificial attributes of the messengers. Campaigns can try to keep surrogate canvassers in check by the strategic recruitment of messengers, strategic use of messengers, oversight, and message control. However, given the number of activists employed by campaigns and the nature of canvassing, attempts at oversight, control, and the deployment of incentives may have little effect on canvassers.
Hypotheses
We propose that the modern, large-scale campaign organization faces a principal-agent problem in the ground campaign. We hypothesize that the 2012 Obama campaign, in spite of its overall sophistication, was unable to employ optimal surrogate canvassers or to use surrogates in ways that limited the principal-agent problem. In contrast to mass media appeals to swing voters, we hypothesize that direct appeals to swing voters are transmitted by ideologically extreme and demographically distinct surrogates. We will show several indications of workers’ distinctiveness, including their issue positions, ideological self-placements, and demographic traits. To be clear, these surrogates are suboptimal only from the perspective that it is in the principal’s interest to match messengers to recipients on these dimensions. There is an alternative perspective, which we will address in the discussion, that a campaign solely attentive to recruiting volunteers who are energetic and loyal may not find that hyperideological or demographically unrepresentative workers are suboptimal.
Next, we test hypotheses for how the campaign might plausibly mitigate the differences between surrogates and voters. We hypothesize that the campaign may try to recruit moderate workers, recruit workers from moderate states, send moderate workers to focus on persuasion and less moderate workers to focus on mobilization, match the demographics of workers to the demographics of swing-state populations, and have extreme workers spend less time with voters and more time doing office tasks. We find no support for these hypotheses, which leads us to the conclusion that even the strategic and well-funded campaign is highly restricted in how it can pursue direct contacting because of the distinctive set of individuals who are willing to act as volunteer surrogates.
DATA
Democratic campaigns use an array of data sources to facilitate their voter engagement strategies, such as the Democratic National Committee’s database (called VoteBuilder), for-profit database vendors (such as Catalist), and state-specific databases. In nearly all cases, however, campaigns feed the data to a company called NGP-VAN, which enables campaign workers to interact with their data on a secure website. Campaign workers log in to their accounts on the NGP-VAN website to draw lists of voters to contact, record information about voters whom they already contacted, and conduct many forms of strategic engagement focused on the ground campaign. In conjunction with NGP-VAN, Obama for America, and 25 state Democratic parties, we interviewed workers as they were logged into the NGP-VAN interface in 2012. We call the resultant survey the Ground Campaign Project or GCP.
Details about the sampling strategy are reviewed in the Appendix. About three quarters of the GCP sample come from the Obama campaign, which had approximately 100,000 workers—both professional and volunteer—with unique NGP-VAN log-ins. For the Obama campaign, we solicited workers from June 11, 2012 through Election Day, November 6, 2012. We also gained access to down-ballot races, but in the present study, our attention is focused on the Obama campaign volunteers.
Surveying campaign workers as they were logged in to NGP-VAN offers a number of advantages over other kinds of elite survey designs. First, we are able to access a population that is otherwise difficult to pin down; past surveys of party elites have focused on convention delegates or other geographically concentrated groups (Stone and Abramowitz Reference Stone and Abramowitz1980), but not the campaign surrogates who spend time interacting with voters on a campaign’s behalf. Second, campaign workers are typically hesitant about providing information about their campaign to outsiders; by surveying workers through an internal website, our response rate of 35% is likely far higher than if we were to survey these workers on our own.Footnote 12 Furthermore, the survey prompt explained that the survey was being conducted by Democratic Party organizations in addition to university researchers, and respondents were assured both that identities would remain anonymous and that accurate responses were desired and valuable to the campaign. These features of the design give us some confidence in the honesty of the responses conveyed by campaign workers.
Without a survey like the GCP that is conducted internal to a political party, it would be very difficult to study campaign workers and volunteers who are the subjects of our analysis. Consider the alternative of using a representative survey of the U.S. and studying respondents who stated that they worked for a campaign. The NES, for example, has regularly asked its respondents whether they “work[ed] for one of the parties or candidates.” Since 1992, about 11% of respondents say they have done so, and an even greater percentage claimed to have done so in the 1960s through 1980s. The year with the greatest number of respondents claiming to have worked for a party is 1972, when nearly 1 in 5 respondents asserted as much. There are two obvious problems with using the NES (or any other mass survey data) to study campaign activists. For one, we suspect that misreporting biases typical of mass surveys are especially pronounced in questions about activism (Ansolabehere and Hersh Reference Ansolabehere and Hersh2012). It is simply not credible that 1 in 5 or even 1 in 10 Americans work for a campaign or party in a given election year. Moreover, survey questions like the one asked by NES are not specific enough to identify the group of workers who spent time interacting with voters on behalf of a campaign; the NES-style question incorporates other roles for which a respondent might consider themselves as a campaign worker that are not applicable to this study. In the GCP, we isolate campaign elites who regularly interacted with voters on behalf of a campaign, and were provided log-ins to campaigns’ voter database system.
To benchmark responses to the GCP survey, we also surveyed the mass public and asked questions similar to those posed to campaign workers. To do this, we placed questions on a 1,000-person module of the Cooperative Congressional Election Study (CCES) and a 1,000 person module of the the Cooperative Campaign Analysis Project (CCAP). When possible, we make use of the common content from these surveys, which each totaled approximately 50,000 respondents. When appropriate, we combine the two surveys to increase the number of subjects available, though our conclusions remain unchanged if we use only one survey or if we use only our 1,000-person modules in representation of the mass public.
Unlike with mass surveys, which can be validated by comparing sample characteristics to census characteristics, we do not have a baseline with which to assess the representativeness of the GCP survey.Footnote 13 However, we believe the GCP is well-suited for assessing our principal-agent model: the GCP is a random sample from the universe of individuals with log-ins to the campaign’s database used for voter contact, and, as we are about to show, the respondents in our sample were involved in voter contact and in the persuasion of swing voters in swing states. In short, these individuals are the kinds of agents sent forth to interact with voters on the campaign’s behalf.
There are three separate questions of representativeness that we can address. First, is the principal-agent problem faced by the Obama campaign typical of issues faced by other kinds of campaigns? We directly confront this question of generalizability in the concluding section. Second, are our respondents typical of individuals in our sampling universe? Third, is the universe of people with log-ins to NGP-VAN representative of the kinds of individuals who engaged in voter contact (including those who did not have NGP-VAN log-in privileges)? Regarding the second and third questions, in the Appendix, we extensively assess response bias and selection bias in our design.
CAMPAIGN ELITES AND VOTER CONTACT: AN INITIAL VIEW
We begin our analysis by answering three preliminary questions about the nature of our sample of campaign workers: (1) Where, geographically, were these respondents engaging voters? (2) How much of their time was dedicated to engaging with voters? (3) What kind of voter contact were they engaged in? Answers to these questions serve to justify the analysis that follows. We show that the workers we interview are indeed individuals who the campaign used as surrogates to interact with swing voters.
Our sample of Obama campaign workers includes 3,095 respondents. Of these, 2,047 (66%) considered themselves volunteers, 439 (14%) were staff (primarily with the title of Field Organizer or Deputy Field Organizer), and the remainder listed titles like Fellow or Intern that are tantamount to full-time volunteer positions.
In Figure 1, we plot the reported physical location of Obama campaign workers in our sample. The map is shaded by colors based on quartiles of the number of workers present. The Obama campaign clearly had the ability to strategically deploy workers. Every state considered a battleground state was in the top quartile for number of Obama workers.
Location of Obama Campaign Workers by State of Activity

In Figure 2 we illustrate the flow of campaign workers between states. The left side of the figure represents the permanent location of campaign workers, the right side represents the location in which they were campaigning, if different than the state in which they lived. States are arranged, top to bottom, by the share of the vote won by Obama in 2012 and are proportionally colored red to blue in the same manner. The size of the squares represents the proportion of Obama workers in that state. In the nonbattleground states, there is a significant flow of campaign workers to other states, overwhelmingly to battleground states. The flow of workers from the high-population, safely Democratic states like New York and California to the more conservative battleground states is strongly evident. On the other hand, the flow of workers from the smaller population, more conservative states at the bottom of the figure is slight. Of the workers who were in a state different than their home state, 75% worked in a more conservative state (as defined by Obama’s 2008 vote margin in the state). This represents a significant flow of liberal-state workers into states where they are likely to make contact with an electorate that is, on average, more conservative. Of course, just because the out-of-state workers tend to be from liberal states does not necessitate that they are themselves more liberal than swing-state canvassers. But the typical environment in which out-of-state workers are situated is likely to be more liberal than the mixed partisan environments of the states in which they are being sent to campaign.
Flow of Campaign Workers Between States

Next, we confirm that the workers we interviewed had a significant amount of contact with voters as part of their job and that they were engaged not just in mobilizing core supporters but in persuading undecided voters as well. The average Obama worker in our sample spent 26 hours on the campaign per week. Of these hours, the average worker spent almost 12 hours devoted to direct voter contact. We asked workers what the campaign was doing in the area in which they were working at the time of the interview. Not surprisingly, most respondents (89%) claimed the campaign was mainly focused on direct contact (as opposed to paid advertisements, or some other strategy).Footnote 14 Of those who thought the campaign in their area was mostly focused on direct contact, most of them (62%) cited their main goal as persuasion of undecided voters, rather than mobilization of existing supporters. This is consistent with the reported strategy from the campaign principals, who reflected after the election that “persuasion was a priority for the entire campaign” (2012 Obama Campaign Legacy Report 2013).
This initial set of evidence suggests that our sample of campaign workers contains the individuals who not only were logging into the campaign’s NGP-VAN account and interacting with voter data, but they (1) were campaigning in swing states where they had the potential to interact with voters crucial to election victory, (2) were often working in states that were not their home states, (3) reported having regular interactions with voters, and (4) typically thought that the main goal of their efforts in their locations was to persuade undecided voters.
ATTITUDES AND DEMOGRAPHICS OF CAMPAIGN WORKERS
In Table 1, we compare the characteristics of campaign workers to the entire electorate, to undecided voters, and to self-identified Democrats. The comparison of workers to undecided voters and Democrats is crucial because these were the two groups most likely to be targeted by Democratic campaigns: undecided voters for the purpose of persuasion and Democrats for the purpose of voter turnout.Footnote 15
Demographics of Campaign Workers compared to General Public, Undecided Voters, and Democrats

Notes: Characteristics of entire electorate (column 1), undecided voters (column 2), self-identified Democrats (column 3), and campaign workers (column 4). Cell entries are percent of group sharing that characteristic, except for income and age, which are the mean values for the group. College track includes college graduates and young persons appearing to be in college at the time of the survey.
Campaign workers differ markedly from the mass electorate and even from the voters they are trying to persuade and mobilize. The workers are more likely to be female and white, less likely to be Hispanic or black, far more likely to be in college or college educated, and are younger and have higher income. They are also much more likely to vote and to identify as strong partisans. They are more than twice as likely as mass Democrats and 17 times more likely than undecided voters to refer to themselves as “very liberal.” Similarly, campaign workers are far less likely than the mass public to refer to themselves as moderates.Footnote 16
In the Appendix, Figure A.1, we compare key demographic traits of campaign workers, undecided voters, and Democratic voters by state, for each of the 2012 battleground states.
In Figure 3, we display the distribution of ideology for the entire electorate (top), undecided voters (second from top), Democrats (third from top), and campaign workers (second from bottom). In the bottom panel, we display the mean ideology on a five-point scale from “very liberal” to “very conservative.” The distributions are strikingly uneven: not only is the distribution of campaign workers shifted sharply to the left, but self-described “moderates” are much more likely to be found in the mass publics.Footnote 17 Conservatives, who are fairly common among undecided voters and even among Democrats in the mass public, are virtually nonexistent among campaign workers.
Ideology Distributions of Campaign Workers and Mass Publics

Much of this ideological divide likely arises from the well-established finding that interest and participation in politics is positively correlated with extreme ideology (Zaller Reference Zaller1992). This implies that the ideological difference between workers and the mass public is not simply a feature of demographic differences between these populations, but is instead a predictable psychological feature of people who are willing to devote their time to politics. To explore how much of the variation in ideology can be explained by the demographics of the workers, we used Coarsened Exact Matching to match campaign workers with Democrats on the demographic variables listed in Table 1 as well as state of residence, and then checked to see if the mass public and workers were more ideologically similar when the samples were matched to be demographically similar (Ho et al. Reference Ho, Imai, King and Stuart2007). After matching, campaign workers are still 46% more likely to identify as very liberal and 68% less likely to identify as moderate compared to Democrats in the mass public (see Table A.1 in the Appendix). Because subjects were also matched on state, this difference in ideology does not arise because the mass and workers samples are drawn from differentially liberal or conservative states.
There are at least four reasons why canvassers in our survey appear so ideologically extreme. These reasons are not mutually exclusive and our data do not allow us to parse them, but they are worthwhile to consider. The first reason is that citizens who have strong pre-existing ideological commitments engage politically because they care to advance their ideological positions or they derive solidary or expressive benefits from participation. Second, ideological individuals may become activists not because of their ideological commitments, but perhaps for more social reasons such as they were asked to do so by their peers (Bedolla and Michelson Reference Bedolla and Michelson2012). Third, it is possible that less ideological or less political citizens engage in activism for social reasons, but by spending time in the campaign setting, they are primed to think of themselves as more ideological when faced with a survey prompt. Finally, it is also possible that partaking in political activism does not merely have a priming effect but a polarizing effect such that activists who were initially moderate convert to a lasting and more extreme set of political positions (see Munson (Reference Munson2008)).Footnote 18
ISSUE PREFERENCES
Given demographic and ideological differences between voters and workers, we should expect campaign workers to have more uniformly liberal policy preferences. We asked GCP respondents about the issue most important to them and the issue most important to voters with whom they interacted in the mass public.Footnote 19 In our CCES module, we asked respondents about what issue they though was most important to typical voters. We display the responses in Figure 4. The top panel of Figure 4 displays the five issues most frequently cited by campaign workers as most important. The second panel displays the five most frequently cited when workers were asked which issue was most important to the voters with whom they interacted. The third and bottom panels are the same question asked to Democrats and undecided voters in the mass public: we asked them what issue they thought was most important to other voters. If the Obama campaign workers had preferences similar to voters in the mass public, we assume their preferences would align with those of self-identifying Democrats.Footnote 20
Personal and Perceived Most Important Issue for Campaign Workers and Mass Publics

Two important findings emerge from Figure 4. First, campaign workers have very different policy priorities than the mass public. According to Democrats in the mass public, 73% think the most important issue to voters is the economy. The campaign workers know this about the voters: 75% of them also thought that the economy was the most important issue to voters. But for the workers personally, not even 40% thought the economy was the most important issue. Instead, two prominent liberal issues crowd the economy for importance among campaign workers: inequality and education. It is notable that 23% of campaign workers cited inequality as their most important issue, a celebrated issue among politically active liberals in recent years. The issue of inequality did not even muster 2% of mass public Democrats believing that other members of the mass public considered it important. This is consistent with Gallup’s open-ended most-important-problem question. In 2012, a majority of the Gallup sample pointed to the economy, jobs, or unemployment as the country’s most important problem, whereas only 1% reported that the “gap between rich and poor” was the most important problem.Footnote 21 Moreover, issues important to undecided voters, such as terrorism and war, did not appear among the top issues that campaign workers considered personally important or thought were important to voters.Footnote 22
Second, campaign workers attribute different priorities to the mass public than nonvolunteering members of the mass public attribute. While about the same percentage of campaign workers and mass public Democrats cited the economy as the most important issue to voters, the distribution of important issues in the bottom three panels otherwise varies significantly: campaign workers are more likely to cite health care as an important issue to voters and completely ignore inflation, the second most important issue to voters, according to Democratic and undecided voters. The workers again cite inequality, which is not on the radar of voters’ evaluations. In short, not only do campaign workers have different personal issue priorities than the mass public, but they also have a different sense of voters’ priorities than do Democrats or undecided voters in the mass public.Footnote 23 In Figure A.3 in the Appendix, we also show that on specific issues workers are predicted to have very different positions than voters.
HOW CAMPAIGNS KEEP WORKERS IN CHECK
So far, we have shown that typical Obama campaign workers were far different demographically and ideologically than the undecided and Democratic voters whom they were targeting in swing states. However, we posited several strategies a campaign might use to keep their agents in check. We now test for evidence of these strategies. Specifically, we ask: (1) Are volunteers who were recruited by the campaign more aligned with voter preferences than volunteers who asked the campaign if they could volunteer? (2) Are workers who spent most of their time interacting with voters different in their preferences or demographics from workers who did not spend most of their time interacting with voters? (3) Are workers who report that the strategy in their area was persuading undecideds less ideologically extreme than workers who report the strategy was mobilizing supporters? (4) Is there a positive relationship between a state’s conservatism and the workers’ conservatism, which might indicate the campaign strategically placed its more conservative workers in more conservative places?
First, we asked Obama volunteers how they came to be part of the campaign. Sixty-three percent said they contacted the campaign directly and asked to volunteer or else they were recruited by a family member or friend. In comparison, only 31% said they had been recruited by the campaign. This ratio helps to explain that a campaign does not typically hand-pick its volunteer surrogates; rather it is constrained by the hand it is dealt. That is, rather than strategically recruiting volunteers who fit a certain profile, the campaign primarily has to rely on interested supporters who offer to volunteer. However, it appears that the campaign may be able to use recruitment to somewhat offset the principal-agent problem. In Figure 5 we display the ideology of volunteers who asked to volunteer (black bars) and those who were recruited (gray bars). Consistent with our expectations about the ideology of persons most willing to volunteer their time for a cause, the volunteers who asked to join the campaign are slightly more liberal than those who were recruited, indicating that the campaign could slightly offset the ideological mismatch of volunteers through recruitment efforts. However, given that the large majority of volunteers was not recruited and the differences in ideology between the two groups are minimal (and not statistically significantFootnote 24 ), this is likely to be a minor correction to the problem, if it is any correction at all.
Ideology of Campaign Workers who Volunteered versus who were Recruited

Second, a strategic campaign may try to minimize the contact between ideologically extreme volunteers and voters, perhaps by assigning these campaign workers to duties other than voter contact. As we discuss in the Appendix, from our conversations with Obama campaign officials, we believe that there is substantial overlap between volunteers doing voter contact and volunteers not doing voter contact. Here we assess this more systematically and we find no evidence that campaigns are assigning their workers to keep ideologically extreme workers away from voters. Figure 6 displays the ideology of workers. The black bars represent workers who spent a majority of their time assigned to a duty other than voter contact; the gray bars represent workers who spent a majority of time assigned to voter contact. The bottom panel represents the mean ideology on the five-point scale. The distribution of gray bars is shifted to the left, indicating that the campaign workers most heavily involved in voter contact are actually the most liberal, though the differences are not statistically significant.Footnote 25
Ideology of Campaign Workers by Voter Contact Time

Third, a strategic campaign may try to assign very liberal campaign workers to engage very liberal voters, while asking more moderate campaign workers to try to persuade the undecided moderate voters. We approach this question by asking workers whether the goal in their area was primarily mobilizing supporters or persuading undecided voters. For example, if a campaign worker was knocking on doors in areas primarily inhabited by racial minorities, this would be an example of an area where the goal of the voter contact would primarily be mobilization because of the presumed reliable Democratic vote in the area. Were workers in areas focused on mobilization more liberal than workers in areas in which the campaign was having more contact with swing voters? We examine this possibility in Figure 7: the ideology of workers citing persuasion as the primary strategy is displayed in black, while the ideology of workers citing mobilization is displayed in gray. The workers who cited mobilization are only slightly more likely to identify as very liberal and the difference in distributions is, again, not statistically significant,Footnote 26 indicating that the Obama campaign did not overcome the inefficiencies created by the ideological mismatch between workers and voters by allocating liberal workers to mobilization and less liberal workers to persuasion. Interestingly, according to one account of Obama’s strategy (McKenna and Han Reference McKenna and Han2013), the campaign assigned paid staffers from out-of-state to dense urban areas, while relying more heavily on local volunteers in rural and suburban areas. In this setup, the workers over which the campaign would have had the most oversight (the out-of-state staffers) were being assigned to the most reliably Democratic voters.
Ideology of Campaign Workers by Voter Persuasion or Mobilization

Fourth, a well-organized Presidential campaign may be able to strategically locate workers and volunteers in order to minimize the difference between workers and the voters they contact. For example, if the campaign believed that New Hampshire was a more liberal state than Virginia, it could attempt to locate more liberal personnel in New Hampshire rather than Virginia. If a campaign can do this successfully, then it can reduce the impact of the disparity between workers and the mass public. The Electoral College also gives campaigns more power to solve this problem because the strategists only have to overcome the worker/voter divide in a handful of states. Campaigns can employ several means to accomplish this. Workers can physically relocate to a state. Also, the geographic proximity of some battleground states to large nonbattleground states means that many volunteers can temporarily cross state lines. Furthermore, Presidential campaigns have designed elaborate remote systems that allow volunteers to make calls from their own home to anywhere in the country.
In Figure 2 above, we demonstrated the significant flow of campaign workers from reliably liberal states to more conservative battleground states. Rather than recruiting volunteers from moderate or conservative states, the Obama campaign overwhelmingly relied on volunteers from the most liberal states. Almost 4 in 10 (37%) of workers who usually lived in nonbattleground states were working in a state other than that in which they usually lived. Over 1 in 4 (26%) workers in battleground states came from out of state.Footnote 27 This means that for a moderate voter living in a battleground state, the campaign worker with whom they had contact was not only younger, richer, and more liberal, but more than 1 in 4 such workers were from a different state.
Figure 8 displays the ideological distribution of campaign workers from in-state (black bars) and campaign workers from out of state (gray bars) versus mass public Democrats (white bars) and undecided voters (hashed bars) in the battleground state of Ohio. Versions of Figure 8 for the eight other battleground states are shown in the Appendix, Figure A.4. For another angle on this analysis, Figure A.1 in the Appendix, as mentioned above, shows state-by-state profiles of workers and voters on demographic traits.
Ideology of campaign workers, Democrats, and Undecided Voters, in Ohio

In Figure 8, notice how common moderates are in the mass electorate, particularly among undecided voters, of whom 67% identify as moderates. Moderates are much less prevalent among in-state workers and especially among out-of-state workers canvassing in Ohio. Despite the resources available to the Obama campaign to move workers across states, campaign workers in the crucial battleground state of Ohio were still unrepresentative of the voters they were trying to persuade and mobilize, a problem slightly exacerbated by the influx of out-of-state workers. While out-of-state workers in Ohio and other states are not significantly more liberal than in-state workers, it does not appear that the campaign leveraged the strategy of shifting workers geographically in order to reduce the ideological or demographic differences between voters and volunteer surrogates.
DISCUSSION
We have demonstrated that ground campaign surrogates deviate systematically from the median voter of the party and the electorate. We have shown that, despite the sophistication and resources of modern campaigns, we should still expect the characteristics of these workers to constrain the positioning of candidates in a way not yet appreciated by theories of electoral strategy. We have tested multiple ways that the 2012 Obama campaign might have worked to mitigate differences between its surrogates and the voting public, and we have found that the campaign did not appear to engage in these strategies of agent control. The ground campaign is characterized by a principal-agent problem in which the campaign must depend on willing surrogates, whose suitability as agents may be limited to the extent that voters respond well when campaign communications come from people like themselves.
This interpretation rests on an assumption about campaign contact that is, in theory, testable, and that represents an important avenue of further research. If campaign workers project their beliefs onto the candidate and convey messages accordingly, or if voters discern a more extreme position of the candidate because of the traits of the workers, then the use of these workers for direct contact seems strategically problematic. On the other hand, if ideologically extreme volunteers are particularly enthusiastic about their campaign, and if this enthusiasm leads them to be better communicators, then the use of these workers for direct voter contact might be less problematic. We are inclined toward the first view, because it is consistent with a growing set of experimental evidence, such as that voters who were contacted in person, but not by mail, became less likely to support Obama (Bailey, Hopkins, and Rogers Reference Bailey, Hopkins and Rogers2013), that local neighborhood canvassers have much bigger effects on voters than out-of-area canvassers (Middleton and Green Reference Middleton and Green2008; Sinclair Reference Sinclair2012; Sinclair, McConnell, and Michelson Reference Sinclair, McConnell and Michelson2013), and that canvassers demographically or socioeconomically similar to voters are particularly effective (Bedolla and Michelson Reference Bedolla and Michelson2012; Gillespie Reference Gillespie2005). It is quite possible that the interaction that an undecided voter in a swing state has with a highly ideological worker might not be advantageous from the campaign’s perspective. But how much of this disadvantage is countered by the enthusiasm of volunteers deserves further testing. To emphasize, our data do not provide insights into the actual conversations that workers have with voters. Different research is needed to measure which kinds of workers are more effective at campaigning. Our data focus on the pool of individuals willing to engage in electioneering and suggests that this pool is highly constrained in such a way that is likely to create a principal-agent problem for the campaign using these tactics.
One obvious question coming from our findings is how much did the disconnect between workers and voters hurt the Obama campaign electorally? While an exact answer to this question is outside of the scope of our analysis, our model leads us to suspect that this problem affects both sides of a campaign similarly. While we have focused entirely on Democratic campaigns because those are the data available to us, we have no reason to believe that the findings would be any different for Republicans. In fact, in 2012, if media accounts of the relative sophistication of campaigns are to be believed, the Romney campaign may have been even less successful at recruiting volunteers close to the median voter. In the Republican Party’s own postelection review, they wrote: “we need to recruit significant local volunteers, rather than shipping in outsiders to do fieldwork (Growth and Opportunity Project 2013).”Footnote 28 While the problem we have articulated likely affects campaigns of both parties, a campaign that is able to overcome this difficulty may gain an advantage. As Nickerson and Rogers (Reference Nickerson and Rogers2014) discuss, a campaign that can effectively execute mobilization efforts can have a consequential impact on electoral outcomes.
It is also important to note that the mismatch of canvassers and voters is not just a problem for the few campaigns, like those of Barack Obama, Howard Dean, or Ron Paul, that make headlines for attracting followings of activists (see Keeter, Funk, and Kennedy (October 5-7, Reference Keeter, Funk and Kennedy2005) on Dean activists). As is clear from the Republican postelection analysis, the Romney campaign thought it had a problem that it was attracting too many out-of-state activists. The issues with ground campaign volunteers that we identify are likely to be widely applicable to campaigns that heavily rely on volunteer canvassers. In fact, the inclusion of down-ballot Democratic campaigns in the GCP allows us to test this claim. In Table A.7 in the Appendix, we replicate Table 1 using workers for the Obama campaign and workers from 193 down-ballot campaigns. The down-ballot workers are demographically similar to Obama workers, demonstrating the potential for a principal-agent problem to be found in down-ballot campaigns.Footnote 29
Implications
While the mismatch between canvassers and voters is not likely to favor one side over the other, it is likely to have two important consequences for the conduct of election campaigns, and these consequences should be taken up in future research. First, as we discussed above, the mismatch means that ground campaign tactics may be inefficient and could possibly dampen election participation. If the kinds of individuals willing to serve as volunteer surrogates are not the kinds of individuals who are effective messengers of persuasion and GOTV appeals, then the ground campaign’s promise of large-scale grassroots engagement may be unmet. Future research should examine whether the traits of workers explain inefficiencies in stimulating voter engagement.
The second important consequence of the mismatch between campaign surrogates and voters is that this mismatch can contribute to polarization. The campaign season is the period of time when the largest number of voters has the greatest opportunity to learn about the positions of candidates, and thus campaigns serve an important role in informing voters about issues. When candidates take positions on issues, voters tend to match their own issue positions to their preferred candidate’s positions (Cohen Reference Cohen2003; Lenz Reference Lenz2009; Zaller Reference Zaller1992). Under a framework in which a candidate directly delivers mass appeals and takes moderate positions in order to win over the general election median voter, then voters may assume the same moderate positions articulated by the candidate. As campaigns increasingly rely on campaign workers for voter contact, these activists become a more influential source of information about candidates’ positions. When a candidate’s positions are mediated by ideologically extreme activists, the information about issue positions that voters are learning may be far more polarized than if the candidate communicated the message directly. The extent to which activist-mediated messages have a polarizing effect on voters themselves and on voters’ perceptions of candidates is another productive avenue for future research.
CONCLUSION
Prior to the focus on ground campaign tactics, two separate phenomena in American politics existed in harmony. Citizens with strong ideological sentiment and interest in politics participated in party activities, and candidates sent messages to general election voters that were moderate, vague, and targeted to the median voter. With the advent of the sophisticated ground campaign, these phenomena are now in tension. Activists have become the campaign’s agents. Under a typical model of strategy, the activists recruited for canvassing would match the demographics and ideological world-view of their targeted voters. If they could, the presidential campaigns would send armies of factory workers and suburban moms to target similarly situated swing voters. But, as we have shown, this ideal is overwhelmed by the selective group of people who are actually willing to volunteer in electioneering activities.
Our theoretical and empirical contribution paves the way for future research in several domains. In the study of campaign effects, our research implies a focus on how the characteristics of real-world canvassers affect voters’ judgment. In the study of campaign organization, our research calls for an investigation in how strategists as principals might keep the agents in check. In the study of candidate positioning, our work points to future research on how reliance on volunteer activists shapes a candidate’s strategies. Each of these lines of research should account for the new important dynamic introduced by the reliance on volunteers in the ground campaign.
APPENDIX
Additional Findings on Attitudes and Demographics of Campaign Workers
Figure A.1 displays the demographic and partisan characteristics of Democrats, undecided voters, and campaign workers by state in battleground states. Each plot displays a different demographic. Points above the 45-degree line indicate that a greater proportion of campaign workers than undecided voters or Democrats are found in that state. The demographic differences between workers and the mass public found nationwide are also present in battleground states.
Characteristics of Democrats, Undecided Voters, and Campaign Workers by State, from Discussion in Attitudes and Demographics of Campaign Workers Section

Table A.1 displays the results discussed in the Attitudes and Demographics of Campaign Workers section. Even after matching on demographic characteristics, campaign workers are more ideologically extreme than Democrats in the mass public. Of the matched sample of mass Democrats, 24% identify as very liberal and 22% identify as moderate (N = 967). Of the matched sample of campaign workers, 35% identify as very liberal and 7% identify as moderate (N = 350).
Demographics of Matched Campaign Workers and Mass Public Democratic Identifiers, from Discussion in Attitudes and Demographics of Campaign Workers Section

In Figure A.2 we follow on the discussion in the Issue Preferences section by demonstrating that, like non-college-educated Democrats, college-educated Democrats also have different issue preferences than campaign workers. This helps to demonstrate that even those who are presumably most similar to campaign workers in their knowledge of issues still have very different attitudes about which issues are most important.
Perceived Most Important Issue for College Educated Democrats, from Discussion in Issue Preferences Section

For another take on issue positions, we match the demographics and ideology of workers to members of the mass public to predict where the workers stand on specific issues. We use matching to make an educated guess about where workers stand because we have more information about issue preferences of the mass public than of the campaign workers. We use respondents in our mass sample and regress the variables in Table 1 on support for four issue positions in the pre-election survey.Footnote 30 We use a logit regression so that the model predictions produce probabilities between 0 and 1. We then use the regression coefficients to predict the probability of support for the liberal position on the four issues. Then, using the coefficients generated with the mass sample, we also predict support probabilities among the campaign workers in the GCP.
The differences in these ideological positions can be seen in Figure A.3. Here we show the predicted probabilities of liberal issues positions aggregated by state for battleground states. Campaign workers are on the vertical axis and Democrats and undecided voters are on the horizontal axis in blue and gray, respectively. Points closer to the dotted 45-degree line represent closer predicted agreement on issues between elites and voters in the mass public. If the points are above the line, it means campaign workers are predicted to have more liberal positions. The dashed lines indicate the national mean probabilities across all states for each group. Across every issue in every state, except for Nevada on support for affirmative action, campaign workers are predicted to be more liberal than the types of voters they are attempting to mobilize or persuade. In the case of undecided voters, the predicted difference between campaign workers and the mass public is particularly large.Footnote 31
Predicted Probabilities of Liberal Position for Democrats, Undecided Voters, and Campaign Workers

Additional Findings About How Campaigns Keep Workers in Check
In Figure 8 we demonstrated that in Ohio the Obama campaign was not able to solve the principal-agent problem by relocating workers across states and that they may have even made it worse. In Figure A.4 we show that a similar pattern was present in most other battleground states.
Ideology of campaign workers, Democrats, and Undecided Voters, by State

Survey Design and Response Rates
Working with the Obama campaign and NGP-VAN, it was determined that the best way to survey workers was through a part of the NGP-VAN website called the Grid View. This is the place on the website where workers look up voters and can enter information about voters. For example, if a campaign worker calls a voter and the voter says they were supporting President Obama or that they would like to volunteer, this information could be entered into the database in the Grid View. For the Obama campaign, we solicited workers with a sampling probability of 1 in 100, so for every log-in to the Grid View, a worker had a 1 in a 100 chance of being surveyed. A pop-up screen showed up on these workers’ computers. If a user clicked “Okay,” a web browser opened, and they viewed an informed consent page, followed by the five-minute survey. If the user clicked “Ask me later,” they retained a 1 in 100 probability of being solicited for the survey. The survey went into the field for Obama staffers on June 11, 2012, and staffers were surveyed through November 6, 2012.
Working with the Association of State Democratic Chairs, we gained access to down-ballot races in 25 of the 49 states that use NGP-VAN. Because the volume of use in down-ballot races is lower than in the Obama campaign (i.e., some campaigns may log-in to NGP-VAN only periodically), our sampling probability for down-ballot races was 1 in 33 rather than 1 in 100.
Between June 11th and November 6th, we solicited 15,953 distinct individuals. Of these, 5,608 (35.2%) entered the survey. While 5,608 clicked through to the survey, not all participated in every question and some seem to have clicked through to the survey and closed the window at the informed consent page. For most survey questions, our sample size is in the range 3,000–3,500 resulting in an item-level response rate of approximate 20%. Not all respondents could be identified with a single campaign. For example, workers associated with state parties and with coordinated efforts might have worked on multiple campaigns.
Table A.2 and Figure A.5 show two views at our response rate. In Table A.2, we show the rate of click-throughs to our survey by the number of solicitations. Recall that if a user clicked “Ask Me Later” at the initial survey invitation, they were still asked to take the survey in the future with the same initial sampling probability. As Table A.2 shows, over 40% of workers clicked through to the survey the first time they saw the prompt. Two-thirds of the solicitations were only solicited once. Individuals who refused the first solicitation tended to refuse subsequent solicitations, as is shown in the table. However, we did capture a number of respondents who refused multiple times before agreeing to participate.
Response Rate by Month of Interview

Response Rate by Number of Solicitations

Figure A.5 shows the response rate over time. For both Obama workers and down-ballot workers, response rates were higher earlier in the campaign season than later. The behavior in down-ballot races is clearly very different than the Obama race. In the Obama campaign, the solicitations increased over time. Therefore, while there is a modest decline in response rate, our sample grows over time because the population expands. In down-ballot races, the pool of workers is largest in September and November, and smaller in October. (Remember that the November pool only includes six days of the month.) From talking with campaign strategists, the down-ballot pattern is likely attributable to the fact that down-ballot campaigns are run in a more staggered manner than the Presidential campaign. Campaigns may draw lists of voters and volunteers in September and then work off of those lists for the remainder of the campaign. At the Presidential level, with its greater resources, there is a continuous updating of voter lists and information. This may explain the pattern shown in Figure A.5.
Finally, in Tables A.3–A.5, we show some key summary statistics from the sample. In particular we show the composition of the sample by race type (e.g., presidential, federal, state), by role on the campaign (e.g., staff, intern, volunteer), and by staff title (e.g., campaign manger, field organizer).
Respondents by Race Type

Respondents by Campaign Role

Staffer Respondents by Title

Sample Representativeness
As discussed in the Data section, we have reason to believe that our sample is representative of Obama campaign workers. The potential for an unrepresentative sample could be a result of many factors. One of these is that workers using the VAN tool for data entry have different characteristics than those contacting voters. We can test this in several ways. As we reported in the Campaign Elites and Voter Contact: An Initial View section, respondents in our sample say that almost 50% of their hours with the campaign were devoted to interacting with voters, so it seems that respondents were involved in both data entry in NGP-VAN and voter canvassing. Based on interviews with Obama paid staff members, who were responsible for assigning volunteers to voter contact or data entry in local offices, we believe that, if anything, our reliance on the NGP-VAN interface for data collection may understate the differences between campaign workers and the larger electorate. Field organizers described volunteers who did more voter canvassing as possibly younger, better educated, more politically knowledgeable, and more liberal than volunteers assigned to data entry tasks.Footnote 32 Biases in these directions would not corrupt our findings; on the contrary, they suggest that the extremeness of the workers is actually muted in our data. Moreover, we have qualitative evidence that individuals who were engaged in data entry (and were thus in our sampling universe) were similar to those who did not engage in data entry but did participate in canvassing. For example, we asked Obama’s national data director the extent to which different people were engaged in data and canvassing, and he responded, “the entire structure of the campaign was designed to discourage these divisions. As a rule, we asked everyone to do data entry and we asked everyone to make phone calls.”Footnote 33 This is consistent with reporting from the 2008 campaign that suggests that a range of volunteers pitched in with data entry.Footnote 34 Furthermore, while one might reason that more energetic or enthusiastic volunteers might be sent out to canvass while more introverted volunteers might do data entry, Rasmus Nielsen (Reference Munson2012) gives us reason to doubt even that. One staffer told Nielsen that he was in the habit of “asking the most talkative ones to help him . . .with data entry (126),” so they would not distract other volunteers, the opposite of the more conventional supposition that talkative workers would be best suited for voter contact.Footnote 35
A further question about representativeness is whether workers with log-ins to the NGP-VAN interface were selected because of their loyalty to the campaign, which might distinguish them from workers without log-ins. We do not believe this is cause for concern because different types of accounts in NGP-VAN have very different levels of access to the data. Volunteers in our sample would only be granted access for very specific tasks, like looking up voters in particular geographic areas or appending particular kinds of information to existing records.
In our conversations with high-level Obama staff, they speculated that earlier in the campaign season, more of the canvassing was done by volunteers and staff who would also be doing data entry, whereas in the last weeks of the campaign, the canvassing population grew to include more single-day volunteers who might not have done any data entry. Thus, we can be especially confident that our sample captures the canvassers accurately in the earlier stages of the campaign season, like before October. In Table A.6, we divide our sample into workers surveyed before October 1 and on or after October 1. The demographic characteristics of respondents in these two different time periods are very similar. This suggests that early in the campaign season, when most voter contact was being done by individuals who are well-represented by our sample, the sample is as distinctive from the voting public as it is later in the campaign season.
Demographics of Campaign Workers in the Early or Late Campaign

Finally, while we have argued that our method of interviewing workers through a campaign’s own voter database provides a more precise sample of workers who are acting as surrogates compared to a mass survey-based design, it is worthwhile to point out that the vast differences between campaign surrogates and the mass public that we explore are consistent with survey-based studies of activists. For example, Verba, Schlozman and Brady (Reference Stone and Abramowitz1995) show that self-reported campaign volunteers are much wealthier than nonvolunteers. They also show that political engagement, as measured by partisanship, efficacy, and interest, is a key correlate to volunteering in time-based activities. Of course, what is surprising in our study is that these participatory biases are pronounced even and perhaps especially among the subclass of activists who are serving as surrogates for a campaign, acting as intermediaries between candidates and swing voters. In sum, while it is difficult to precisely measure the representativeness of a survey like the GCP, we do not have reason to believe that the sample is unrepresentative in ways that would affect our conclusions.
Sample Representativeness for the Universe of Campaigns
Another issue of representativeness is how representative is the Obama campaign of other campaigns, including at the subpresidential level. In Table A.7, we replicate the comparison in Table A.7 using workers for the Obama campaign and down-ballot workers from 193 down-ballot campaigns in range of races from the U.S. Senate to county supervisor positions. The down-ballot workers are demographically similar to Obama workers and, if anything, are actually more dissimilar to the mass electorate than Obama workers. Down-ballot workers are more white, less black, more highly educated, and younger than Obama workers. The only characteristic on which down-ballot workers are more similar to the mass electorate is in percent female (electorate is 53.2%, down-ballot workers are 48.3%, and Obama workers are 65.1%), but they are slightly less similar to mass public Democrats in percent female (58.4%).
Demographics of Obama Campaign Workers Compared to Down-ballot Campaign Workers

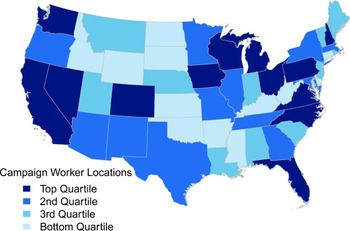
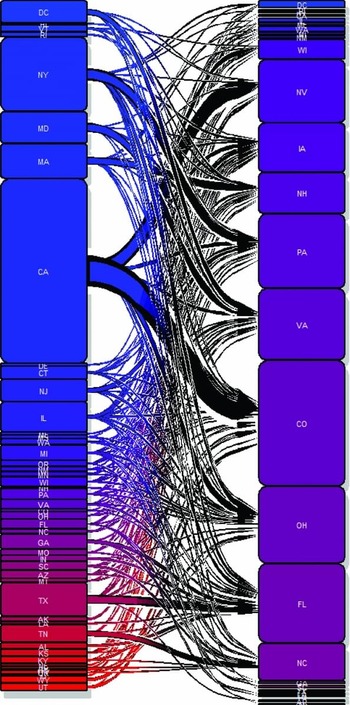
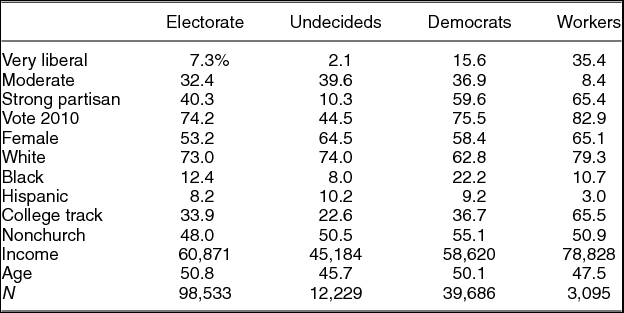
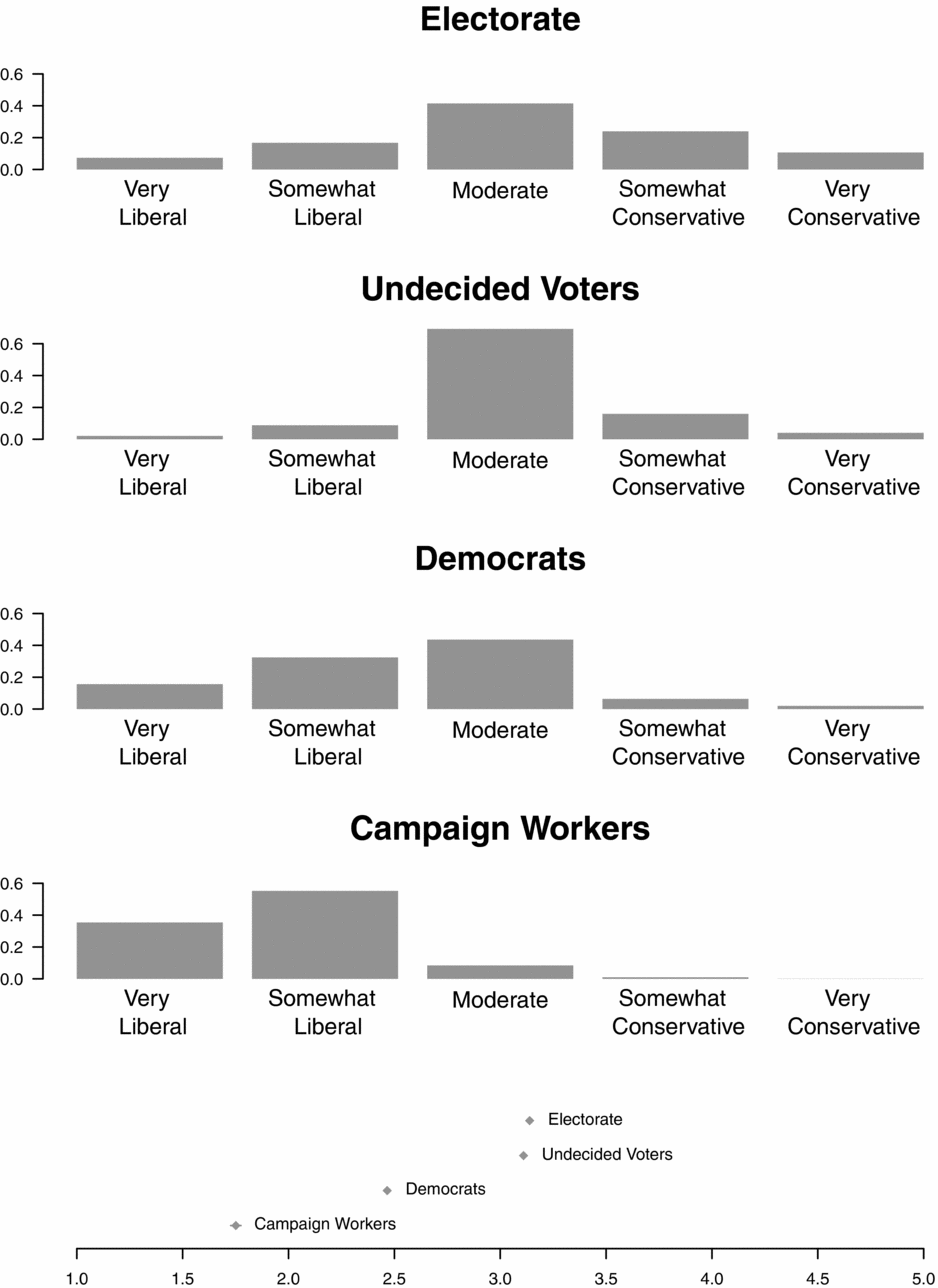
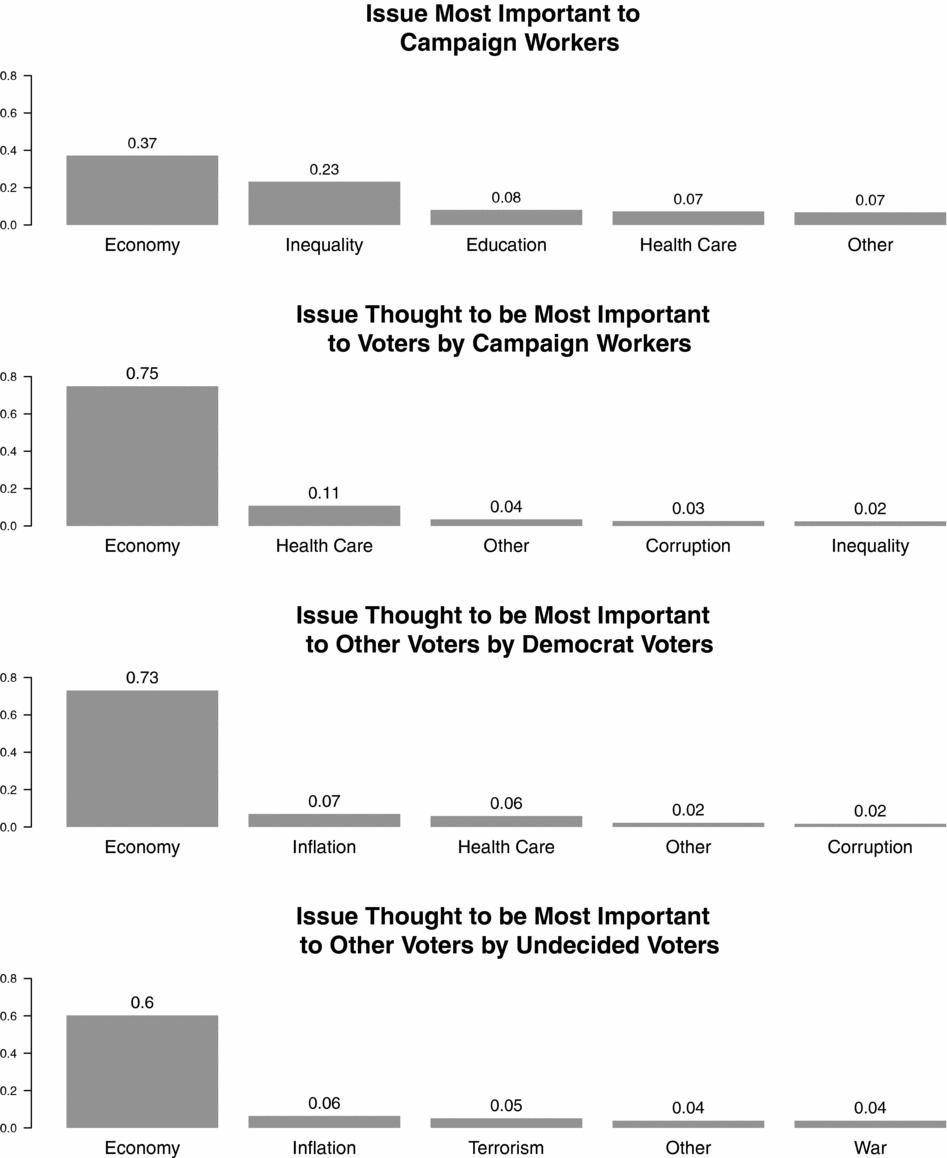
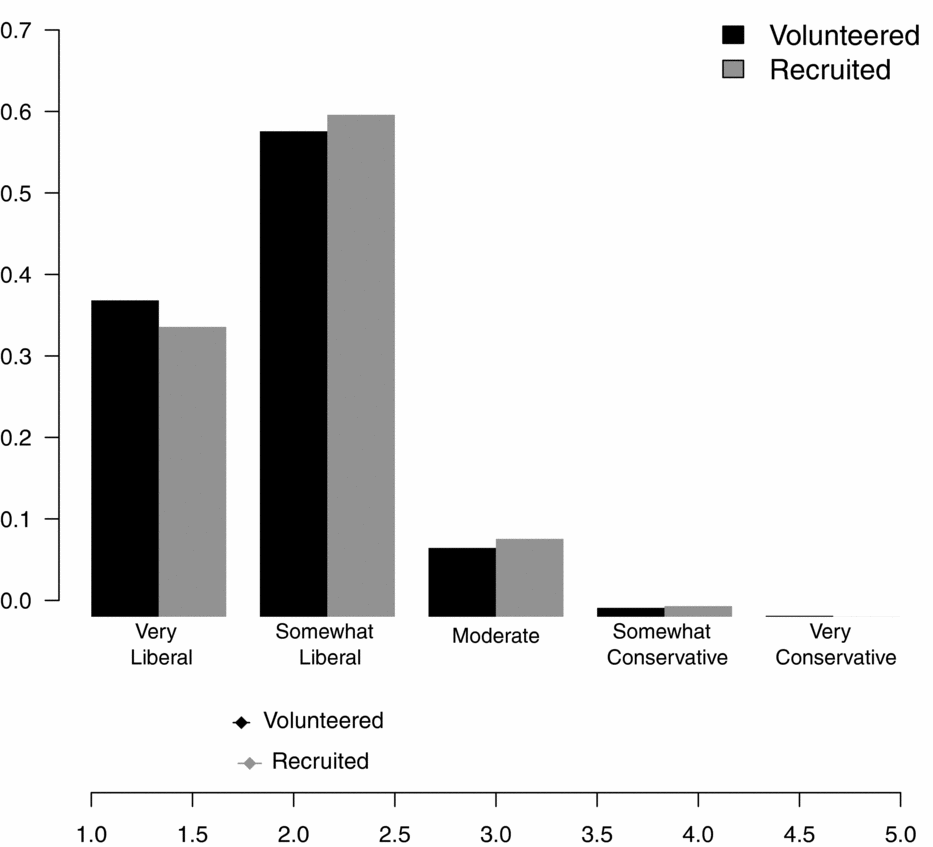

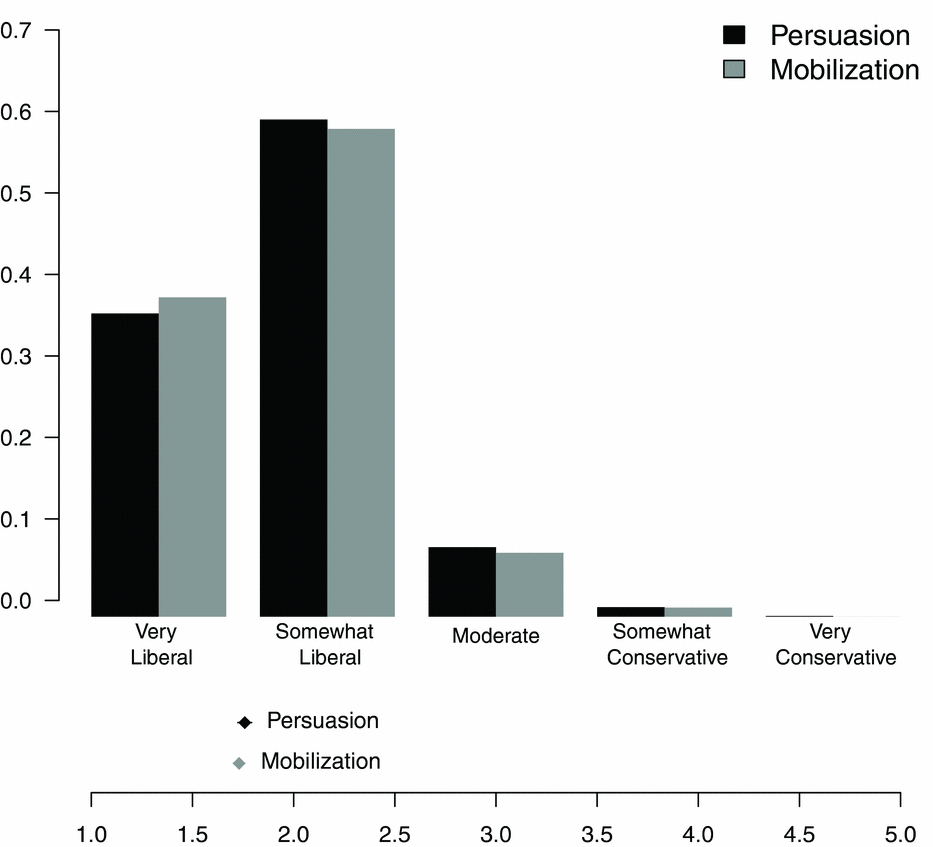
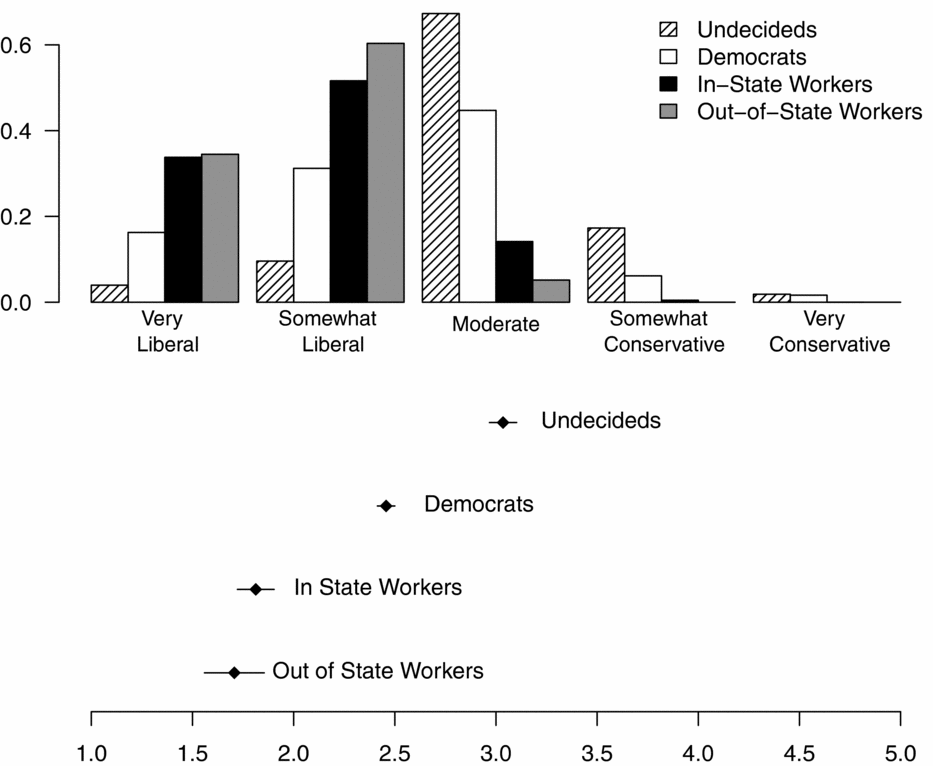
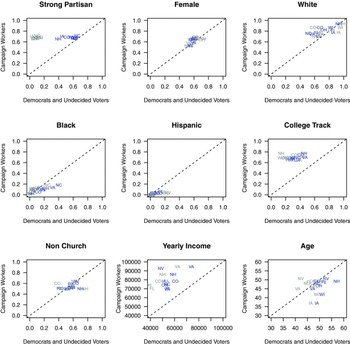
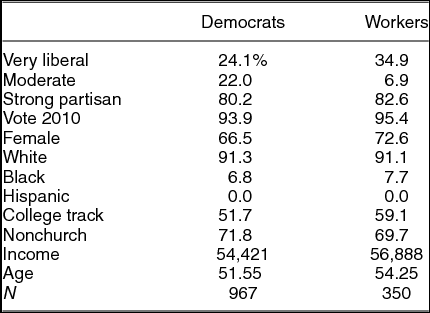
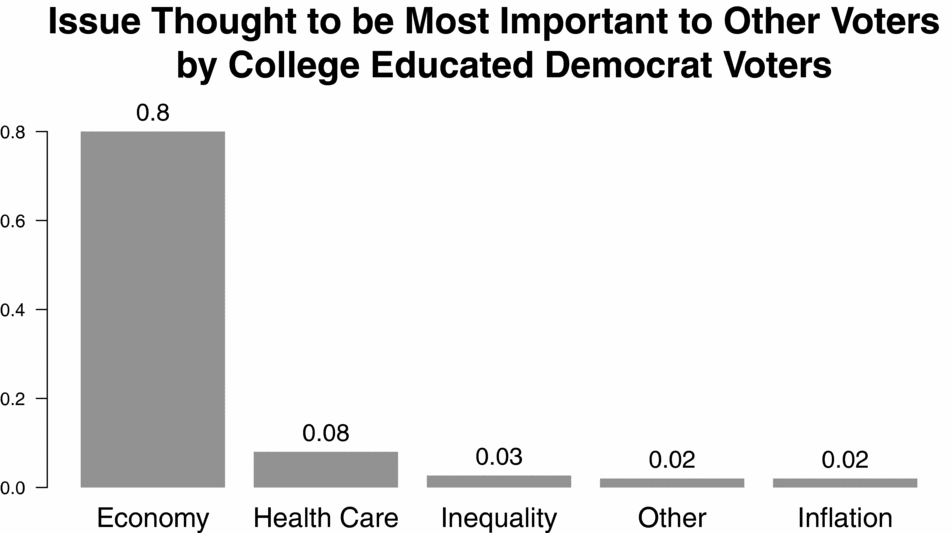
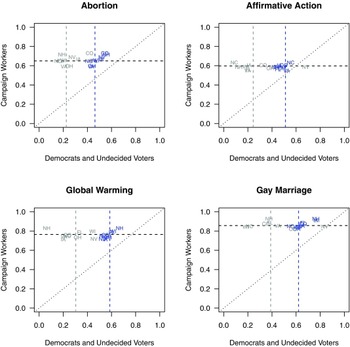
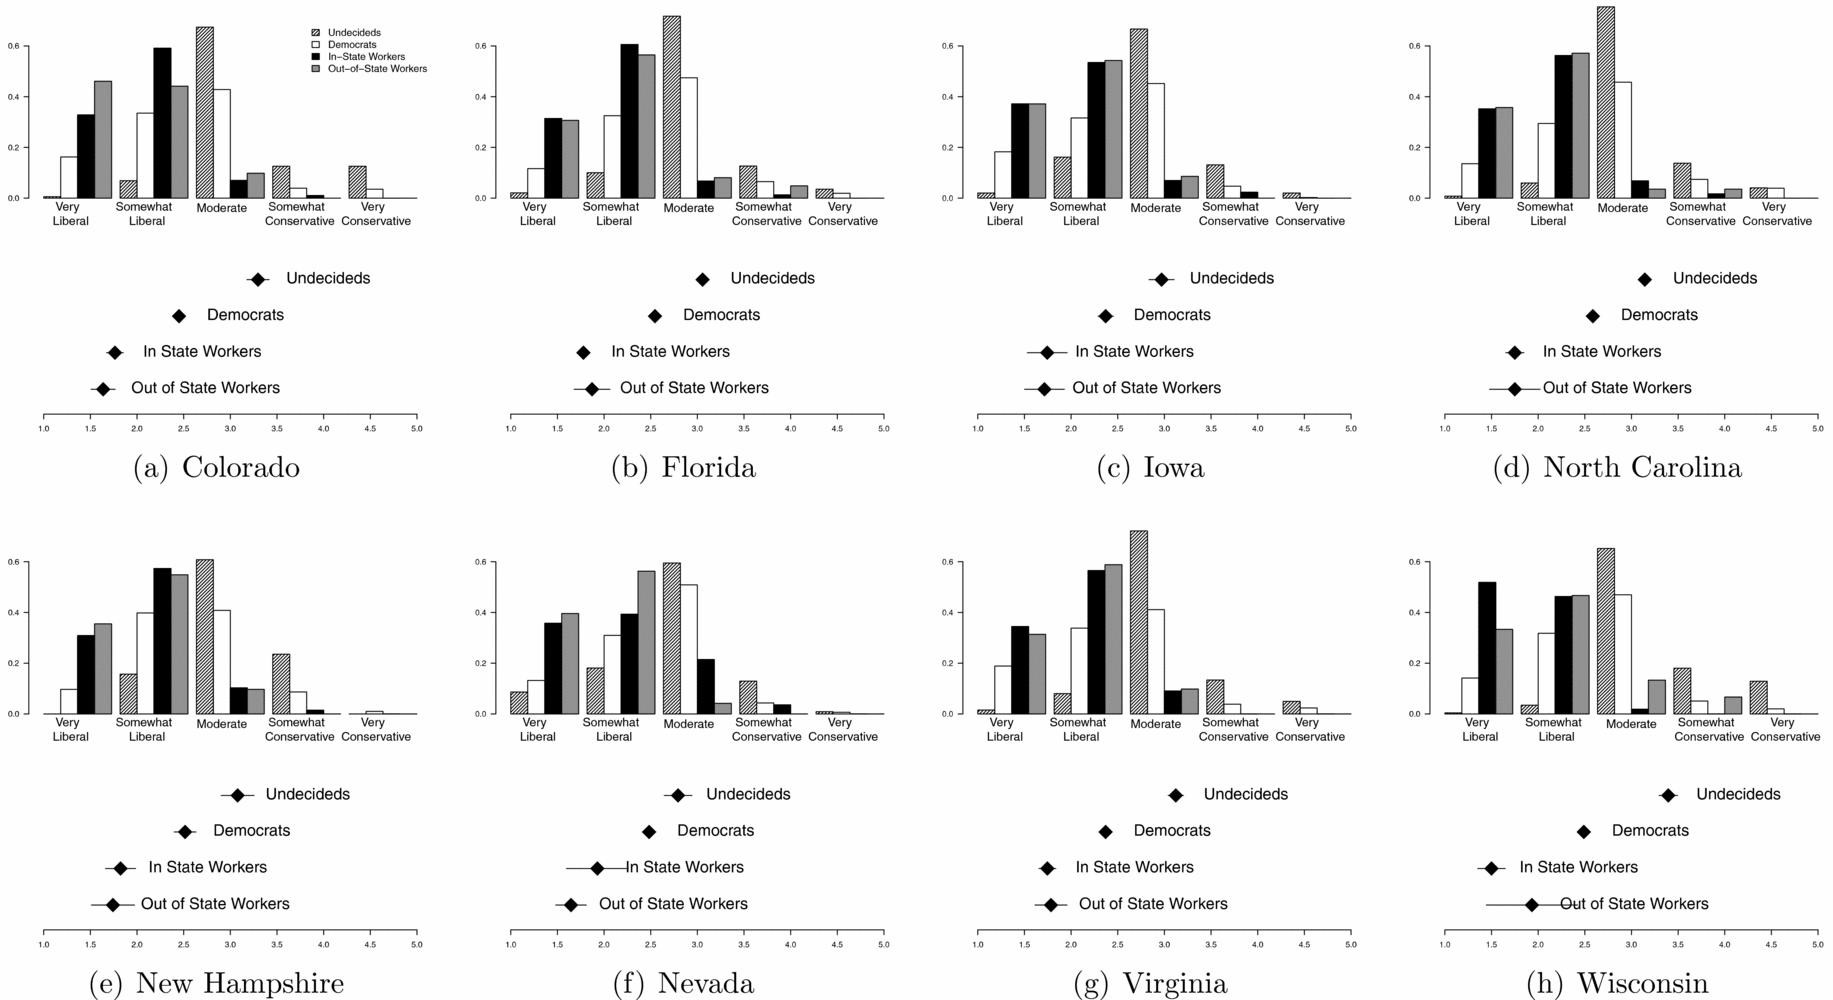
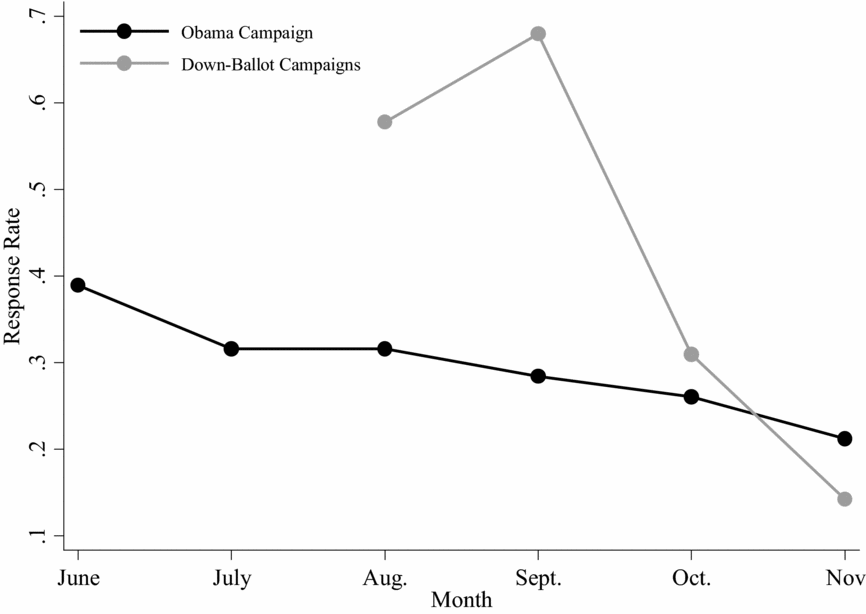
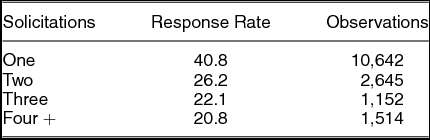
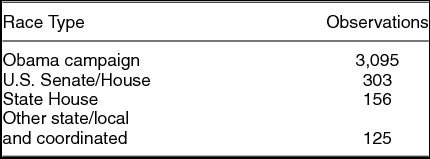
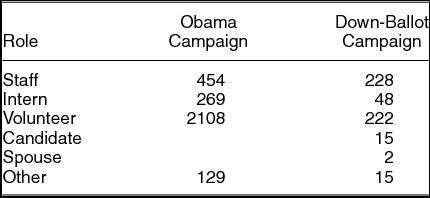
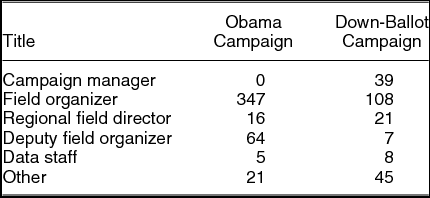
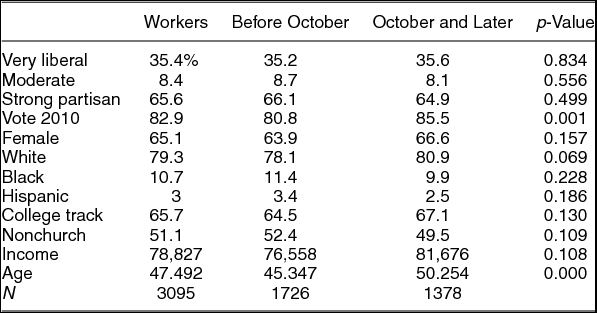
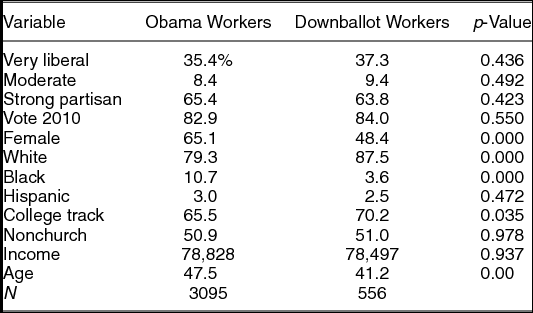



Comments
No Comments have been published for this article.