Ensuring that children receive sufficient energy and nutrients is crucial for their optimal physiological development(Reference Calcaterra, Verduci and Magenes1). However, growing evidence constantly reveals an accelerated shift towards unhealthy dietary behaviours, including meal skipping(Reference Pendergast, Livingstone and Worsley2,Reference Pot, Almoosawi and Stephen3) , frequent consumption of energy-dense snacks(Reference Marangoni, Martini and Scaglioni4), westernised food(Reference Popkin and Ng5) and increased eating away from home(Reference Ghaffar, Talib and Karim6). Such behaviours can lead to excessive weight gain and a higher risk of non-communicable diseases in later life stages(Reference Stockman, Schenkel and Brown7). Therefore, understanding children’s meal consumption patterns has garnered scientific focus.
Breakfast, lunch and dinner are universally recognised as the traditional main meals that provide essential energy and nutrients. A study by Pot et al. (Reference Pot, Almoosawi and Stephen3) has highlighted the importance of regular meal consumption, noting that irregular meal intake can disrupt the body’s circadian rhythms and increase the risk of metabolic-related disease. Among these meals, skipping breakfast has gained more attention due to its common occurrence among children and adolescents(Reference Gao, Zhao and Shu8). Local research has shown that skipping breakfast is associated with poorer diet quality and lower intakes of essential nutrients(Reference Yeo, Lee and Wong9,Reference Chong, Wu and Noor Hafizah10) . Zeballos and Todd(Reference Zeballos and Todd11) further extended these findings by examining the effects of skipping lunch and dinner on overall diet quality.
With the high incidence of meal skipping, many populations tend to consume small meals or snacks between mealtimes to supplement their nutritional needs(Reference Stockman, Schenkel and Brown7). Evidence indicates that a significant portion of total energy and nutrient intake comes from snacking behaviours. For instance, a survey found that snacks supplied approximately 19·2 % to 32·8 % of daily intake of nutrients(Reference Shriver, Marriage and Bloch12). A review demonstrated that consuming 1–2 nutrient-balanced snacks daily could mitigate the risk of digestive and metabolic overload, as well as support meeting dietary recommendations, such as increased intake of fruits, vegetables, vitamins and minerals(Reference Marangoni, Martini and Scaglioni4). However, the role of snacking on diet quality remains debated, as it relies upon the quality, quantity and frequency of the snacks consumed(Reference Llauradó, Albar and Giralt13).
Despite these emerging dietary trends, no up-to-date nationwide data on dietary patterns among Malaysian primary schoolchildren have been collected since 2013(Reference Chong, Wu and Noor Hafizah10,Reference Tee, Nurliyana and Karim Norimah14,Reference Koo, Poh and Lee15) . Additionally, while most research has investigated nutritional adequacy or diet quality, there is still a gap in understanding how energy and nutrients are distributed across meals throughout the day. As a result, this paper seeks to examine energy and nutrient distribution across meals, as well as investigate the implications of meal skipping on the nutritional status of primary school-aged children in Peninsular Malaysia. This comprehensive analysis potentially generates evidence-based insights that could guide policymakers, relevant authorities and health professionals in reassessing and refining existing policies, ultimately contributing to the development of targeted interventions that better align with contemporary dietary trends among primary schoolchildren.
Methods
Study design
Data from 1531 primary schoolchildren aged 6·0–12·9 years were collected between May 2019 and March 2020 from the Central, Southern, Northern and East Coast regions of Peninsular Malaysia using multistage cluster sampling. This dataset was part of the South East Asian Nutrition Surveys (SEANUTS) II Malaysia. The detailed study design and protocols have been described in the SEANUTS II-related publications(Reference Tan, Poh and Sekartini16,Reference Poh, Wong and Lee17) .
The SEANUTS II study was registered in the Dutch Trial Registry (Code: NL7975) and was conducted following the Guidelines of the Declaration of Helsinki. Ethical approval was granted by the Research Ethics Committee of Universiti Kebangsaan Malaysia (Code: JEP-2018-569). The approval for surveying in the school was obtained from the Malaysia Ministry of Education, state education departments and participating schools. Written consent from parents/guardians and verbal assent from children were also obtained.
Socio-economic status and meal consumption patterns
Bilingual questionnaires (Malay-English or Mandarin-English) were used to collect information. Parents/guardians provided socio-economic information, including sex, age, ethnicity, area of residence and total monthly household income. For meal consumption patterns, parents/guardians/caregivers answered for children aged 6·0–9·9 years, while children aged 10·0–12·9 years self-reported. Questions on the frequency of consuming main meals and snacks were based on habits in a typical week (e.g. ‘In a typical week, on how many days does your child have breakfast?’). Participants selected one of eight discrete options, ranging from 0 d to 7 d per week.
Breakfast is indicated as the first food or beverage (at least from one food group) consumed before 12.00(Reference O’Neil, Byrd-Bredbenner and Hayes18). Lunch was defined as the meal taken between 11.00 (if breakfast was consumed) and 16.00 and dinner after 17.00. Foods and beverages (except plain water) consumed between meals were classified as snacks, namely midnight snacks, morning snacks, afternoon snacks and supper(Reference Chong, Wu and Noor Hafizah10). Even if children consumed the snack more than once within the specific time frame, these snacks were classified as one snack type. Moreover, the frequency of main meal consumption was categorised into (1) daily consumers (meals consumed on all 7 d) and (2) non-daily consumers (skipped meals at least once a week).
Anthropometric assessments
Anthropometric measurements, including body weight, standing height and waist circumference, were taken by trained researchers at the school. To protect the children’s privacy, waist circumference was measured in an enclosed area, such as a private room or screened section of a hall. Body weight was measured using the SECA 874 digital weighing scale (seca GmBH) with a precision of 0·05 kg, and standing height was assessed with the SECA 213 stadiometer (seca GmBH) with 0·1 cm accuracy. Waist circumference was measured to the nearest 0·1 cm at the midpoint between the last palpable rib and the top of the iliac crest using Lufkin tape W606PM (Apex Tool Group). Body weight status was determined using BMI-for-age Z-scores (BAZ) according to the WHO growth reference for individuals aged 5–19 years(19), calculated using WHO AnthroPlus software version 1.0.4(20). Abdominal obesity was defined as waist-to-height ratio (WHtR) > 0·5, while non-abdominal obesity was defined as WHtR ≤ 0·5(Reference Ashwell and Hsieh21).
Dietary assessment
Habitual dietary intake of the children was collected by trained researchers using a single-day triple-pass 24-h dietary recall approach(Reference Nightingale, Walsh and Olupot-Olupot22). As dietary data were collected on a single-day basis, interviews were scheduled across all 7 d of the week to ensure adequate representation of different days. The interviews were conducted face-to-face at the school or by telephone with parents/guardians/caregivers of children aged 6·0–9·9 years, while in-person interviews were undertaken with children aged 10·0–12·9 years at the school. Missing information was clarified by reinterviewing children when proxies reported their intakes. To aid memory during the interview, children or parents/guardians were encouraged to take pictures of the foods or beverages consumed. Household measurement booklets and household utensils, including ladles, spoons, bowls and cups, were utilised to estimate portion sizes. A probing guide was designed to recall the food items that could have been inadvertently forgotten.
The NutritionistPro software (Axxya Systems) was used to perform nutrient analysis. The local database, Malaysian Food Composition Database(Reference Tee, Ismail and Mohd Nasir23), was served as the main reference. Missing nutrients or food items were imputed from sources such as the USDA(24), UK(Reference Greenfield and Southgate25), FOCOS Singapore(26) and food product nutrition labels. Notably, dietary supplement intakes were excluded from this current analysis.
To exclude implausible dietary data, the Black and Cole formula (2000)(Reference Black and Cole27) was used, employing a ratio of reported energy intake to predicted energy expenditure. A 99 % CI was incorporated, accounting for 8·2 % of within-subject variation in energy expenditure and 23 % of within-subject variation in energy intake(Reference Black28).
Statistical analysis
Complex Samples analyses were conducted to account for the representativeness of the primary schoolchildren population aged 6·0–12·9 years in Peninsular Malaysia, using IBM SPSS Statistics for Windows version 23.0 (IBM Corp.). Descriptive data were presented as mean, standard deviation (sd), standard error (se), percentages and 95 % CI, while median and interquartile range were applied in non-parametric data. Differences in nutrient contributions from various meals, including breakfast, lunch, dinner and total snacks (the sum of any snacks consumed on that day), were determined using a repeated-measures general linear model ANOVA for parametric data, while the Friedman test was applied for non-parametric data. The Complex Samples Pearson’s χ 2 test was performed to assess the relationship between children’s main meal consumption patterns and nutritional status. Two types of Complex Samples binary logistic regression models, namely (1) crude and (2) adjusting for socio-economic characteristics and energy intake, were performed to determine the OR for main meal consumption patterns by nutritional status. The significance level was set at P < 0·05 using two-sided tests.
Results
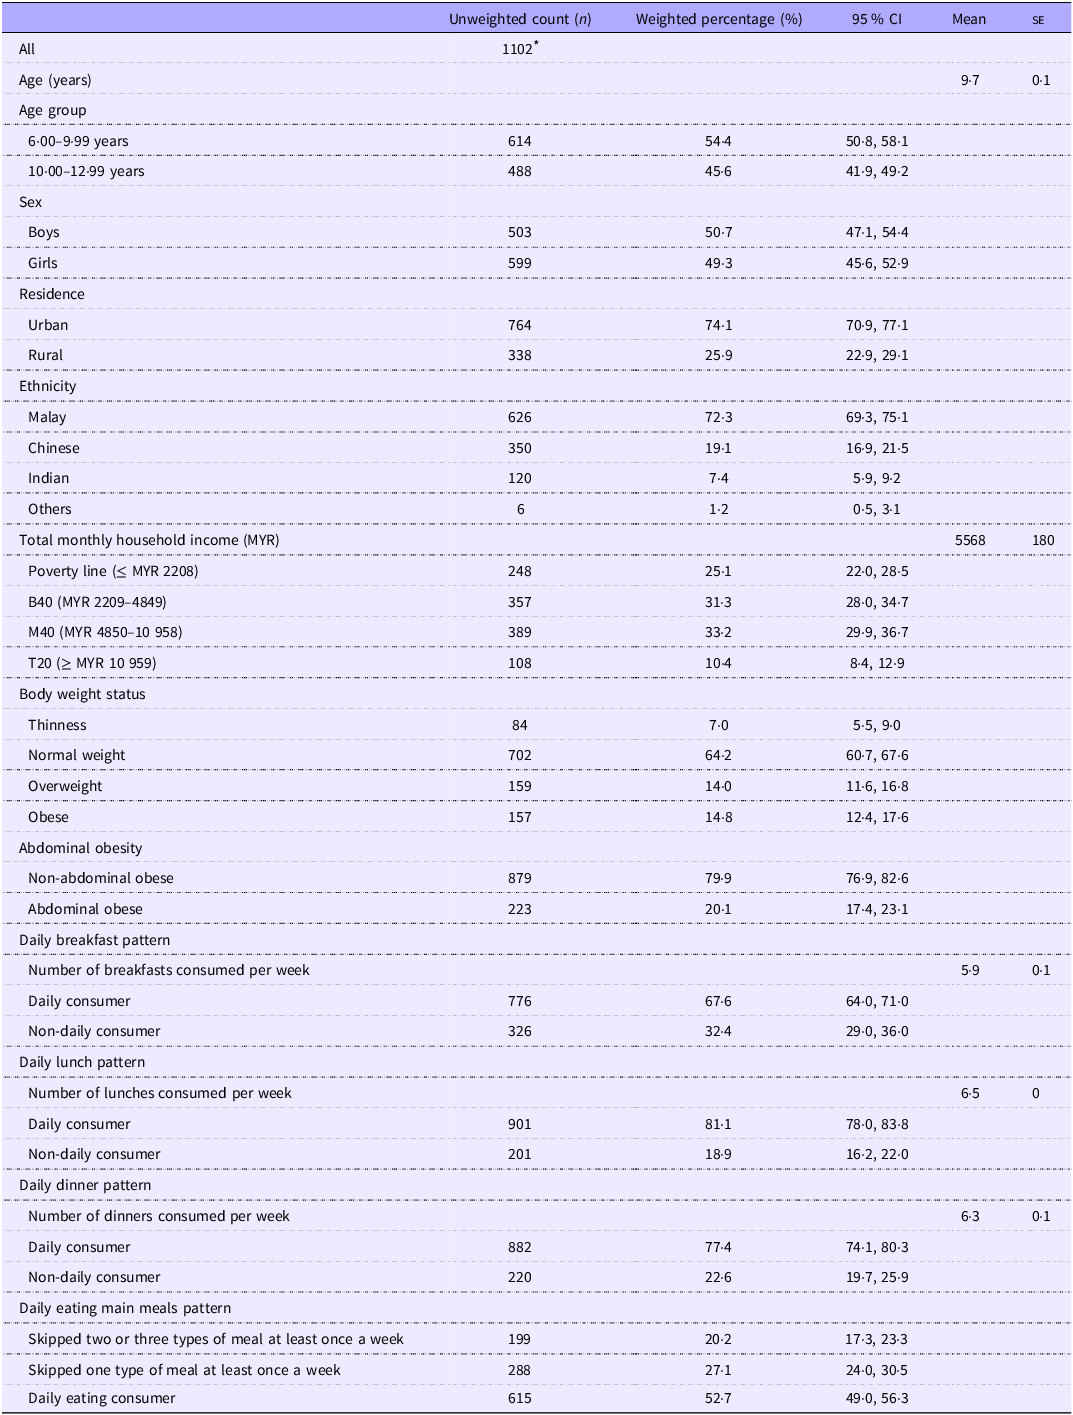
Table 1 presents the socio-economic characteristics and main meal consumption patterns of children. After excluding 429 cases due to implausible or incomplete data, the final sample included 1102 children, representing 1·73 million children. Nearly three out of ten children (28·8 %) were overweight/obese, and 20·1 % were abdominally obese. Only 52·7 % consumed all three main meals daily, while 27·1 % skipped one meal at least once weekly and 20·2 % skipped two or three meals. Moreover, breakfast skipping was the most prevalent (32·4 %), with an average consumption frequency of 5·9 times per week. More children regularly consumed lunch (81·1 %) and dinner (77·4 %).
Sociodemographic characteristics, nutritional status and main meal consumption patterns of primary school-aged children aged 6·0–12·9 years (n 1102)

Table 1 Long description
A table with 1102 rows and 10 columns detailing sociodemographic characteristics, nutritional status, and meal consumption patterns of primary school-aged children aged 6 to 12 years. Column headers include Unweighted count (n), Weighted percentage (%), 95% CI, Mean, and SE. Row labels include categories such as Age (years), Age group, Sex, Residence, Ethnicity, Total monthly household income (MYR), Body weight status, Abdominal obesity, Daily breakfast pattern, Daily lunch pattern, Daily dinner pattern, and Daily eating main meals pattern. Each row provides specific data points for these categories. Notable trends include the distribution of children across different age groups, sexes, residences, ethnicities, income levels, body weight statuses, and meal consumption patterns.
MYR, Malaysian Ringgit; 1 US Dollar, MYR 3.93 (as on 14 May 2026).
* Representing a total of 1 729 455 children aged 6·0–12·9 years in Peninsular Malaysia.
Definition of nutritional status: thinness: BAZ < −2 sd from median; overweight: 1 sd from median < BAZ ≤ 2 sd from median; obese: BAZ > 2 sd from median; abdominal obesity: WHtR > 0·5.
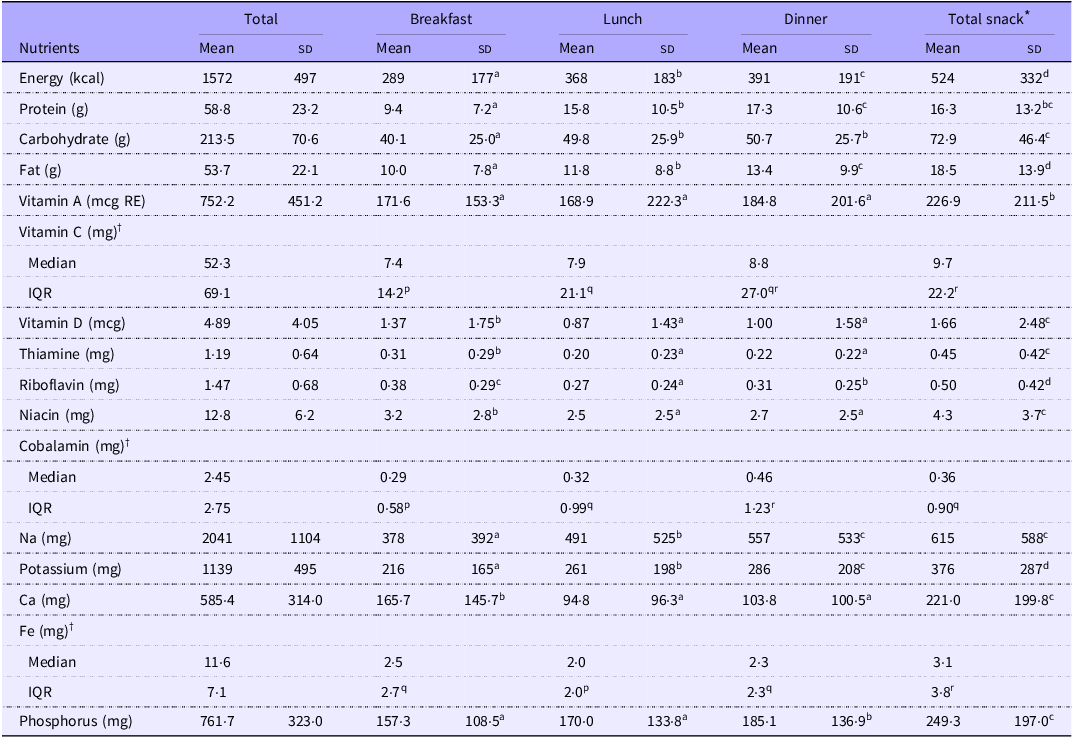
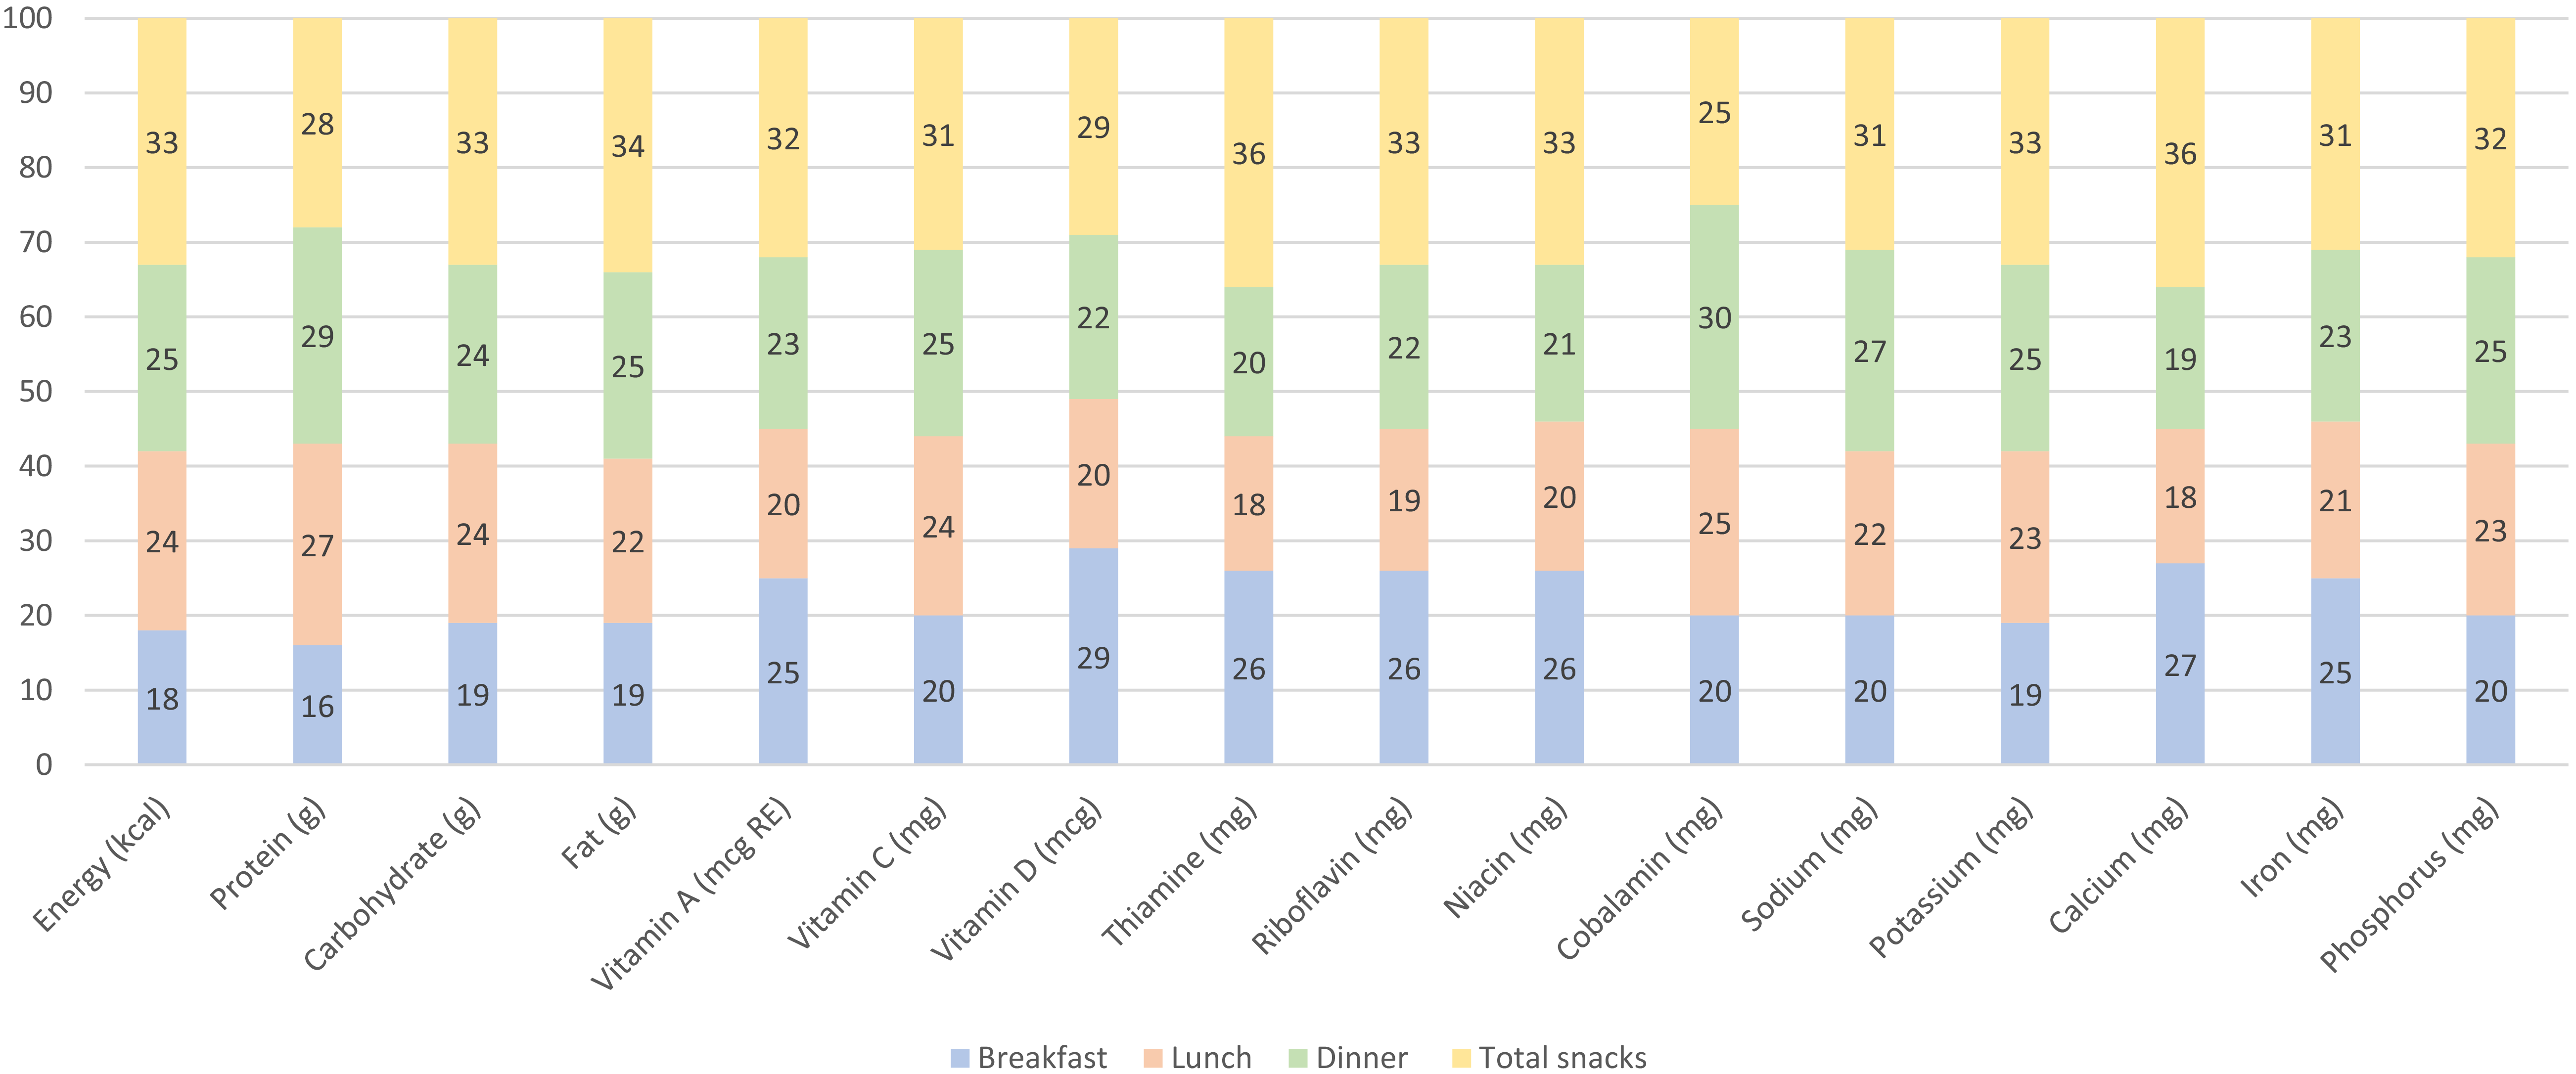
The results for energy and nutrients contributed from respective meals and total snacks are presented in Table 2 and Figure 1. Among the three main meals, breakfast provided the least energy and macronutrients, while dinner provided the most (P < 0·05). Vitamin C, cobalamin, Na, potassium and phosphorus followed this pattern, while vitamin D, thiamine, riboflavin, niacin, Ca and Fe were mostly obtained from breakfast. Snacks contributed 25 % (cobalamin) to 36 % (Ca and thiamine) of total energy and nutrients. Among all snacking occasions, morning (n 758) and evening snacks (n 822) were the most reported. Specifically, morning snacks provided an average of 327 kcal of energy, consisting of 45·0 g of carbohydrates, 11·2 g of protein and 11·3 g of fat (online Supplementary Table 1). The distribution of food groups across meals and snacks is also tabulated in online Supplementary Tables 2 and 3, respectively. However, the findings on food group distribution should be interpreted cautiously, as a proportion of children did not consume certain food groups during specific occasions, resulting in a high frequency of zero intakes that lowered the overall mean values.
Contribution of meals to the nutrient intakes of primary school-aged children, mean (sd) (n 1102)

Table 2 Long description
A table comparing nutrient intakes from different meals and snacks for primary school-aged children. The table has 18 rows and 12 columns. The columns are labeled as Total, Breakfast, Lunch, Dinner, and Total snack, each with Mean and SD sub-columns. The rows are labeled with different nutrients such as Energy (kcal), Protein (g), Carbohydrate (g), Fat (g), Vitamin A (mcg RE), Vitamin C (mg), Vitamin D (mcg), Thiamine (mg), Riboflavin (mg), Niacin (mg), Cobalamin (mg), Na (mg), Potassium (mg), Ca (mg), Fe (mg), and Phosphorus (mg). Each row provides the mean and standard deviation values for each nutrient across different meals and snacks. Notable trends include breakfast providing the least energy and macronutrients, while dinner provides the most. Snacks contribute significantly to the total nutrient intake, with morning and evening snacks being the most reported.
RE, retinol equivalent; IQR, interquartile range.
abcd Values within the similar row with different superscripts are significantly different (P < 0·05) and were determined using a general linear model repeated-measures ANOVA.
pqrs Values within the similar row with different superscripts are significantly different (P < 0·05) and were determined using the Friedman test.
* Total snack includes any snacks consumed on that day, with all snacks summed and recorded as total snacks whenever at least one snack was consumed.
† Presented in median (IQR).
Percent contribution of meals to the nutrient intake of primary school-aged children (n 1102).

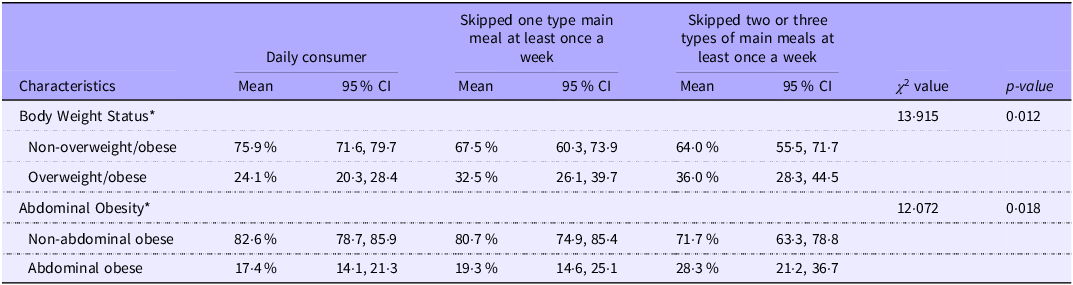
Table 3 depicts that overweight/obesity and abdominal obesity were more common among children who skipped meals (overweight/obese: P = 0·012; abdominal obese: P = 0·018). Skipping more than one type of meal at least once weekly nearly doubled the odds of being overweight/obese (1·77, 95 % CI (1·12, 2·79), P < 0·05) and abdominal obese (1·91, 95 % CI (1·17, 3·12), P < 0·01). Higher odds of being overweight/obese were also found for skipping one type of meal (1·59, 95 % CI (1·08, 2·33), P < 0·05) (Table 4).
Distribution (%) of children in nutritional status by daily main meal consumption pattern (n 1102)

Table 3 Long description
The table presents the distribution of children's nutritional status based on their daily main meal consumption patterns. It includes data for daily consumers, those who skipped one type of main meal at least once a week, and those who skipped two or three types of main meals at least once a week. The table is divided into two main categories: Body Weight Status and Abdominal Obesity. Each category is further divided into subcategories: Non-overweight/obese vs. Overweight/obese for Body Weight Status, and Non-abdominal obese vs. Abdominal obese for Abdominal Obesity. The table provides mean percentages with 95% confidence intervals for each subcategory. Additionally, it includes chi-square (χ2) values and p-values to indicate statistical significance. Row 1: Body Weight Status, Non-overweight/obese, Daily consumer, Mean 75.9 percent, 95 percent CI 71.6 to 79.7 percent, Skipped one type main meal at least once a week, Mean 67.5 percent, 95 percent CI 60.3 to 73.9 percent, Skipped two or three types of main meals at least once a week, Mean 64.0 percent, 95 percent CI 55.5 to 71.7 percent. Row 2: Body Weight Status, Overweight/obese, Daily consumer, Mean 24.1 percent, 95 percent CI 20.3 to 28.4 percent, Skipped one type main meal at least once a week, Mean 32.5 percent, 95 percent CI 26.1 to 39.7 percent, Skipped two or three types of main meals at least once a week, Mean 36.0 percent, 95 percent CI 28.3 to 44.5 percent. Row 3: Abdominal Obesity, Non-abdominal obese, Daily consumer, Mean 82.6 percent, 95 percent CI 78.7 to 85.9 percent, Skipped one type main meal at least once a week, Mean 80.7 percent, 95 percent CI 74.9 to 85.4 percent, Skipped two or three types of main meals at least once a week, Mean 71.7 percent, 95 percent CI 63.3 to 78.8 percent. Row 4: Abdominal Obesity, Abdominal obese, Daily consumer, Mean 17.4 percent, 95 percent CI 14.1 to 21.3 percent, Skipped one type main meal at least once a week, Mean 19.3 percent, 95 percent CI 14.6 to 25.1 percent, Skipped two or three types of main meals at least once a week, Mean 28.3 percent, 95 percent CI 21.2 to 36.7 percent. The chi-square values and p-values indicate significant differences in nutritional status based on meal consumption patterns.
Significant differences were determined using Complex Samples Pearson’s χ 2 tests at *P < 0·05.
OR for daily main meal consumption pattern according to nutritional status (n 1102)

Table 4 Long description
A table with four rows and three columns comparing the odds ratio (OR) and adjusted odds ratio (aOR) for different main meal consumption patterns according to body weight status and abdominal obesity. The columns are labeled Characteristics, Body Weight Status, and Abdominal obesity. The rows are labeled Skipped two or three main meals at least once a week, Skipped one main meal at least once a week, and Daily consumer. Each row provides OR values with 95% confidence intervals (CI) and aOR values with 95% CI for both body weight status and abdominal obesity. Notable trends include higher OR and aOR values for skipping meals compared to daily consumption.
WHtR, waist-to-height ratio; aOR, adjusted OR.
Significant OR using Complex Samples binary logistic regression at *P < 0·05 and **P < 0·01. Sex, age, ethnicity, area of residence (rural/urban), household income and energy intake were adjusted in the adjusted model.
† Reference category of daily main meal consumption is daily consumer.
‡ Reference category of body weight status is non-overweight/obese (overweight/obesity: BAZ > 1 sd).
§ Reference category of abdominal obesity is non-abdominal obese (abdominal obesity: WHtR > 0·5).
Discussion
In the context of the authors’ knowledge, this study presents the first evidence on the distribution of energy and nutrient intakes from main meals and snacks among children aged 6·0–12·9 years in Peninsular Malaysia. Additionally, it highlighted that meal skipping, particularly breakfast, was common among Malaysian children and was linked to an increased likelihood of experiencing overweight/obesity and abdominal obesity. By shedding light on these aspects, these findings offered invaluable insights into designing targeted interventions to promote healthier dietary practices among children.
Among the main meals, dinner served as the primary source of energy and macronutrients, while breakfast contributed the least. This pattern is in accordance with previous studies(Reference Stockman, Schenkel and Brown7,Reference Ziegler, Jonnalagadda and Lawrence29,Reference Schwedhelm, Iqbal and Schwingshackl30) , which have raised concerns about the association between higher evening energy intake and increased body fatness; however, the impact varies according to daily physical activity levels(Reference Mahdi, Dickerson and Solar31). The current study similarly found that overweight/obese children had higher calorie and fat intakes during dinner (data not shown). Furthermore, research has highlighted that consuming more energy later in the day is linked to a higher likelihood of chronic diseases, including elevated blood pressure(Reference Almoosawi, Prynne and Hardy32), type 2 diabetes and CVD(Reference Jakubowicz, Barnea and Wainstein33). A meta-analysis review supported these findings, explaining that shifting a substantial portion of energy consumption to later in the day disrupts metabolic regulation and hunger signals(Reference Young, Poobalan and Steinbeck34).
Conversely, a study found that consuming a high-calorie breakfast leads to greater fullness and reduced hunger due to higher suppression of the hunger hormone ghrelin, compared with a high-calorie dinner(Reference Jakubowicz, Barnea and Wainstein33). Additionally, diet-induced thermogenesis is 2·5 times higher after breakfast, benefiting energy and glucose metabolism and reducing fat accumulation. In contrast, a low-calorie breakfast increases cravings for sugary food and raises the likelihood of high-calorie snacking(Reference Richter, Herzog and Janka35). Therefore, endorsing a reduced late-night meal size and increasing calorie intake earlier in the day may effectively combat obesity and diet-related chronic diseases(Reference da Silva Almeida, de Souza and Pereira36). However, the effectiveness of this approach still varies depending on total daily intake and energy expenditure. This approach could potentially reduce healthcare burdens and support Goal 3 of the UN’s Sustainable Development Goals by fostering a healthier lifestyle across all age groups(37).
Notably, breakfast was also a significant source of key micronutrients, including vitamin D, thiamine, riboflavin, niacin, Ca and Fe. This suggests that children may be more likely to consume nutrient-dense foods at breakfast. Research aligns with this result, indicating that daily breakfast consumers have higher intakes of milk/dairy products and vegetables(Reference Yeo, Lee and Wong9). Furthermore, dairy products, whole grains and fortified cereals are also commonly consumed at breakfast(Reference Zeballos and Todd11), including in the Malaysian context(Reference Mohd Nasir, Nurliyana and Norimah38). This underscores breakfast’s vital role in promoting and maintaining overall well-being, especially during childhood when rapid physiological growth and cognitive development occur. Concrete efforts should be invested in emphasising the importance of breakfast consumption since breakfast skipping remains prevalent.
The current research highlighted a tendency for children to consume higher energy and macronutrients at lunch and dinner, but key micronutrients, like vitamin D and Ca, were lacking. According to the SEANUTS II study, over 90 % of primary schoolchildren did not meet the recommended intakes for these nutrients(Reference Poh, Wong and Lee17). Additionally, three-quarters of children were categorised as having poor diet quality based on the Malaysian Healthy Eating Index, with none meeting the criteria for good diet quality(Reference Yeo, Lee and Wong9). Special attention is needed, as persistently poor diet quality is linked to an increased risk of chronic diseases and impaired nutritional status(Reference Fanelli, Jonnalagadda and Pisegna39). This highlights the importance of education and shifting towards more nutrient-dense food choices in daily meals.
As observed in this study, snacking played a significant role in children’s overall diet, contributing to about one-third of their energy and nutrient intake. These findings contrast with an adolescent study, where snacking contributed the least to nutrient intake(Reference Stockman, Schenkel and Brown7). The variations observed could be attributed to differences in eating habits, cultural aspects, snack choices, quality and frequency(Reference Chong, Wu and Noor Hafizah10,Reference Shriver, Marriage and Bloch12) . Our preliminary study found that children had higher intakes of cereal/grains, poultry and vegetables during morning snacks, while afternoon snacks and supper showed higher fruit intakes, along with higher milk consumption in the supper period (online Supplementary Table 2). Other local studies indicated that higher snacking frequency was associated with increased weight(Reference Chong, Wu and Noor Hafizah10,Reference Boon and Sedek40) . However, another study suggested that more frequent eating can improve appetite control, satiety and overall diet quality(Reference Leidy and Campbell41). Therefore, better nutritional quality in snack selection needs to be emphasised and could serve as a viable dietary strategy for effective weight management.
Among all snacks, morning and afternoon snacks were the most consumed, with morning snacks providing a substantial amount of energy and macronutrients. This is likely due to the structured school day, where set meals are served as morning snacks during recess. Since schools are among the best settings for teaching and reinforcing healthy eating habits among children(Reference Ronto, Rathi and Worsley42), a thoughtful review and revision of school-based menus could ensure that the foods are nutrient-rich. A local school-based intervention that provided balanced meals during recess – consisting of grains, vegetables, fruits and protein foods – combined with nutrition education successfully improves children’s BMI status(Reference Teo, Chin and Lim43). By implementing this type of intervention, schools can reduce students’ exposure to processed foods, high-energy items and sugary drinks that are served in the canteen(Reference Foo and Tan44), leading to promising dietary and nutritional outcomes.
Meal skipping was a common habit among Malaysian children, with only half consuming all three main meals daily. Breakfast was the most frequently skipped meal, which aligns with findings from SEANUTS I(Reference Chong, Wu and Noor Hafizah10). Despite the well-documented negative impacts of meal skipping on diet quality and diet-induced morbidities, growing evidence has linked meal skipping to reduced cognitive performance(Reference Datta, Bidopia and Datta45) and impaired psychosocial well-being(Reference Morshed, Kulkarni and Saha46). Therefore, these findings highlight the importance of early interventions to address these issues at a younger age. Moreover, active parental involvement can further enhance the success of such interventions(Reference Coulthard, Palla and Pot47).
Consistent with a previous study(Reference House, Cook and Gyllenhammer48), children who skipped meals were found to have higher odds of being overweight/obese, including abdominal obesity. Skipping more than one type of meal per week was associated with an even greater risk of overweight/obesity, suggesting that the severity of poor meal consumption patterns is linked to elevated body fatness. This effect may stem from meal skipping disrupting the body’s circadian rhythm, affecting the production of satiety hormones such as leptin and ghrelin and interfering with glucose regulation, ultimately resulting in increased food consumption(Reference Leidy, Armstrong and Tang49). However, further research is warranted to explore the exact mechanism by which meal skipping impacts satiety, hunger and glucose metabolism.
This study had both strengths and limitations that should be considered. The nationwide, cross-sectional approach and the use of complex sample analysis provided a comprehensive understanding of meal consumption patterns among Peninsular Malaysian primary schoolchildren. Nevertheless, reliance on 24-h dietary recall may introduce recall bias. To mitigate this, multiple measures were implemented to maximise data accuracy, including the use of a standardised multiple-pass method and a tailored probing guide. Besides that, a single-day dietary recall may not accurately reflect an individual’s habitual intake. However, precautionary measures were implemented, including confirming habitual intake prior to the interview and rescheduling the recall if the reported intake was not representative. Additionally, to address the unreliability of proxy-reported food intake in the absence of proxies, reinterviews were conducted with the children themselves to enhance reliability. Besides, several potentially important variables, such as children’s physical activity, were not analysed in this study, which may affect the interpretation of dietary habits and nutritional status; therefore, findings should be interpreted cautiously. Lastly, this study emphasised the need for further exploration into meal consumption patterns, particularly by classifying food groups across meals that remain unknown, to gain a deeper understanding of children’s eating habits in Malaysia.
Conclusions
The study is the first to report the distribution of energy and nutrients across meals among primary school-aged children aged 6·0–12·9 years in Peninsular Malaysia. Understanding these patterns is crucial for developing age-appropriate strategies and addressing specific meal-related challenges that influence children’s overall diet quality and nutritional status. Breakfast emerged as the primary contributor to essential micronutrients, despite contributing the least to energy and macronutrients compared with lunch and dinner. Moreover, these findings underscore the importance of snacking behaviours, which account for about one-third of daily energy and nutrient intake, with morning and afternoon snacks being the most common. Additionally, this study identifies concerning meal consumption patterns, particularly meal skipping, which demonstrated a strong association with increased body fat. To address these challenges, early interventions that emphasise healthy dietary habits from a young age are essential. Active involvement from schools and families is highly recommended to create a supportive, healthy eating environment at home and in other settings. These efforts align directly with Sustainable Development Goal 3 (Good Health and Well-being), thereby supporting the country’s progress towards achieving these global objectives by 2030.
Supplementary material
For supplementary material/s referred to in this article, please visit https://doi.org/10.1017/S0007114526107314.
Acknowledgements
The authors thank all the subjects, parents and caregivers for their full cooperation, as well as teachers, and all involved in the study for their support during the conduct of this study. The researchers, data collection team, enumerators and all those involved in this project are acknowledged and appreciated for their dedication and effort.
The SEANUTS II Malaysia Study Group comprises the following. Universiti Kebangsaan Malaysia: Bee Koon Poh, Jyh Eiin Wong, Nik Shanita Safii, Nor MF Farah, Nor Aini Jamil, Razinah Sharif, Caryn Mei Hsien Chan, Swee Fong Tang, Lei Hum Wee, Siti Balkis Budin, Denise Koh, Abd. Talib Ruzita, Nur Zakiah Mohd Saat, Mohd Jamil Sameeha, A. Karim Norimah, See Meng Lim, Jasmine Siew Min Chia and Shoo Thien Lee. FrieslandCampina: Ilse Khouw, Swee Ai Ng, Nanda de Groot and Jan M.W. Geurts.
This study was conducted as part of the South East Asian Nutrition Surveys II (SEANUTS II) and was funded by FrieslandCampina (Code: NN-2018-159). FrieslandCampina was not involved in the recruitment of participants and the final set of results.
National Coordinator: B. K. P.; Conceptualisation: G. S. Y., S. T. L., J. E. W., N. S. S. and B. K. P.; Methodology: G. S. Y., S. T. L., J. E. W., N. S. S., B. K. P. and SEANUTS II Malaysia Study Group; Validation: S. T. L. and J. E. W.; Formal analysis: G. S. Y. and S. T. L.; Data Curation: G. S. Y. and S. T. L.; Writing – Original Draft: G. S. Y.; Writing – Review and Editing: G. S. Y., S. T. L., J. E. W., I. K., N. S. S. and B. K. P. Visualisation: G. S. Y. and S. T. L.; Supervision: J. E. W., N. S. S., B. K. P. and SEANUTS II Malaysia Study Group; Project Administration: J. E. W. and B. K. P. Funding Acquisition: B. K. P. All authors were involved in revising the paper and confirming the final draft to be submitted.
Ilse Khouw is an employee of FrieslandCampina. All other authors declare no conflict of interests.
This study was conducted according to the guidelines laid down in the Declaration of Helsinki, and all procedures involving human subjects/patients were approved by the Research Ethics Committee of Universiti Kebangsaan Malaysia (Code: JEP-2018-569). Written informed consent was obtained from the parents or guardians of all children. This project was registered in the Dutch Trial Registry as NL 7975.
Data generated or analysed during this study are not publicly available due to confidentiality and compliance with European General Data Privacy Regulations. Data are however available from the authors upon reasonable request and with permission from project the funder.
During the preparation of this work, the authors used ChatGPT for English proofreading. After using this tool/service, authors reviewed and edited the content as needed and take full responsibility for the content of the publication.