




Introduction
In different physiological stages of ruminants, the metabolic level of animals will change to adapt to the nutritional needs of some special periods, which will easily lead to the imbalance of the metabolic environment and nutritional level in animals (Sordillo and Raphael Reference Sordillo and Raphael2013). In the lactation period, the metabolic rate of breast tissue is high, and the production of active oxygen species is too much, so the immunity of cows decreases with the increase of milk production and milk production time, leading to long-term oxidative stress in the body, which makes it easier to induce mastitis in lactating cows (Lhrke et al. Reference Lhrke, Viergutz and Kanitz2005). Furthermore, the secretion of breast milk requires substantial glucose intake, resulting in an energy deficit where energy expenditure exceeds energy intake during this phase (Overton et al. Reference Overton, McArt and Nydam2017). This metabolic imbalance stimulates lipid mobilization and fatty acid production, which in turn exacerbates metabolic stress and inflammatory responses (Tao et al. Reference Tao, Rivas and Marins2020). Trace elements mainly exercise their biological functions in the form of enzymes and play an important role in animal growth and development, body metabolism, immune regulation, and other life processes (Lee et al. Reference Lee, Fleming and Cogan2019b). In modern livestock farming, organic and inorganic trace elements are commonly supplemented. Research indicates that inorganic trace elements hydrolyze in the rumen to form a solution, which is then bound by chelates or complexes in the digestive tract. This binding creates compounds that are difficult to digest and utilize, thereby reducing both absorption efficiency and biological effectiveness in the small intestine. Compared to inorganic forms, organic trace elements demonstrate greater stability in the rumen environment. They also minimize the impact of rumen microenvironmental factors, reduce trace element loss, and enhance absorption in the small intestinal tract (Patra and Lalhriatpuii Reference Patra and Lalhriatpuii2020; Rao et al. Reference Rao, Sunder and Reddy2001). Therefore, organic trace elements can better improve the growth, development, and antioxidant and immune performance of animals (Spears Reference Spears2003; Zhang et al. Reference Zhang, Chen and Huang2017). Some reports have confirmed that the addition of selenomethionine hydroxyl analogue to dairy diet at peak lactation can effectively improve the performance, health status, and selenium conversion rate of dairy cows (Li et al. Reference Li, Liu and Xiong2019; Lee et al. Reference Lee, Fleming and Cogan2019a).
Metabolomics is a subject that studies the pathophysiological changes of organisms, environmental changes, and the types, quantities, and changes of metabolites in the body fluids before and after gene mutation (Lau et al. Reference Lau, Lam and Curreem2015; Navarro-Reig et al. Reference Navarro-Reig, Jaumot and García-reiriz2015). Therefore, the metabolite differences between the control group and the test group are often detected by untargeted metabolomics to determine the molecular regulatory mechanism (Farrés et al. Reference Farrés, Piña and Tauler2016; Li et al. Reference Li, Wang and Lin2017). In recent years, metabolomics technology has been widely used in rumen microbiome detection, milk samples, serum detection, and disease research of dairy cows (Plumb et al. Reference Plumb, Granger and Stumpf2005). Based on LC-MS metabolomics, research found that sodium butyrate inhibited the phosphoinositol signaling pathway (Canfeng et al. Reference Canfeng, Jing and Ping2017). Fatty acid oxidation and one-carbon compound metabolism can affect the lactation performance of dairy cows (Xu et al. Reference Xu, Vervoort and Saccenti2020). Selenium produces selenoprotein under the action of cysteine, which plays an anti-inflammatory role by inhibiting the peroxidation of linoleic acid and the expression of vascular epithelial growth factor and interleukin-8 (Udilova et al. Reference Udilova, Sieghart and Eferl2012). Kenez et al. conducted a study evaluating dynamic changes in specific amino acids, biogenic amines, acylcarnitines, phosphatidylcholine, and sphingomyelin during the transition from non-lactating to lactating periods (−42, −10, 3, 21, and 100 days) (Wang et al. Reference Wang, Liu and Huang2016). However, research on overall changes in organic trace element metabolites and metabolic pathways remains relatively limited.
This experiment aims to explore the influence of composite organic trace elements on the milk composition, serum trace element concentrations, and antioxidant and immune properties of cows. The serum metabolite profile of lactating cows was analyzed based on the method of non-targeted metabolomics to identify the differential metabolites and metabolic markers and provide a reference for the application of organic trace elements.
Materials and methods
Materials
Inorganic trace elements exist in the form of CuSO4, ZnSO4, MnSO4, Ca(IO3)2, Na2SeO3, CoCl2; the oligosaccharide-organic trace element complex package was produced by chelating trace elements (copper from CuSO₄, zinc from ZnSO₄, manganese from MnSO₄) with oligosaccharides under specific conditions, and then compounding them with iodine (from Ca(IO₃)₂) and selenium (from Na₂SeO₃). The concentrations of Cu, Zn, Mn, I, and Se are identical to those in the inorganic trace element complex package, with the respective values being 14,400, 39,640, 23,160, 320, and 280 mg/kg. The chemical formula of the organic trace element is ([M(C₁₂H₂₂O₁₁)x]⁽2−2x⁾⁺, where M represents the metal ion and x denotes the number of coordinated oligosaccharide ligands). Inorganic trace elements and organic trace elements are provided by Nanning Zeweier Feed Co., Ltd.
Animals and experimental design
The experiment was conducted at the Second Farm, Baodi District, Tianjin. Thirty Holstein cows with similar body conditions (3.5 ± 0.25 points, 5-point system) and exact parity were randomly divided into 3 groups, 10 in each group. The C group was supplemented with 3% inorganic trace mineral premix in the concentrate feed; the O_50 group received 1.5% inorganic trace minerals and 1.5% organic trace mineral premix in the concentrate feed, and the O_100 group was supplemented with 3% organic trace mineral premix in the concentrate feed. The formal experiment was initiated 21 days after delivery; the formal experiment lasted for 90 days. The experimental diet was prepared according to the Dairy Cow Breeding Standard (NY/T34-2004). The diet composition and nutritional level of each group are shown in Table 1. All procedures for this study were approved by the Animal Care and Use Committee of Tianjin Agricultural College (2022LLSC35).
Composition and nutrient levels of basic feed (DM basis)

Table 1 Long description
The table lists dry matter basis ingredient percentages and nutrient levels for three feed treatments labeled C, O 50, and O 100. Ingredient composition is the same across all three, including corn silage at 49.24 percent, premix at 22.38 percent, alfalfa silage at 7.04 percent, and steamed flaked corn at 7.83 percent, with smaller amounts of protein and fiber sources such as cottonseed meal at 4.03 percent and extruded soybean at 0.9 percent. Major nutrient values are identical across treatments: net energy for lactation 7.35 megajoules per kilogram, crude protein 16.4 percent, neutral detergent fiber 30.1 grams per 100 grams dry matter, acid detergent fiber 18.5 grams per 100 grams dry matter, crude fat 5 grams per 100 grams dry matter, and starch 28.6 grams per 100 grams dry matter. Trace minerals vary only slightly: manganese about 41.09 to 41.18 milligrams per kilogram, iron about 54.98 to 55.32, copper about 10.08 to 10.32, zinc about 68.76 to 69.81, and selenium about 0.30 to 0.31. Overall, the three diets are nutritionally matched, so differences among treatments are not driven by changes in the listed ingredient proportions or major nutrient targets. One caveat is that the energy value is calculated while the other nutrient values are measured.
1 Premix can provide 23,160 mg/kg manganese (Mn), 14,400 mg/kg Cu, 39,640 mg/kg Zn, 320 mg/kg I, and 280 mg/kg Se. VA 35,000 IU, VD 10,000 IU, and VE 800 IU.
2 In the nutrition level, the net lactation energy is the calculated value, and the rest is the measured value.
Analysis of milk production and milk composition
On the 90th day of the experiment, potassium dichromate preservative was added to a 50 mL centrifuge tube using a flowmeter, and milk fat, milk protein, lactose, total solid (TS), and solid-not-fat (SNF) concentrations were measured using a milk composition analyzer (Bentley Combi-600, Bentley Instruments). The 4% fat-corrected milk (4% FCM) is calculated as follows:
 \begin{align*}{\text{4 \% FCM (kg/d) = Milk Yield (kg/d) }} \times\ {\text{0}}{\text{.4 + 15 }} \\ \times\ {\text{milk fat yield (kg/d)}}\end{align*}
Analysis of the trace element concentrations in the serum and milk
On the 90th day of the experiment, milk and blood samples were collected and centrifuged at 3500 r/min to separate the serum. The serum and milk samples were frozen in liquid nitrogen at −196°C for future use. The concentrations of trace elements, including manganese (Mn), iron (Fe), copper (Cu), zinc (Zn), cobalt (Co), and selenium (Se), were analyzed using a microwave digestion instrument (JUPITER-B, Xinyi Microwave Chemical Technology Co., Ltd, China) and inductively coupled plasma mass spectrometry (ICP-MS 7900, Agilent Technology Co., USA).
Antioxidative immunoassay in the serum
After serum thawing, glutathione peroxidase (GSH-Px), superoxide dismutase (SOD), total antioxidant capacity (T-AOC), and malondialdehyde (MDA) were measured by an automatic biochemical analyzer (CLS880, Jiangsu Lecheng Biotechnology Co., Ltd, China). The concentrations of immunoglobulin A (IgA) and immunoglobulin G (IgG) were detected using an enzyme-linked immunosorbent assay kit (Beijing Leibo Terry Technology Development Co., Ltd, China).
Serum metabolomics analysis
Serum from six cows was selected for each group according to milk yield, then thawed at 4℃. According to the sample processing requirements of the LC-MS metabolomics method, the serum samples were preprocessed prior to instrumental analysis. The quality control (QC) sample was an equal-volume mixture of all dairy cow serum samples. The serum metabolomics analysis utilized combined positive and negative ion mode results.
The raw data were converted into mzXML format by ProteoWizard software, followed by metabolite identification using a co-written R package jointly developed with the database AllwegeneDB. Individual peaks were filtered; only peaks with missing values of less than 50% in the actual samples were kept. The peak intensities of each sample feature were normalized, and multivariate statistical analyses, including principal component analysis (PCA) and orthogonal partial least squares-discriminant analysis (OPLS-DA), were performed. The OPLS-DA model was validated based on the explained variance of Y (R 2Y) and model predictive ability (Q 2). The model was deemed stable and reliable when 1 ≥R 2Y and Q 2 ≥ 0.4 were satisfied. Then, differential metabolites were screened with the criteria of variable importance in the projection (VIP) ≥1, P < 0.05, and fold change <0.67 or >1.5 as criteria for differential metabolite screening. After screening for differential metabolites, hierarchical cluster analysis (HCA), KEGG annotation, and pathway analysis of differential metabolites were performed. The above work was carried out in Beijing Orvison Technology Co., Ltd.
Data analysis
Data on dairy composition, trace element concentration in milk, serum trace element concentrations, and antioxidant immunity were processed and analyzed by PROC MIXED in SAS 9.4 statistical software. The model included treatment as a fixed effect and animal as a random effect. Orthogonal polynomial contrasts were used to evaluate linear and quadratic effects of organic trace mineral supplementation, and Tukey’s test was used for multiple comparisons. P < 0.05 indicates significant differences, and P < 0.01 is extremely significant. The model used was as follows:
 \begin{equation*}{\text{Yij =} \mu + }{{\beta }_{\text{1}}}{\cdot }{{\text{Linear}}_{\text{i}}}{\text{ + }}{{\beta }_{\text{2}}}{\cdot}{{\text{Quadratic}}_{\text{i}}}{\text{ + }}{{\varepsilon }_{{\text{ij}}}}\end{equation*}
Results
Effect of organic trace elements on milk composition
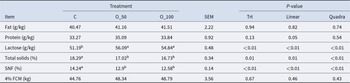
According to Table 2, the lactose concentrations in the O_50 and O_100 groups were significantly higher than those of the C group (P < 0.01), and the TS and SNF concentrations in milk were significantly lower than those of the C group (P < 0.01). The milk protein concentrations showed a linear relationship with the supplementation level of organic trace minerals, with the O_50 group demonstrating the highest protein concentration (P < 0.05). Lactose concentrations in milk showed an increased quadratic effect (P < 0.01); TS and SNF concentrations showed linear and secondary curve reduction. The addition of organic trace elements had no significant effect on milk fat concentration or 4% FCM (P > 0.05).
Effects of organic trace elements on milk composition

Table 2 Long description
The table compares milk composition across three groups: control, O 50, and O 100, reporting standard error and p-values for overall treatment, linear dose, and quadratic dose effects. Lactose is higher in both O 50 and O 100 than in control (about 56.09 and 54.84 versus 51.19), and these differences are statistically significant for treatment and both dose trends. Total solids are lower with O 50 and O 100 than control (about 17.02 and 16.73 versus 18.29), with significant treatment and dose effects. Solids not fat follows the same pattern, dropping from about 14.24 in control to about 12.9 and 12.58 in O 50 and O 100, with significant treatment and dose effects. Fat shows little change across groups (about 40.47 to 41.51) and is not statistically significant. Protein is similar overall, with a borderline linear dose effect indicated, while the overall treatment effect is not significant. Four percent fat-corrected milk yield is numerically higher in O 50 and O 100 than control (about 48.34 and 48.79 versus 44.76) but not statistically significant. Letter groupings indicate which means differ within a row, and results should be interpreted alongside the reported standard errors and p-values.
Note: Within a row, values with different lowercase superscript letters differ significantly (P < 0.05), whereas values with different uppercase superscript letters differ highly significantly (P < 0.01). Values sharing the same letter are not significantly different (P > 0.05).
Effect of organic trace elements on trace element concentration in dairy cows’ milk
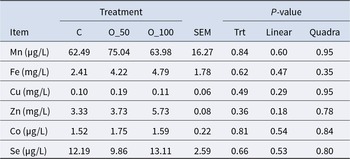
According to Table 3, the concentrations of Mn, Fe, Cu, Zn, Co, and Se in the O_50 and O_100 trace element replacement groups showed no significant differences (P > 0.05) but exhibited a clear upward trend compared to the control group.
Effect of organic trace elements on trace element concentrations in dairy milk from cows

Table 3 Long description
The table reports dairy milk concentrations of manganese, iron, copper, zinc, cobalt, and selenium under three treatments labeled C, O 50, and O 100, along with SEM and p values for overall treatment and for linear and quadratic patterns. Manganese was 62.49, 75.04, and 63.98 micrograms per liter for C, O 50, and O 100, with a treatment p value of 0.84. Iron was 2.41, 4.22, and 4.79 milligrams per liter, with a treatment p value of 0.62. Copper was 0.10, 0.19, and 0.11 milligrams per liter, with a treatment p value of 0.49. Zinc was 3.33, 3.73, and 5.73 milligrams per liter, with a treatment p value of 0.36. Cobalt was 1.52, 1.75, and 1.59 micrograms per liter, with a treatment p value of 0.81, and selenium was 12.19, 9.86, and 13.11 micrograms per liter, with a treatment p value of 0.66. Across all elements, linear and quadratic p values are also above 0.05, indicating no statistically significant differences or dose response patterns among treatments; SEM values provide the variability for each measure.
Effect of organic trace elements on serum trace element concentrations
According to Table 4, the serum Fe ion concentrations of the O_100 group were significantly higher than the O_50 group (P < 0.05), and the Se ion concentrations of the O_50 and O_100 groups were significantly higher than those of the C group (P < 0.05). With the increase of organic trace element additives, the concentrations of Se ions in the serum of dairy cows increased linearly (P < 0.05).
Effects of organic trace elements on the serum trace element concentrations in dairy cows

Table 4 Long description
The table reports serum concentrations of manganese, iron, copper, zinc, cobalt, and selenium in dairy cows under three treatments: control, O50, and O100, with standard error and P-values for overall treatment and linear and quadratic patterns. Selenium increased from 88.22 micrograms per liter in control to 103.87 in O50 and 107.44 in O100, with a significant treatment effect and significant linear and quadratic trends. Iron differed by treatment, rising from 6.22 milligrams per liter in control and 5.78 in O50 to 8.04 in O100, with a borderline overall treatment P-value and a near-significant quadratic pattern. Manganese showed similar values across groups (about 31 to 34 micrograms per liter) with no significant effects. Copper, zinc, and cobalt were also similar across treatments, with small differences and non-significant P-values. Letter groupings indicate which treatment means differ within a row, so only iron and selenium show clear separation among treatments. Results should be interpreted alongside the reported standard errors and the fact that most elements did not show statistically meaningful changes.
Different lowercase superscript letters within a row indicate significant differences (P < 0.05).
Effect of organic trace elements on the antioxidant immune properties of serum
According to Table 5, with the addition of organic trace elements, the MDA concentration in dairy cows decreased linearly (P < 0.05), the IgA concentrations in serum increased linearly (P < 0.05), and the SOD activity and IgG concentrations in serum increased (P < 0.05). The O_100 group had significantly higher SOD activity (P < 0.05); the O_50 group's MDA concentration was significantly lower (P < 0.05). The O_50 and O_100 groups had significantly higher IgA serum (P < 0.01). The O_100 group had significantly higher IgG serum than the C group (P < 0.05).
Effects of organic trace elements on the antioxidant immune properties of serum from dairy cows

Table 5 Long description
The table reports serum antioxidant and immune indicators in dairy cows under three treatments: control, O 50, and O 100, with SEM and P values for overall treatment, linear, and quadratic effects. Glutathione peroxidase was lowest at O 50 and highest at O 100, with a significant treatment effect. Superoxide dismutase increased from control to O 100, with significant treatment and quadratic effects. Total antioxidant capacity changed little across treatments and was not significant. Malondialdehyde, a lipid oxidation marker, was lowest at O 50 and showed significant treatment and linear effects. Immune markers increased with organic trace elements: IgA rose from control to both O 50 and O 100 with strong significance, and IgG was highest at O 100 with significant treatment and quadratic effects. Letter groupings next to means indicate which treatments differ statistically, so small numeric differences may not be meaningful unless the letters and P values support them.
Different lowercase and uppercase superscript letters indicate significant differences at P < 0.05 and P < 0.01, respectively.
Effect of organic trace elements on serum metabolites in dairy cows
Analysis of serum samples
The study compared the total ion chromatography (TIC) map of three QC samples in positive and negative ion modes and found that the good TIC overlap of QC samples indicates that the method is more reproducible. The TIC diagram of QC samples in positive or negative ion mode is shown in Supplementary Appendix Fig. 1; from the PCA score diagram of Supplementary Appendix Fig. 2, the QC samples are very good, indicating that the method is stable.
Correlation analysis of serum samples
Biological tests generally require repeated controls, designed to demonstrate the reproducibility of the experiments and to assess the reliability of the results. The closer the correlation coefficient is to 1, the higher the similarity between the samples. Most studies show that R 2 greater than 0.8 indicates similar expression patterns between samples, otherwise requiring a reasonable explanation of the sample or a new experiment. Supplementary Appendix Fig. 3 shows that the expression patterns are highly similar between the samples.
PCA of serum metabolites
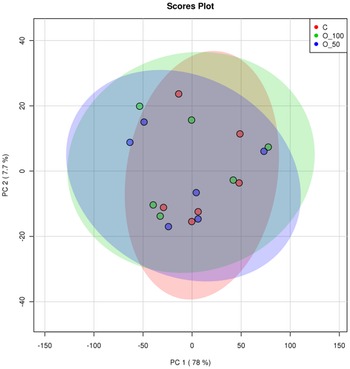
Figure 1 shows the results in the score map of the C group, the O_50 group, and the O_100 group in the positive–negative ion merger mode. Figure 1 shows that the three groups are slightly separated, and the separation trend is not significant.
Scatter plot of PCA scores.

Discriminant analysis of OPLS-DA
OPLS-DA can reflect the differences between taxonomic groups and select the differential metabolites from the dataset, and the size of model parameter values (R 2 and Q 2) indicates whether the current OPLS-DA model is reliable. According to Supplementary Appendix Table 1 and Supplementary Appendix Fig. 4 (C, D) OPLS-DA model validation diagram, the model evaluation parameters are R 2Y = 0.99, Q 2 = 0.395, R 2Y = 0.997, Q 2 = 0.559. The OPLS-DA model for this experiment was reliable and stable due to R 2Y ≤ 1 and Q 2 ≥ 0.4. The OPLS-DA model in the O_50 and O_100 groups was shown in Fig. 2(A) and (B). The results show that the O_50, O_100, and C groups are significantly separated from the OPLS-DA model score map, and all the samples are in the 95% confidence interval.
(A) O_50 vs C group OPLS-DA score plot. (B) O_100 vs C group OPLS-DA score plot.

Figure 2 Long description
The image contains two scatter plots labeled A and B. Both plots are titled ‘Scores Plot.’ In plot A, the x-axis represents the T score with an explained variance of 12.3 percent and the y-axis represents the Orthogonal T score with an explained variance of 11.5 percent. The plot shows two groups: O_50 and C, indicated by red and green colors, respectively. The data points form distinct clusters with minimal overlap, primarily separated along the x-axis. Ellipses around the clusters indicate the spread of each group. In plot B, the x-axis represents the T score with an explained variance of 12.2 percent and the y-axis represents the Orthogonal T score with an explained variance of 11.3 percent. The groups O_100 and C are shown, also using red and green colors. Similar to plot A, the groups are clearly separated along the x-axis with distinct clustering and minimal overlap. Ellipses indicate the spread of each group. Both plots demonstrate a clear separation between the groups, with no notable outliers.
Differential metabolite analysis and Venn analysis
The inorganic trace element group served as C, with O_50 and O_100 as the experiment groups; P < 0.05 and VIP ≥1 were used as the screening criteria to screen the differential metabolites in the serum of each group of dairy cows. As shown in Supplementary Appendix Fig. 5 and Fig. 3(A), 70 differential metabolites were screened in O_50 vs C, of which 42 metabolites were upregulated and 28 metabolites were downregulated, and there were 52 metabolites unique to the O_50 vs C group. Supplementary Appendix Fig. 5 and Fig. 3(B) show 76 metabolites from O_100 vs C, among which 47 metabolites were upregulated and 29 metabolites were downregulated. Bubble plots of differential metabolites (Fig. 4) show the HMDB classification of differential metabolites. The O_50 group mainly includes lipids and lipid-like molecules, organic acids and derivatives, organic nitrogen compounds, organic oxygen compounds, and organoheterocyclic compounds. The O_100 group mainly includes benzenoids, lignin and related compounds, lipids and lipid-like molecules, organic acids and derivatives, organic nitrogen compounds, organic oxygen compounds, organoheterocyclic compounds, phenylpropanoids, and polyketides. The bar chart of differential metabolites (Fig. 5) lists the O_50 group and O_100 group unique metabolites. Figure 5(A) shows that the O_50 group’s unique metabolites were mainly 3-fluoro-5-hydroxypyridine, LPC(18:1), stachydrine, thromboxane B2, rutamarin, lincomycin, 3-piperidin- 4-ylpropanoic acid, 1-(7H-purin-6-yl)-N-(3-(trifluoromethyl)phenyl), 4-(methylamino)butanoic acid, moxifloxacin, and arachidonic acid (AA). The downregulated metabolites were mainly tiapride, 2-hydroxycyclohexyl 2-O-((2E)-3-(4-hydroxyphe…, SM (d18:1/20:0), 2-furoylglycine, N-nervonoyl-D-erythro-sphingosylphosphorylcho…. Figure 5(B) shows O_100 group unique metabolites mainly 3-fluoro-5-hydroxypyridine, nitracaine, cardoltriene, 1-(7H-purin-6-yl)-N-(3-(trifluoromethyl)phenyl), stachydrine, rutamarin, (S)-dibutyl 3-hydroxybutyl phosphate, [2-(carbamoyloxymethyl)-2-methylpentyl]-N-pro, 3-piperidin-4-ylpropanoic acid, 9-hydroxycalabaxanthone, N5-(1-lminobutyl)-L-ornithine, LPC(18:1), 3-(3,4-dimethoxyphenyl)-7-hydroxy-4-phenylcou, and vidofludimus. The metabolites with downregulated expression levels were dicyclohexylamine, N-nervonoyl-D-erythro-sphingosylphosphorylcholine, piperazine-2-carbonitrile, and methionine sulfone.
(A) Volcano plot of serum differential metabolites in the O_50 vs C group. (B) Volcano plot of serum differential metabolites in the O_100 vs C group. Significantly differentially upregulated metabolites are shown in red, and significantly differentially downregulated metabolites are shown in green.

Figure 3 Long description
The image consists of two scatter plots comparing serum differential metabolites. The first plot, labeled O 50 vs C, has the horizontal axis representing log base 2 fold change from negative 4 to positive 4 and the vertical axis representing negative log base 10 p-value from 0 to 6. The plot shows a distribution of points with a notable cluster of upregulated metabolites on the right and downregulated metabolites on the left. The legend indicates that red points represent significantly upregulated metabolites, green points represent significantly downregulated metabolites and gray points are not significant. There are 70 differential metabolites, with 42 upregulated and 28 downregulated. The second plot, labeled O 100 vs C, follows the same axis labels and ranges. It shows a similar distribution pattern with a cluster of upregulated metabolites on the right and downregulated metabolites on the left. The legend remains consistent with the first plot. There are 76 differential metabolites, with 47 upregulated and 29 downregulated. Both plots highlight areas of dense points, indicating significant changes in metabolite levels between the groups.
(A) Diagram of differential metabolite bubbles in the O_50 vs C group. (B) Diagram of differential metabolite bubbles in the O_100 vs C group.

Figure 4 Long description
The image A showing a bubble scatter plot. The vertical axis label is super class. The categories listed from top to bottom are Others, Organoheterocyclic compounds, Organic oxygen compounds, Organic nitrogen compounds, Organic acids and derivatives, Lipids and lipid like molecules, Benzenoids. The horizontal axis label is LOG FOLDCHANGE. The horizontal axis shows tick labels at negative 5, 0 and 5. A legend titled super class lists: Benzenoids; Lipids and lipid like molecules; Organic acids and derivatives; Organic nitrogen compounds; Organic oxygen compounds; Organoheterocyclic compounds; Others. A size legend titled VIP shows circles labeled 0.1, 0.2, 0.3 and 0.4. Plotted points appear across multiple super class rows, with points on both sides of 0 and near 0. The image B showing a bubble scatter plot. The vertical axis label is super class. The categories listed from top to bottom are Phenylpropanoids and polyketides, Others, Organoheterocyclic compounds, Organic oxygen compounds, Organic nitrogen compounds, Organic acids and derivatives, Lipids and lipid like molecules, Lipids and lipid like molecules and related compounds, Benzenoids. The horizontal axis label is LOG FOLDCHANGE. The horizontal axis shows tick labels at negative 5, 0 and 5. A legend titled super class lists: Benzenoids; Lipids and lipid like molecules; Lipids and lipid like molecules and related compounds; Organic acids and derivatives; Organic nitrogen compounds; Organic oxygen compounds; Organoheterocyclic compounds; Others; Phenylpropanoids and polyketides. A size legend titled VIP shows circles labeled 0.05, 0.10, 0.15, 0.20 and 0.25. Plotted points appear across multiple super class rows, with points on both sides of 0 and near 0.
(A) Bar graph of O_50 vs C group differential metabolites. (B) Bar graph of differential metabolites in the O_100 vs C group. Red represents upregulated expression and green represents downregulated expression.

Figure 5 Long description
The image A showing a horizontal bar graph titled LOG underscore FOLDCHANGE left parenthesis O underscore 50 dot C right parenthesis. The horizontal axis label is LOG underscore FOLDCHANGE, with tick labels minus 1, 0, 1, 2, 3, 4. The vertical axis label is name. The legend title is type, with entries up and down. The y axis category labels from top to bottom are: 3 dash Fluoro dash 5 dash hydroxypyridine; L P C left parenthesis 18 colon 1 right parenthesis; Stachydrine; Thromboxane B2; rutamarin; Lincomycin; 3 dash Piperidin dash 4 dash ylpropanoic acid; 1 dash left parenthesis 7 H dash Purin dash 6 dash yl right parenthesis dash N dash left parenthesis 3 dash left parenthesis trifluoromethyl right parenthesis phenyl dash; L P C left parenthesis 18 colon 0 right parenthesis; 4 dash left parenthesis Methylamino right parenthesis butanoic acid; Moxifloxacin; 1 dash O dash Hexadecyl dash 2 dash O dash acetyl dash sn dash glyceryl dash 3 dash phosphoch..; 1 dash oleoyl dash 2 dash myristoyl dash sn dash glyceryl dash 3 dash phosphochol..; Arachidonic acid left parenthesis A A right parenthesis; TIAPRIDE; 2 dash Hydroxycyclohexyl 2 dash O dash left parenthesis left parenthesis 2 E right parenthesis dash 3 dash left parenthesis 4 dash hydroxyphen..; Propionylcarnitine left parenthesis Can colon 3 colon 0 right parenthesis; S M left parenthesis d18 colon 1 slash 20 colon 0 right parenthesis; 2 dash Furoylglycine; N dash Nervonoyl dash D dash erythro dash sphingosylphosphorylcho.. Bars extend to the right for the up entries and to the left for the down entries. The up bars reach approximately: 3 dash Fluoro dash 5 dash hydroxypyridine about 4; L P C left parenthesis 18 colon 1 right parenthesis about 3; Stachydrine about 3; Thromboxane B2 about 3; rutamarin about 3; Lincomycin about 3; 3 dash Piperidin dash 4 dash ylpropanoic acid about 3; 1 dash left parenthesis 7 H dash Purin dash 6 dash yl right parenthesis dash N dash left parenthesis 3 dash left parenthesis trifluoromethyl right parenthesis phenyl dash about 3; L P C left parenthesis 18 colon 0 right parenthesis about 2; 4 dash left parenthesis Methylamino right parenthesis butanoic acid about 2; Moxifloxacin about 2; 1 dash O dash Hexadecyl dash 2 dash O dash acetyl dash sn dash glyceryl dash 3 dash phosphoch.. about 2; 1 dash oleoyl dash 2 dash myristoyl dash sn dash glyceryl dash 3 dash phosphochol.. about 2; Arachidonic acid left parenthesis A A right parenthesis about 2. The down bars reach approximately: TIAPRIDE about minus 1; 2 dash Hydroxycyclohexyl 2 dash O dash left parenthesis left parenthesis 2 E right parenthesis dash 3 dash left parenthesis 4 dash hydroxyphen.. about minus 1; Propionylcarnitine left parenthesis Can colon 3 colon 0 right parenthesis about minus 1; S M left parenthesis d18 colon 1 slash 20 colon 0 right parenthesis about minus 1; 2 dash Furoylglycine about minus 1; N dash Nervonoyl dash D dash erythro dash sphingosylphosphorylcho.. about minus 1. The image B showing a horizontal bar graph titled LOG underscore FOLDCHANGE left parenthesis O underscore 100 dot C right parenthesis. The horizontal axis label is LOG underscore FOLDCHANGE, with tick labels minus 2, 0, 2, 4. The vertical axis label is name. The legend title is type, with entries up and down. The y axis category labels from top to bottom are: 3 dash Fluoro dash 5 dash hydroxypyridine; Nitracaine; Cardoltriene; Acebutolol; 1 dash left parenthesis 7 H dash Purin dash 6 dash yl right parenthesis dash N dash left parenthesis 3 dash left parenthesis trifluoromethyl right parenthesis phenyl dash; Stachydrine; rutamarin; left parenthesis S right parenthesis dash Dibutyl 3 dash hydroxybutyl phosphate; left bracket 2 dash left parenthesis carbamoyloxymethyl right parenthesis dash 2 dash methylpentyl right bracket dash N dash pro..; 3 dash Piperidin dash 4 dash ylpropanoic acid; 9 dash Hydroxycalabaxanthone; N5 left parenthesis 1 dash Iminobutyl right parenthesis dash L dash ornithine; L P C left parenthesis 18 colon 1 right parenthesis; 2 dash Methoxy dash beta dash naphthoflavone; 3 dash left parenthesis 3 comma 4 dash Dimethoxyphenyl right parenthesis dash 7 dash hydroxy dash 4 dash phenylcou..; Vidofludimus; Dicyclohexylamine; N dash Nervonoyl dash D dash erythro dash sphingosylphosphorylcho..; Piperazine dash 2 dash carbonitrile; Methionine sulfone. Bars extend to the right for the up entries and to the left for the down entries. The up bars reach approximately: 3 dash Fluoro dash 5 dash hydroxypyridine about 5; Nitracaine about 5; Cardoltriene about 4; Acebutolol about 4; 1 dash left parenthesis 7 H dash Purin dash 6 dash yl right parenthesis dash N dash left parenthesis 3 dash left parenthesis trifluoromethyl right parenthesis phenyl dash about 3; Stachydrine about 3; rutamarin about 3; left parenthesis S right parenthesis dash Dibutyl 3 dash hydroxybutyl phosphate about 3; left bracket 2 dash left parenthesis carbamoyloxymethyl right parenthesis dash 2 dash methylpentyl right bracket dash N dash pro.. about 2; 3 dash Piperidin dash 4 dash ylpropanoic acid about 2; 9 dash Hydroxycalabaxanthone about 2; N5 left parenthesis 1 dash Iminobutyl right parenthesis dash L dash ornithine about 2; L P C left parenthesis 18 colon 1 right parenthesis about 2; 2 dash Methoxy dash beta dash naphthoflavone about 2; 3 dash left parenthesis 3 comma 4 dash Dimethoxyphenyl right parenthesis dash 7 dash hydroxy dash 4 dash phenylcou.. about 2; Vidofludimus about 2. The down bars reach approximately: Dicyclohexylamine about minus 1; N dash Nervonoyl dash D dash erythro dash sphingosylphosphorylcho.. about minus 1; Piperazine dash 2 dash carbonitrile about minus 1; Methionine sulfone about minus 1.
HCA of differential metabolites
Through the HCA of the differential metabolites obtained by volcano plot and Venn graph analysis, the metabolites with the same characteristics will automatically be categorized into one category, which can verify whether there were differences within the experimental sample group. According to Fig. 6, the differential metabolites of O_50 and O_100 were significantly differentiated from the C, indicating that there was no significant difference within the experimental sample group.
(A) Hierarchical clustering analysis of differential metabolites in sera of O_50 vs C group. (B) Hierarchical cluster analysis of differential metabolites in serum of O_100 vs C group.

Figure 6 Long description
Cluster analysis of differential metabolites A heatmap with a hierarchical clustering dendrogram on the left side of the grid. Column labels along the bottom, in order: C0 1, C0 2, C0 3, C0 4, C0 5, C0 6, O50 1, O50 2, O50 3, O50 4, O50 5, O50 6. A legend at the right shows a vertical gradient bar with tick labels 2, 1, 0, minus 1, minus 2. A small legend near the top right reads group name and lists C0 and O50. The heatmap cells form multiple clustered blocks aligned with the left dendrogram branches. Many rows show one side of the columns (C0 1 through C0 6) with stronger intensity while the other side (O50 1 through O50 6) shows weaker intensity and other row clusters show the opposite pattern. No numeric values are printed inside the heatmap cells. Row labels are not readable in the image.
Metabolic pathway analysis of differential serum metabolites in dairy cows
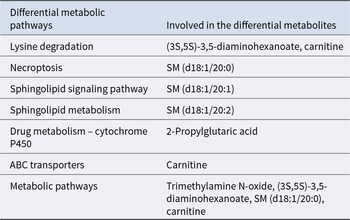
Figure 7 shows the pathway information of the differential metabolite enrichment obtained by different groups. From Fig. 7(A) and (C), it can be seen that the pathways enriched by the marker metabolites of the O_50 vs C group are mainly necroptosis, leishmaniasis, GnRH signaling pathway, Fc gamma R-mediated phagocytosis, serotonergic synapse, and inflammatory mediator regulation of TRP channels. From Fig. 7(B) and (D), it was known that the pathways enriched in the O_100 vs C group were necroptosis, sphingolipid signaling pathway, lysine degradation, sphingolipid metabolism, drug metabolism – cytochrome P450, ABC transporters, and other channels. According to the differential metabolite pathway list, the differential metabolites involved in the above major metabolic pathways are serotonin, AA, SM (d18:1/20:0), LPC (18:1), carnitine, 2-propylglutaric acid, and trimethylamine N-oxide. The differential metabolic pathway assignment table is shown in Tables 6 and 7.
(A) Metabolic pathways enriched for metabolic markers enriched in O_50 vs C. (B) Metabolic pathways enriched for O_100 vs C. (C) Bar chart of KEGG enrichment in O_50 vs C. (D) Bar graph of KEGG enrichment in the O_100 vs C group.

Figure 7 Long description
Cluster analysis of differential metabolites. The heat map includes a row dendrogram on the left and a grid of cells. Column labels are C1 to C6 and O 100 1 to O 100 6. A color gradient from blue to red represents z-score variations, with blue indicating lower values and red indicating higher values. The heat map shows clustering patterns, with similar values grouped together. A vertical scale bar on the right shows z-score values from minus 2 to 2. The annotation strip labeled group name differentiates categories C and O 100. No numerical values are present inside the cells.
The O_50 vs C group of differential metabolic pathways assigned

Table 6 Long description
The table maps each differential metabolic pathway to the specific differential metabolites associated with it in the O 50 versus C comparison. Arachidonic acid is the dominant metabolite, appearing across many pathways including GnRH signaling, platelet activation, vascular smooth muscle contraction, retrograde endocannabinoid signaling, and aldosterone synthesis and secretion. Serotonin is linked to serotonergic synapse, inflammatory mediator regulation of TRP channels, gap junction, and synaptic vesicle cycle. Thromboxane B2 appears only with serotonergic synapse and arachidonic acid metabolism, alongside arachidonic acid. SM(d18:1/20:0) is associated with necroptosis and the sphingolipid signaling pathway. LPC(18:0/0:0) is listed only for choline metabolism in cancer. The table indicates which metabolites are connected to each pathway but does not provide effect sizes, direction of change, or statistical significance.
Differential metabolic pathways and associated metabolites in the O_100 vs C group

Table 7 Long description
The table maps differential metabolic pathways to the specific differential metabolites associated with each pathway in the comparison. Lysine degradation is linked to (3S,5S) 3,5-diaminohexanoate and carnitine. Several lipid-related pathways each map to a single sphingomyelin species: necroptosis to SM(d18:1/20:0), sphingolipid signaling to SM(d18:1/20:1), and sphingolipid metabolism to SM(d18:1/20:2). Drug metabolism via cytochrome P450 is associated with 2-propylglutaric acid. ABC transporters are linked to carnitine, and the broad category “metabolic pathways” includes trimethylamine N-oxide along with (3S,5S) 3,5-diaminohexanoate, SM(d18:1/20:0), and carnitine. Overall, carnitine and sphingomyelin species recur across multiple pathways, suggesting they may be central to the observed differences, but the table does not indicate direction or magnitude of change.
Discussion
The lack of trace elements in dairy cows will cause a decline in production performance, lead to a decline in lactation volume, and even lead to a decline in milk quality. Milk protein, milk fat, and somatic cells can reflect the quality of milk. Rathor et al. (Reference Rathor, Jain and Keshri2023) found that the addition of compound antioxidant micronutrients to the perinatal dairy cow diet had no significant effect on the milk fat concentration or 4% FCM. The addition of organic trace elements in this experiment had no significant effect on the milk fat concentration or 4% FCM; however, the concentration of milk fat and 4% FCM increased significantly, which may be because the trace elements increased the synthesis of milk fat in mammary epithelial cells, thus increasing the milk fat rate. Banadaky et al. (Reference Banadaky, Rajaei-sharifabadi and Hafizi2021) found that addition of compound amino acid chelating salt to the diet increased milk protein rate in lactating dairy cows. Wu et al. (Reference Wu, Peng and Liu2021) study showed that trace element supplementation increased the milk and lactose concentrations of milk in early lactating cows; milk protein concentrations increased linearly, while lactose concentrations increased in a quadratic effect. Lu et al. (Reference Lu, Chang and Liao2016) results indicate that organic trace elements may improve the milk protein rate and lactose rate in milk by participating in the metabolism of sugar, fat, and protein in the body. Rathor et al.’s (Reference Rathor, Jain and Keshri2023) study showed that the addition of antioxidant micronutrients to the perinatal dairy cow diet had no significant effect on the concentrations of TS and SNF in milk. However, the TS and SNF concentrations of milk were significantly lower than those of the control group. The experimental results are consistent with previous studies. Lactose is the primary substance determining the osmotic pressure of milk, and increased lactose levels promote water influx into mammary alveoli to maintain osmotic balance, thereby exerting a dilution effect on solid components such as milk fat and milk protein (Nichols et al. Reference Nichols, Bannink and Pacheco2018). In this experiment, the trace element group exhibited elevated lactose concentrations. Consequently, organic trace elements may influence the increase in lactose levels in dairy cows, leading to reduced TS and SNF concentrations in milk.
Organic trace elements are more effectively utilized by mammary glands, thereby increasing the concentration of trace elements in milk (Spears Reference Spears2003). Gong and Xiao (Reference Gong and Xiao2018) demonstrated that elevating dietary yeast selenium levels significantly enhanced milk selenium content. O’Rourke’s (Reference O’rourke2009) study revealed that organic trace element supplementation in feed reduced the incidence of mammary gland inflammation compared to control groups while improving milk trace element levels. This experiment found that although the concentrations of trace elements Mn, Fe, Cu, Zn, and Co in milk from O_50 and O_100 groups showed no statistically significant differences compared to controls, they exhibited a clear upward trend. These results indicate that organic trace elements exert positive regulatory effects on the absorption, transport, and deposition of Mn, Fe, Cu, Zn, and Co in animals, despite not causing statistically significant differences. The concentration of organic trace elements in blood and their transport efficiency are critical factors in the enrichment of trace elements in milk. After reaching the mammary glands via the circulatory system, these elements can be efficiently transported and deposited into breast milk through epithelial cell-specific transport proteins in their organic form (Li et al. Reference Li, Wang and Jiang2025) (Table 4). Our study on bovine serum revealed significantly higher concentrations of Se ions in O_50 and O_100 groups compared to the control group (C). Although the concentrations of Mn, Cu, Zn, and Co showed minimal variation in the O_50 group, they continued to rise. Additionally, milk samples from O_50 group cows exhibited markedly elevated levels of manganese, copper, zinc, cobalt, and selenium compared to the control group. These findings suggest that organic trace elements may stabilize and enhance the concentration of trace elements in milk by optimizing blood transport efficiency and improving targeted supply capacity to mammary glands.
The balance of trace elements in the diet is very important for the nutrition of ruminants (Dove Reference Dove2010). The concentrations of trace elements in the blood of healthy animals will fluctuate within a certain range. The effect of trace elements in serum was not consistent in different studies. Cortinhas et al. (Reference Cortinhas, Freitas Júnior and Naves2012) found that organic trace elements cannot affect the concentrations of trace elements in the blood samples of dairy cows. In this study, the levels of Mn, Cu, Zn, and Co did not significantly change, but the serum trace element concentrations increased. This phenomenon may indicate that these elements exhibit “carrier competition” and “metabolic competition” within animal bodies. Research reveals that trace elements such as Zn and Fe have identical absorption sites. During digestion, these elements dissociate into free metal ions that compete for access to shared ion transport proteins, ultimately affecting the organism's ability to absorb essential micronutrients. The result was consistent with the experimental results. It was found that the selenium level and selenium conversion efficiency in dairy cows are mainly reflected by measuring the selenium concentrations in the plasma or whole blood and milk in dairy cows (Moschini et al. Reference Moschini, Battaglia and Beone2010). Li et al. (Reference Li, Liu and Xiong2019) showed that the addition of selenomethionine hydroxyl analogue to the diet caused a linear increase in serum selenium in cows. Gunter et al. (Reference Gunter, Beck and Phillips2003) reported that selenium was significantly increased in the peak blood of cows with organic selenium supplementation. The results of this experiment showed that the concentrations of Se ions in O_50 and O_100 were significantly higher than those of the C. With the increase of organic trace element additives, the concentrations of Se ions in the serum of dairy cows increased linearly. The results were similar to those of previous studies. This may be attributed to the particularity of the organic selenium structure, which completely shares the absorption channel of methionine without competing with metal trace elements for the absorption channel. The concentrations of Mn, Cu, Zn, and Co in the O_50 group did not change significantly; they also increased steadily, indicating that organic trace elements were effective in improving the concentration of trace elements in serum compared with the C group.
During the peak lactation period, dairy cows often experience energy negative balance and metabolic disorders, which generate excessive free radicals and predispose them to oxidative stress. Excessive oxygen-free radicals will cause oxidative damage to the organism (Alhidary et al. Reference Alhidary, Shini and Al Jassim2015). Organic trace elements can improve the antioxidant performance of the body through the expression of antioxidant enzyme genes and by reducing the production of substances causing oxidative stress; this not only directly mitigates oxidative damage caused by free radicals but also indirectly regulates immune function through the improvement of antioxidant capacity (Sun et al. Reference Sun, Gao and Wang2019). Warken et al. (Reference Warken, Lopes and Bottari2018) found that injecting selenium and copper into dairy cows could reduce the reactive oxygen species (ROS) level and improve the SOD activity, while increasing the levels of globulin and cytokines. Aitken et al. (Reference Aitken, Karcher and Rezamand2009) found that adding selenium could directly remove ROS to achieve the regulation of redox. In this experiment, dietary supplementation with organic trace elements significantly increased GSH-PX and SOD activity in dairy cows and decreased the MDA concentrations. Chen et al. (Reference Chen, Li and Shen2020) found that adding 40 mg/kg zinc methionine to pregnant cows could effectively improve the antioxidant performance of the body. Therefore, the application of organic trace elements can improve the antioxidant performance and immune function of animals to some extent. Immunoglobulin concentration can reflect the immune level of the organism (Villot et al. Reference Villot, Guan and Skidmore2019). IgA is produced by B lymphocytes and is the main antibody in the exocrine fluid (Satyanarayana et al. Reference Satyanarayana, Narasimha and Nagalakshmi2017). IgG can exert immune effects against bacteria, antiviral, and neutralizing toxins (Szyd Owski et al. Reference Szyd Owski, Jab Ońska and Juszczyński2014). This experiment found that the serum IgA concentrations of the O_50 and O_100 groups were significantly higher than those of the C group, with IgA concentrations increasing linearly and IgG concentrations increasing quadratically. The results of this experiment show that organic trace elements can increase the amount of immunoglobulin and improve the immune capacity. Selenium can enhance the immune function by improving the antioxidant effect (Gong and Xiao Reference Gong and Xiao2018). The addition of amino acid chelate salt enhances the activity of polymorphonuclear leukocytes (Batistel et al. Reference Batistel, Osorio and Tariq2017). In this experiment, organic trace elements increased the concentrations of IgA and IgG in the serum but had no significant effect on the T-AOC concentrations in dairy cows, possibly because the feeding environment, lactation stage, and season adversely affected the T-AOC concentrations in dairy cows.
The O_50 group showed that the differential metabolites found by the group were mainly involved in necroptosis, leishmaniasis, GnRH signaling pathway, Fc gamma R-mediated phagocytosis, serotonergic synapse, and inflammatory mediator regulation of TRP channels. The important precursors of these metabolic pathways are SM (d18:1/20:0), LPC (18:1), AA, and serotonin. The O_100 group of the differential metabolites found was mainly involved in lysine degradation, sphingolipid metabolism, drug metabolism-cytochrome P450, ABC transport tools, and other pathways. The differential metabolite-related pathways were 3,5-diaminoacetic acid, carnitine, SM (d18:1/20:0), and N-trimethylamine oxide. The results of this experiment showed that the serum metabolite LPC (18:1) was significantly upregulated in the O_50 group of dairy cows, and LPC (18:1) was involved in the process of choline metabolism. Therefore, organic trace elements may regulate dairy cow lipid metabolism by participating in the body's choline metabolism pathway. Free AA produces eicosanoid acid through the reaction of enzymatic and non-enzymatic processes and improves the immune capacity of the animal body (Sonnweber et al. Reference Sonnweber, Pizzini and Nairz2018). This is consistent with the conclusion that GSH-PX and SOD activity increased significantly in the early stage of this experiment. Research showed that AA has strong therapeutic effects on Schistosoma mansoni (El Ridi and Tallima Reference El Ridi and Tallima2013). In this experiment, the O_50 group of the serum metabolites of AA had a positive regulatory effect on the leishmaniasis pathway. Therefore, the O-50 group upregulated AA expression, which mediated its positive immunomodulatory effects via the leishmaniasis pathway, consequently contributing to the amelioration of inflammation. Serotonin is a monoamine compound mainly synthesized by tryptophan through the catalytic actions of tryptophan hydroxylase and aromatic L-amino acid decarboxylase (Qiao et al. Reference Qiao, Jiang and Liu2019). It was found that excessive 5-HT concentration could increase the number of somatic cells in cow milk, and 5-HT could slow down the development of inflammatory disease by inhibiting lipopolysaccharide-induced combination of NO and IL-6 and TNF-α (Chae et al. Reference Chae, Kang and Choi2009; Kessler et al. Reference Kessler, Wall and Hernandez2019). In the early stage of this experiment, it was found that the IL-6 concentrations in the O_50 group were significantly reduced, indicating that serotonin may inhibit the synthesis of IL-6 by participating in the serotonergic synaptic pathway and then improve the immune function of the organism. Lysine can increase the growth performance, slaughter performance, and meat quality of ruminants while improving nitrogen balance and health (Van den Bossche et al. Reference Van den Bossche, Goossens and Ampe2023). In addition, lysine acetylation modification plays a key role in the regulation of metabolism (Dominy et al. Reference Dominy, Gerharthines and Puigserver2011). L-carnitine participates in the metabolism of three major nutrients in the organism, which can promote the lipid redistribution of the body and has an important role in the lipid metabolism of animals (Carillo et al. Reference Carillo, Bertapelle and Scialò2020). Studies show that L-carnitine has positive effects on lactation performance in dairy cows (Meyer et al. Reference Meyer, Daniels and Grindler2020). This experiment found that the O_100 group was involved in the lysine degradation pathway and metabolism pathway, so the O_100 group improves the growth performance and slaughter performance of dairy cows by upregulating the amino acids of serum metabolites, 3,5-diaminoacetic acid, and carnitine. The cytochrome P450 pathway was involved in body immunity, inflammation, oxidative stress response, and injury processes by producing eicosanoid acids (Wang et al. Reference Wang, Wu and Chen2021). In this study, the O_100 group of the differential metabolites was involved in the cytochrome P450 pathway, and the results showed that organic trace elements could improve the oxidative stress response and improve the immune capacity by participating in the cytochrome P450 pathway. Metabolites of sphingomyelin are involved in regulating cell proliferation, apoptosis, migration, differentiation, immunity, and inflammatory processes (Cordeiro and Silva Reference Cordeiro and Silva2019; Yu et al. Reference Yu, Kim and Kim2019). This experiment found that the O_100 group of the SM (d18:1/20:0) was upregulated, so organic trace elements may slow down the inflammatory response of dairy cows by participating in programmed cell necrosis, sphingomyelin signaling pathway, and sphingolipid metabolism.
Conclusions
Feeding organic trace elements significantly increase the lactose concentrations and improve the milk protein concentrations. Organic trace elements can improve the levels of Se and Co in serum. Feeding organic trace elements has the effect of improving the antioxidant properties and immunity of dairy cows. Metabolomics analysis revealed that the O_50 group may participate in choline metabolism in the body by upregulating the expression of LPC (18:1), AA, and serotonin. The leishmaniasis pathway and serotonergic synaptic pathway inhibit IL-6 synthesis, thereby improving the immune function of the organism. The differential metabolites in the O_100 group were primarily involved in pathways such as lysine degradation, sphingolipid metabolism, drug metabolism – cytochrome P450, and ABC transporters, which collectively modulate immune responses, oxidative stress, and damage processes.
Supplementary material
The supplementary material for this article can be found at https://doi.org/10.1017/anr.2026.10049.
Data availability statement
The data presented in this study are available upon request from the corresponding author.
Acknowledgements
The authors wish to thank Shounong Sanyuan Green Lotus Second in Baodi District, Tianjin, for the support of the ranch breeding base for the experiment.
Author contributions
X.X.C. and P.H. completed the whole experiment, and X.X.C. wrote the main manuscript text. X.X.C., Z.W., E.L.L., D.W., and X.L.L. participated in the data processing. Y.J.T. and K.Y. assisted in the experimental design. All the authors have reviewed the manuscript.
Funding statement
The current research was supported by the Earmarked Fund for CARS (CARS-36); Research and Demonstration of Green and Efficient Breeding of Dairy Cows and High-Quality Fresh Milk Production System (2021GJ206); Tianjin Dairy Cow (Mutton Sheep) Industrial Technology System Innovation Team Construction Project (ITTCRS2021000).
Conflicts of interest
The authors declare no conflict of interest.







 Open access

