Introduction
High-entropy alloys (HEAs), which are multicomponent alloys composed of multiple elements, have widely been investigated for their outstanding mechanical properties and thermal/electrical stabilities [Reference Yeh, Chen, Lin, Gan, Chin, Shun, Tsau and Chang1]. Although HEAs generally exhibit great strength that mainly arises from the significant lattice distortion induced by atomic size differences among alloying elements, they also exhibit a wide range of strengths depending on their composition [Reference Gwalani, Soni, Choudhuri, Lee, Hwang, Nam, Ryu, Hong and Banerjee2, Reference Tsai, Yuan, Cheng, Xu, Tsai, Tsai, Jian, Juan, Shen, Chuang, Yeh and Zhu3]. For CoCrCuFeNi-based alloys, a number of studies have been performed regarding the compositional effect on microstructural evolution (i.e., phase transformation and/or second phase precipitation) and other resulting properties [Reference Wang, Zhang, Qiao and Chen4, Reference Tong, Chen, Yeh, Lin, Chen, Shun, Tsau and Chang5, Reference Kumar, Dhekne, Swarnakar and Chopkar6]. In casting materials, CoCrCuFeNi HEAs exhibit yield strength of 230 MPa, which increases to 700 MPa upon the addition of Ti [Reference Wang, Zhang, Qiao and Chen4]. The addition of elements with large atomic size (e.g., Al, Si, Ti) can significantly increase the degree of solid solution hardening [Reference Tong, Chen, Yeh, Lin, Chen, Shun, Tsau and Chang5, Reference Borkar, Gwalani, Choudhuri, Mikler, Yannetta, Chen, Ramanujan, Styles, Gibson and Banerjee7]. The Vickers hardness of AlxCoCrCuFeNi alloys [Reference Tong, Chen, Yeh, Lin, Chen, Shun, Tsau and Chang5] increased from approximately 130 to 210 Hv with increasing Al content without phase transformation until x = 0.5. Furthermore, when the Al concentration exceeded x = 0.5, the hardness significantly increased due to the phase transformation from a face-centered cubic (FCC) to body-centered cubic (BCC) structure. The formation of hard second phases (e.g., Sigma phase and Laves phase) in HEAs causes additional strengthening by precipitation hardening [Reference Jiang, Han, Qiao, Lu, Cao and Li8, Reference Liu, Yang and Liu9]. The addition of Mo to the CoCrFeNi HEA increased the strength from 155 to 815 MPa due to precipitation of the Sigma phases [Reference Liu, Yang and Liu9].
On the other hand, nanocrystalline (NC; grain size, d: d < 100 nm) or ultrafine-grained (UFG; grain size: 100 nm < d < 1 µm) HEAs have been used in the development of ultra-high-strength materials, where the strength of the crystalline materials is dramatically enhanced with microstructural refinement to the nanoscale [Reference Koch10, Reference Zou, Wheeler, Ma, Okle and Spolenak11]. Generally, NC and/or UFG materials are produced via severe plastic deformation (SPD) and powder metallurgy (P/M) [Reference Shahmir, He, Lu, Kawasaki and Langdon12, Reference Yu, Cheng, Zhang, Zhang, Jing, Ma, Liaw, Li and Liu13, Reference Nam, Kim, Hwang and Choi14, Reference Ganji, Sai Karthik, Bhanu Sankara Rao and Rajulapati15]. For SPD processes, high-pressure torsion (HPT) and equal-channel angular pressing (ECAP) are employed to refine the microstructure of HEAs by introducing a strong shear force into the materials [Reference Lee, Choi, Seok, He, Lu, Suh, Kawasaki, Langdon and Jang16, Reference Schuh, Mendez-Martin, Völker, George, Clemens, Pippan and Hohenwarter17, Reference Shahmir, Mousavi, He, Lu, Kawasaki and Langdon18]. CoCrFeMnNi HEA produced by HPT exhibits a grain size and nanoindentation hardness of approximately 40 nm and 6.2 GPa, respectively [Reference Lee, Choi, Seok, He, Lu, Suh, Kawasaki, Langdon and Jang16]. Moreover, the yield strength of CoCrFeMnNi HEA increased from 240 to 980 MPa with increasing ECAP pass number because of the refined microstructures [Reference Shahmir, Mousavi, He, Lu, Kawasaki and Langdon18]. For P/M, on the other hand, mechanical alloying is considered to be a useful method for synthesizing nanostructured alloys [Reference Ji, Wang, Wang, Zhang, Wang, Zhang and Fu19, Reference Chen, Fu, Fang, Xiao and Zhu20]. Multicomponent powders are uniformly mixed at the atomic level during ball milling, and the microstructures are significantly refined by the high impact energy of the balls [Reference Fecht, Hellstern, Fu and Johnson21]. Al7.5Co25Cu17.5Fe25Ni25 and Al0.15CoCrCuFeNi HEAs produced by high-energy ball milling followed by sintering showed high yield strengths of 1795 and 2047 MPa, respectively, due to the nanostructure with average grain sizes of 95 and 167.2 nm, respectively [Reference Nam, Kim, Hwang and Choi14, Reference Fu, Chen, Wen, Zhang, Chen, Zheng, Zhou and Lavernia22].
Although the nanostructured microstructures effectively enhance the strength of crystalline metals, plastic deformation is limited because of their inability to accumulate dislocations inside the nanoscale grains and the high residual stress [Reference Koch, Morris, Lu and Inoue23, Reference Van Swygenhoven and Weertman24]. It is well known that the poor elongation of NC/UFG materials can be recovered by annealing due to strain relaxation. Sun et al. investigated the microstructural and mechanical evolution as a function of annealing temperature in UFG CoCrFeMnNi HEAs produced via casting followed by cold rolling [Reference Sun, Tian, Lin, Dong, Wang, Zhang and Zhang25]. Full recrystallization in the HEA annealed at 650 °C resulted in an ideal balance between strength and elongation. Even though the material ductility was enhanced by annealing at high temperatures, decreased strength was observed as part of the well-known strength–ductility trade-off. However, this trend may differ in NC HEAs prepared using conventional metals or alloys because of their unique microstructural features based on significantly distorted lattices of multiple elements [Reference Ma and Zhu26, Reference Wu, Yuan, Yang, Jiang, Zhang, Chen, Wei and Ma27, Reference Li, Pradeep, Deng, Raabe and Tasan28]. Nevertheless, the effect of grain size on deformation behavior has rarely been studied in NC HEA materials.
In this study, we investigated the microstructural evolution and mechanical properties after heat treatment of NC CoCrCuFeNi HEAs prepared by mechanical alloying followed by spark plasma sintering (SPS) at various temperatures. First, microstructural changes (e.g., grain size, phase) of the ball-milled HEAs and heat-treated pallets were examined after varied milling durations and heat treatment temperatures. Subsequently, the strengthening and deformation behaviors of NC and UFG CoCrCuFeNi HEAs are discussed with consideration of the volume fraction and composition of each phase along with grain size.
Results
Phase evolution after ball milling, sintering, and heat treatment
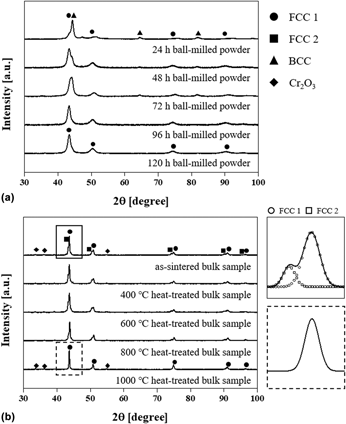
Figure 1(a) shows the X-ray diffraction (XRD) patterns of the Co–Cr–Cu–Fe–Ni powders ball milled for 24, 48, 72, 96, and 120 h. Powders after less than 72 h of milling exhibited peaks corresponding to FCC and BCC phases regardless of milling time, while a single FCC phase was observed after milling for >96 h. During milling, the high impact energy of the balls on the mixed elemental powder induces repeated flattening and cold welding, forming lamellar structures and accelerating atomic diffusion at the interface between lamella. This process results in atomic-level alloying and the formation of a metastable phase [Reference Suryanarayana29]. Hence, the single FCC phase, which is predicted to be observed in an equiatomic CoCrCuFeNi alloy according to the phase formation rule for HEAs [Reference Yang and Zhang30, Reference Guo, Ng, Lu and Liu31], was formed after ball milling the mixed powder for >96 h. Based on the XRD analysis, the 120-h milled powder was selected for further processing to ensure the finest microstructure and compositional homogeneity. Figure 1(b) shows the XRD of an as-sintered HEA pallet and the samples after heat treatment at 400, 600, 800, and 1000 °C. After sintering, the single phase was separated into two FCC phases with different lattice parameters (i.e., 3.586 and 3.615 Å for FCC 1 and 2, respectively) and Cr oxides were newly formed. While the patterns of CoCrCuFeNi HEAs after heat treatment at 400, 600, and 800 °C were similar to that of the as-sintered sample, the peak corresponding to a single FCC phase was observed in the 1000 °C heat-treated HEA. The patterns inserted in Fig. 1(b) clearly present the phase transformation from two FCC phases to a single FCC phase after heat treatment at 1000 °C.
XRD patterns of (a) CoCrCuFeNi powders ball milled for 24, 48, 72, 96, and 120 h, and (b) bulk HEA samples after SPS and heat treatment at 400, 600, 800, and 1000 °C. The inserted patterns in (b) reveal the expended patterns of as-sintered and 1000 °C heat-treated alloys at 2θ range of 42–45°.

Microstructures and elemental distribution in HEAs
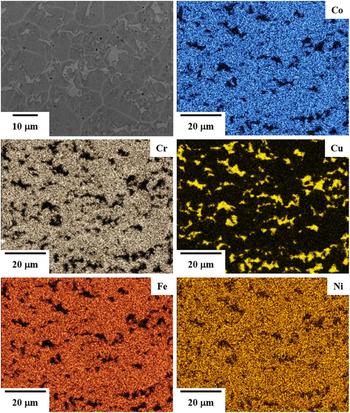
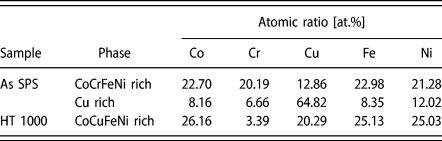
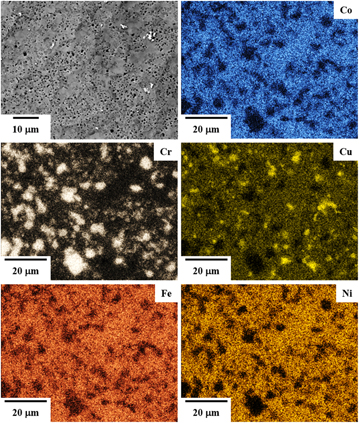
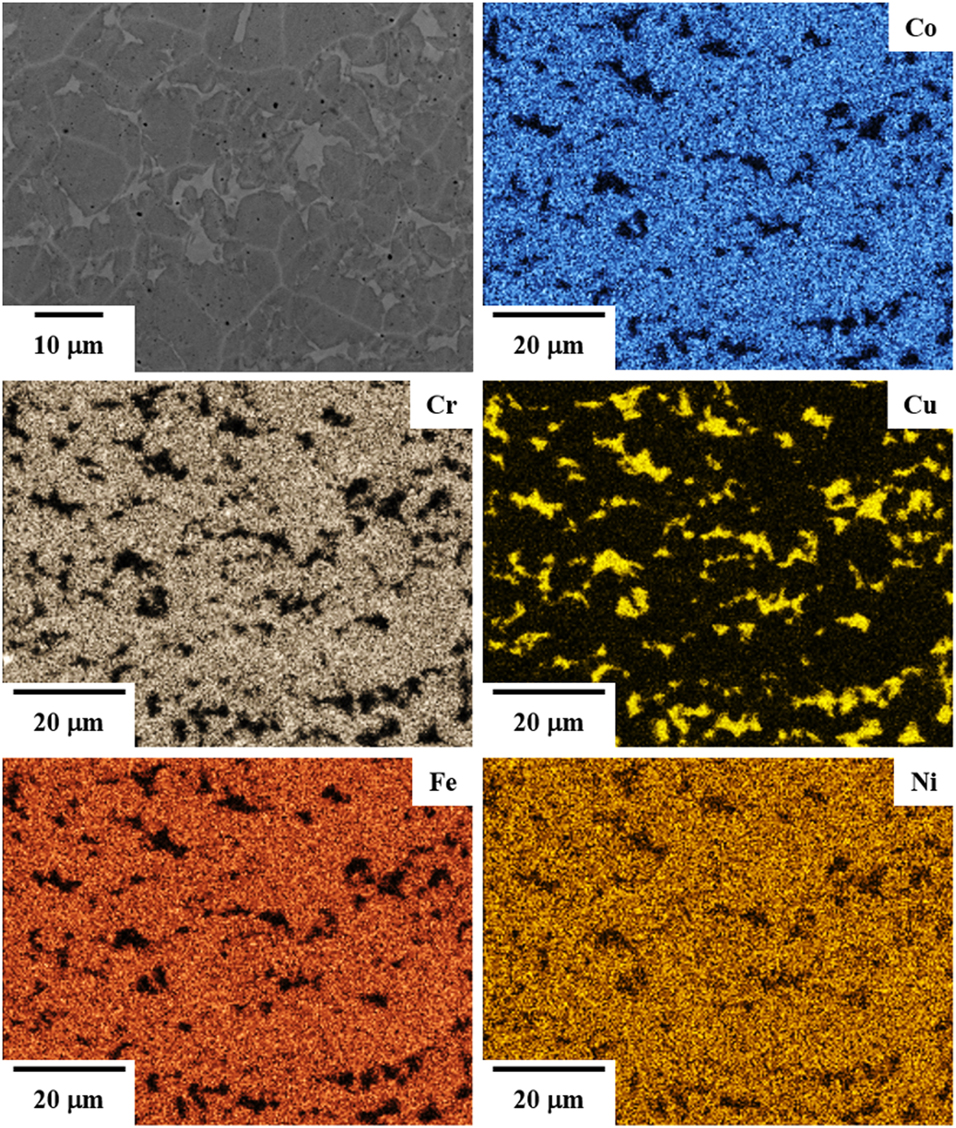
To investigate the microstructural evolution and elemental distribution after heat treatment, the surface of the as-sintered and 1000 °C heat-treated CoCrCuFeNi HEAs was observed using scanning electron microscopy with energy-dispersive X-ray spectroscopy (SEM-EDS), as shown in Figs. 2 and 3, respectively. Elemental maps of the as-sintered sample (Fig. 2) show two separate CoCrFeNi-rich (named by FCC 1) and Cu-rich phases (named by FCC 2), and the atomic ratio of each phase is listed in Table I. Because Cu has positive mixing enthalpies with other elements, the Cu-rich phase might be separately formed in the alloy [Reference Boer32, Reference Sheng, Gong and Peng33, Reference Guo, Li, Wang, Wang, Kou and Niu34]. However, after heat treatment at 1000 °C (Fig. 3), CoCuFeNi-rich and Cr oxide are observed in the HEA. The Cr atoms were removed from the CoCrFeNi-rich phase in order to coarsening the Cr2O3 during the heat treatment in air atmosphere, and Cu atoms dissolved into the CoFeNi-rich phase. The Gibbs free energy of mixing (ΔG mix) decreases to a negative value with increasing temperature (T, i.e., ΔG mix = ΔH mix − T·ΔS conf, where ΔH mix is the mixing enthalpy and ΔS conf is the configuration entropy). Thus, the ability to form a solid solution phase is generally enhanced at high temperatures. Moreover, the thermodynamic calculations based on CALPAD modeling with the TCHEA1 database [Reference Mao, Chen and Chen35] also support the transformation of two separate FCC phases to a single solid solution FCC phase at temperatures of >800 °C. Because most Cr atoms were consumed to form Cr precipitates, the composition of the matrix in the HEAs after heat treatment at 1000 °C is similar to that in the CoCuFeNi HEAs. Thus, the XRD results for the 1000 °C heat-treated HEA show a single FCC phase with Cr precipitates, whereas the as-sintered alloy exhibits two separate FCC phases.
SEM image and elemental maps of the as-sintered CoCrCuFeNi HEA.
Chemical composition (at.%) of phases in CoCrCuFeNi HEAs.

SEM image and elemental maps of 1000 °C heat-treated HEA.

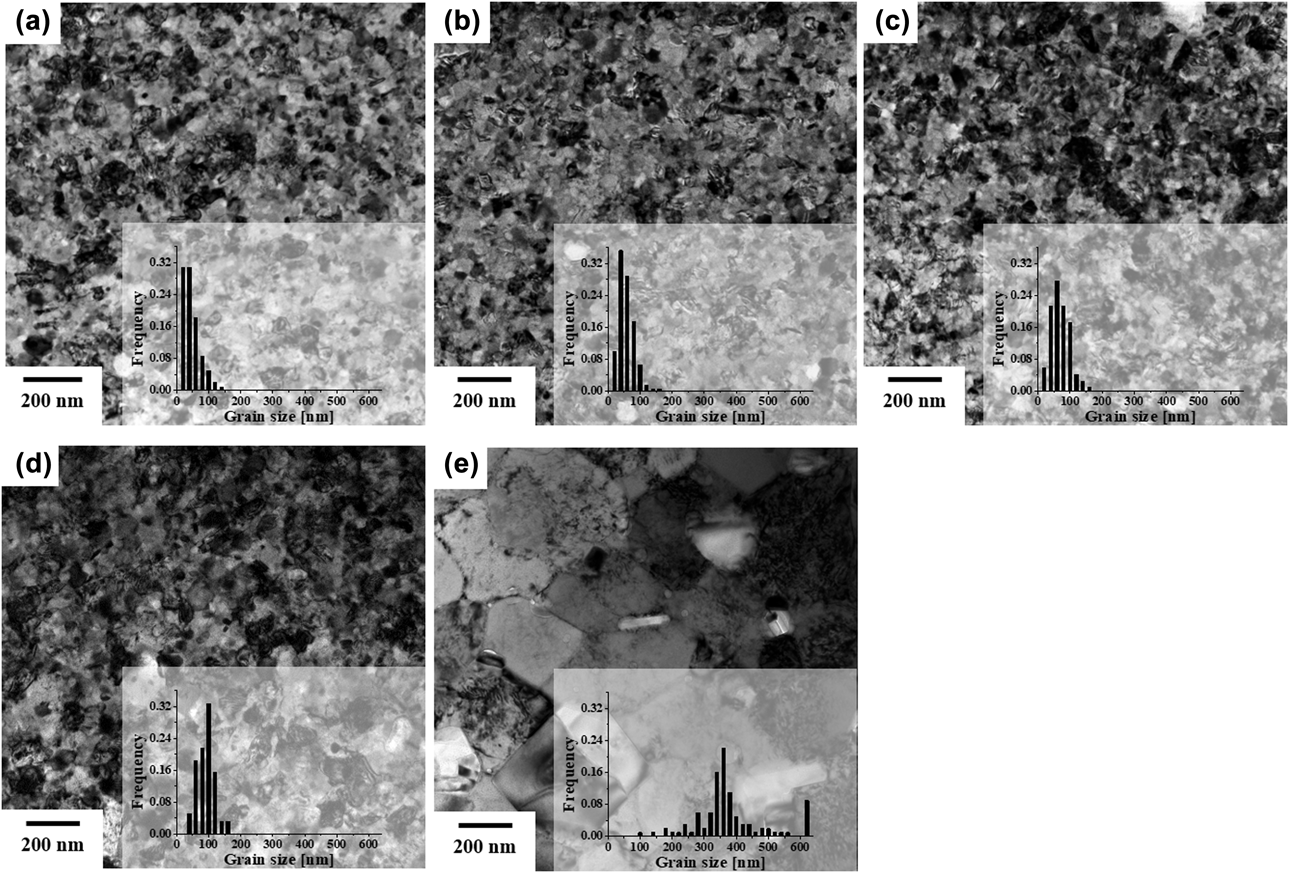
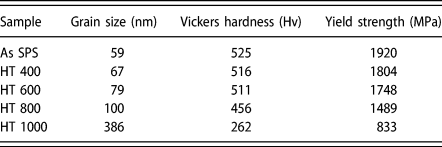
The evolution of the CoCrCuFeNi HEA grain size before and after heat treatment was investigated using linear intercept method, which use lines randomly drawn on the transmission electron microscopy (TEM) images. Figure 4 shows TEM images of the as-sintered HEA and alloys heat treated at 400, 600, 800, and 1000 °C. The average grain sizes of the alloys are listed in Table II. The grain size significantly increased from 59 to 386 nm after heat treatment at 1000 °C compared to alloys heat treated at other temperatures. The degree of grain size increase after heat treatment [i.e.,  ${{\left( {{D_{\rm{T}}} - {D_0}} \right)} / {{D_0}}} \times 100$, where D 0 is the grain size of the as-sintered HEA and D T is the grain size of the alloys after heat treatment] is 13.6, 33.9, 69.6, and 554.2% at 400, 600, 800, and 1000 °C, respectively.
TEM images and grain size distribution of (a) as-sintered HEA and alloys after heat treatment at (b) 400, (c) 600, (d) 800, and (e) 1000 °C.

Summary of grain size, Vickers hardness, and yield strength of as-sintered CoCrCuFeNi and the alloy heat treated (HT) at 400, 600, 800, and 100 °C.

Mechanical properties of the CoCrCuFeNi HEAs
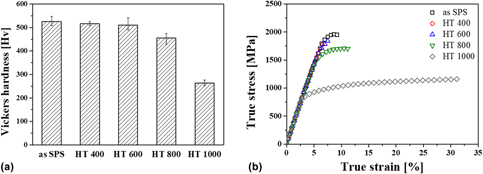
Figure 5 shows a comparison of (i) Vickers hardness and (ii) compressive true stress–true strain curves among the as-sintered CoCrCuFeNi HEA and alloys after heat treatment at various temperatures. The measured hardness and yield strength values are listed in Table II. The hardness and yield strength of the as-sintered CoCrCuFeNi HEA reveal high values of 525 Hv and 1920 MPa, respectively, which are superior to FCC phase–based HEAs reported in literatures; CoCrCuFeNi and CoCrFeMnNi HEAs produced via casting exhibit hardness and yield values of 130 Hv and 209 MPa, respectively [Reference Yeh, Chen, Lin, Gan, Chin, Shun, Tsau and Chang1, Reference He, Liu, Wang, Wu, Liu, Nieh and Lu36]. However, after heat treatment, the respective values decrease to 262 Hv and 833 MPa with increasing heat treatment temperatures. Moreover, the 400 and 600 °C heat-treated alloys were instantly fractured after yielding because of coarsening the brittle Cr precipitates. Interestingly, plastic strain to failure of the 1000 °C heat-treated alloy increased by approximately 8–32%. This is related to the microstructural evolution of the phases, composition, and grain size after heat treatment. The strengthening and deformation mechanism will be discussed in “Discussion” section, considering the observed microstructural changes in detail.
(a) Comparison of Vickers hardness and (b) true strain–true stress curves among as-sintered HEA and alloys after heat-treatment at 400, 600, 800, and 1000 °C.

Discussion
The strengthening and deformation behaviors of the CoCrCuFeNi HEAs can be discussed with respect to their volume fraction, composition of each phase, and grain size. The microstructure of the as-sintered and 1000 °C heat-treated alloys was compared to examine the effect of each microstructural parameter on the yield strength of the alloys. The as-sintered HEAs contained two FCC phases (i.e., the CoCrFeNi-rich and Cu-rich phases) and nanoscale grains (59 nm on average), while the heat-treated alloys exhibited a single CoCuFeNi-rich FCC phase and was UFG, with an average size of 386 nm. Because of these microstructural changes, the yield strength decreased from 1920 to 833 MPa after heat treatment.
Strengthening behavior in P/M CoCrCuFeNi HEAs
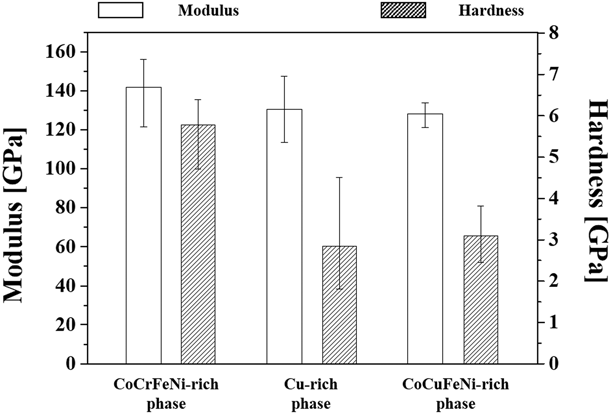
The mechanical properties of each phase were separately measured using a picoindentation technique, and Fig. 6 summarizes the hardness and elastic moduli of the phases. While all phases exhibit a similar elastic modulus ranging from 130 to 140 GPa, the hardness of the CoCrFeNi-rich phase (5.78 GPa) is significantly higher than that of Cu-rich (2.84 GPa) and CoCuFeNi-rich (3.09 GPa) phases. For the as-sintered alloy, the Cu-rich phase was ∼12 vol% based on the EDS images, and the hardness was roughly estimated using the rule of mixtures (i.e., H = H CoCrFeNi·V CoCrFeNi + H Cu·V Cu, where H phase and V phase are the hardness and volume fraction of the phase, respectively) as ∼5.41 GPa, which is not significantly different from that of the single CoCrFeNi-rich phase (5.78 GPa). Thus, the significant difference in strength between the as-sintered and heat-treated alloys originates from HEA phases themselves, and the effect of the Cu-rich phase is negligible.
Comparison of elastic modulus and hardness measured on CoCrFeNi-rich and Cu-rich phases in the as-sintered HEA and CoCuFeNi-rich phase in 1000 °C heat-treated HEA.

Differences in the degree of lattice distortion and grain size result in significant hardness difference between the CoCrFeNi-rich phase in the as-sintered alloy and CoCuFeNi-rich phase in the heat-treated alloy. Solid solution hardening and grain boundary strengthening are prominent strengthening mechanisms in the HEAs. In solid solution hardening, the strengthening efficiency is related to the degree of lattice distortion, which can be described by the atomic size misfit (δ) as below [Reference Fang, Xiao, Xia, Li and Dong37]:
 $$\delta = 100\sqrt {\mathop \sum \limits_{i = 1}^n {x_i}{{\left( {1 - {r_i}/\bar{r}} \right)}^2}} \quad ,$$
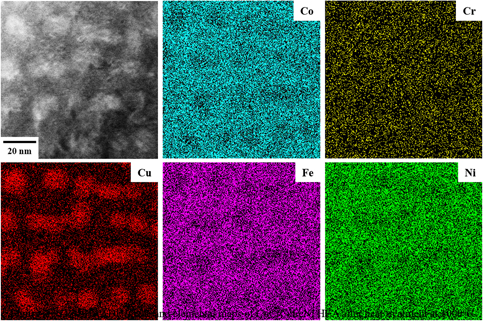
where x i is the content of the ith element and r i and  $\bar{r}$ are atomic radius and average atomic radius of the ith element, respectively. The atomic size misfit of the as-sintered and 1000 °C heat-treated HEAs was 0.886 and 1.061, respectively, based on the experimentally measured composition (Table I). Since the atomic size of Cu is much larger than that of the other alloying elements, the misfit value increases with increasing Cu concentration. Thus, the solid solution hardening efficiency is higher in the heat-treated HEA than in the as-sintered alloy. However, nanoscale Cu segregates were formed in the grain interior after heat treatment, as shown in Fig. 7, which shows scanning TEM high-angle annular dark-field (STEM-HAADF) image and elemental maps of 1000 °C heat-treated HEA and a certain amount of Cu atoms remained undissolved in the HEA grains. The formation of nanoscale Cu segregates in HEAs has been reported to result in a considerable loss of solid solution hardening due to reduced lattice strains [Reference Xu, Liu, Guo, Hirata, Fujita, Nieh, Liu and Chen38, Reference Sonkusare, Janani, Gurao, Sarkar, Sen, Pradeep and Biswas39]. Thus, the effect of Cu atoms on lattice distortion in the heat-treated alloy may also be negligible.
STEM-HAADF image and elemental maps of 1000 °C heat-treated HEA.

The high hardness of the CoCrFeNi-rich HEA phases mainly arises from their small grain size. The grain size of the CoCrCuFeNi HEAs increased from 59 to 386 nm after heat treatment at 1000 °C, while the yield strength of the alloys was reduced from 1920 to 833 MPa. The strengthening effect of grain size (i.e., grain boundary strengthening) in NC and UFG CoCrCuFeNi HEAs can be predicted using the Hall–Petch relationship [Reference Courtney40].
 $${\sigma _{\rm{y}}} = {\sigma _0} + {k_{{\rm{hp}}}}{D^{ - 1/2}}\quad ,$$
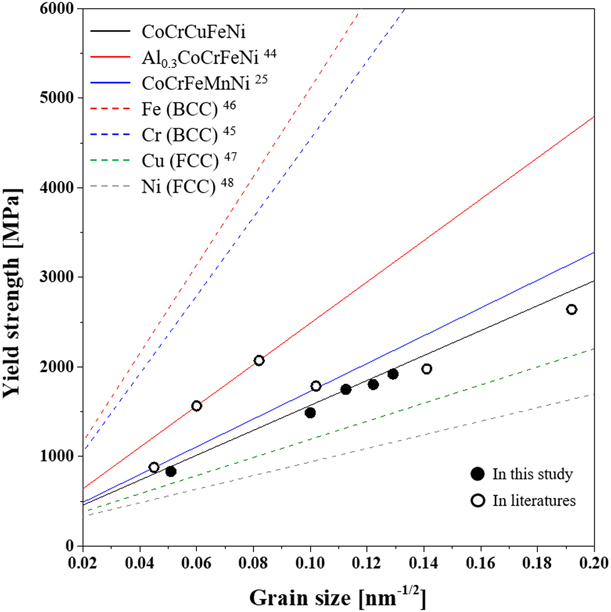
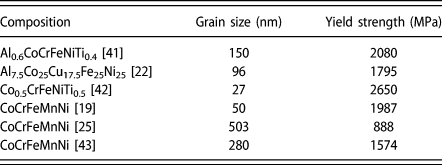
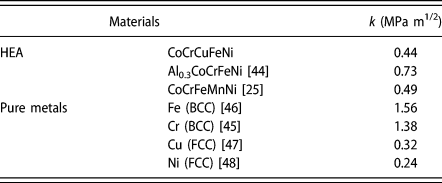
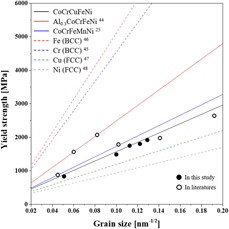
where σy is the yield strength, σ0 is the intrinsic strength, k hp is the strengthening coefficient, and D is the average grain size. Figure 8 shows the correlation between the yield strength and grain size of the HEAs. The solid and open circles represent data obtained in this study and those reported in literatures [Reference Ji, Wang, Wang, Zhang, Wang, Zhang and Fu19, Reference Fu, Chen, Wen, Zhang, Chen, Zheng, Zhou and Lavernia22, Reference Sun, Tian, Lin, Dong, Wang, Zhang and Zhang25, Reference Fu, Chen, Fang, Zhang, Xiao and Zhu41, Reference Fu, Chen, Xiao, Zhou, Zhu and Yang42, Reference Joo, Kato, Jang, Moon, Kim, Hong and Kim43] (Table III), respectively. Furthermore, the measured strength was compared with theoretical values (marked by lines) calculated using Eq. (2), where the strengthening coefficient for HEAs is listed in Table IV [Reference Sun, Tian, Lin, Dong, Wang, Zhang and Zhang25, Reference Ma, Zhang, Qiao, Wang, Gao, Jiao, Yang and Zhang44]. In this study, the strength matched with the Hall–Petch relationship using a strengthening coefficient of 0.44 MPa m1/2. While the coefficient is similar to the previously reported value for CoCrFeMnNi [Reference Sun, Tian, Lin, Dong, Wang, Zhang and Zhang25] (0.49 MPa m1/2) evaluated for grain sizes ranging from 503 nm to 88.9 µm, Al0.3CoCrCuFeNi [Reference Ma, Zhang, Qiao, Wang, Gao, Jiao, Yang and Zhang44] exhibited a high strengthening coefficient value of 0.73 MPa m1/2. Furthermore, the efficiency of grain boundary strengthening in the HEAs was compared with that in NC pure metals with FCC and BCC structures. In general, the strengthening coefficient for metals with a BCC structure (e.g., Cr [Reference Wu, Zhang, Huang, Bei and Nieh45] and Fe [Reference Khan, Zhang and Takacs46]) is higher than for those with the FCC phase (e.g., Cu [Reference Chen, Lu and Lu47] and Ni [Reference Godon, Creus, Cohendoz, Conforto, Feaugas, Girault and Savall48]), as summarized in Table IV. This indicates that the efficiency of boundary strengthening is maximized in BCC metals, as shown in Fig. 8 (marked by dash-line). As the efficiency of grain boundary strengthening is related to the activation of the dislocation source by stress concentration at the grain boundary, the strengthening coefficient can be expressed as function of the shear modulus (G) and Burgers vector (b) of the material, as follows [Reference Armstrong, Codd, Douthwaite and Petch49]:
 $${k_{{\rm{HP}}}} \approx {\left( {\pi {m_{\rm{s}}}{\tau _{\rm{c}}}Gb} \right)^{1/2}}\quad ,$$
where m s is the microstructural orientation factor and τc is the shear stress required for dislocation activation near the grain boundary. Moreover, the coefficient is influenced by the number of available slip systems according to the pile-up model [Reference Armstrong, Codd, Douthwaite and Petch49, Reference Arko and Liu50]. The slope of the strength variation depending on grain size shows an inverse relationship with the number of slip systems in crystalline materials. Thus, BCC phases may require a large critical shear stress for dislocation propagation at the boundary because of their high shear modulus and limited dislocation slip due to the lower atomic packing fraction compared with FCC phases [Reference Wu, Zhang, Huang, Bei and Nieh45]. However, grain boundary strengthening tends to be more effective in HEAs than their related pure elemental metals, despite adopting the same FCC structure. Because of the significant lattice distortion in HEAs, additional shear stress for dislocation activation is needed to overcome the lattice strain. Hence, the strengthening coefficient of Al0.3CoCrFeNi is higher than those of CoCrCuFeNi and CoCrFeMnNi due to the larger atomic size of Al [Reference Sun, Tian, Lin, Dong, Wang, Zhang and Zhang25, Reference Wu, Zhang, Huang, Bei and Nieh45]. Thus, grain boundary strengthening coupled with lattice distortion is a dominant strengthening mechanism in NC and UFG CoCrCuFeNi HEAs.
Correlation between yield strength and grain size of HEAs and pure metals measured in this study and reported in literatures.

Summary of grain size and yield strength of HEAs reported in literatures.

Summary of strengthening coefficient of HEAs and pure metals calculated in this study and reported in literatures.

Deformation mechanism in CoCrCuFeNi HEAs
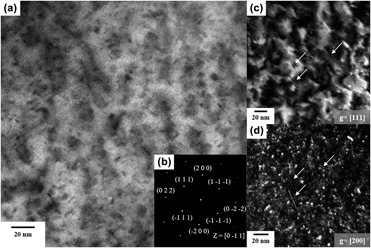
As previously mentioned, the plastic strain to failure of HEAs increased after heat treatment at 1000 °C. To investigate the deformation behavior in the alloy, TEM specimens were prepared from the heat-treated CoCrCuFeNi HEA after compressive deformation with a strain of 5% at room temperature. Figure 9(a) shows the STEM high-angle annual bright-filed (HAABF) image of the deformed alloy and Fig. 9(b) shows the selected area diffraction pattern obtained at the grain in Fig. 9(a). The image is the projection for the {011} plane of the alloy. Moreover, two-beam diffraction, the TEM technique used to visualize dislocations as sharp lines with bright contrast in a dark-field (DF) image, was used to observe line defects in the alloy. Figures 9(c) and 9(d) show the TEM weak-beam DF images of the grain observed parallel to  $\left[ {\bar{0}11} \right]$ with diffraction vectors of g = [111] and g = [200], respectively. Dislocations were observed, as marked by white arrows in Figs. 9(c) and 9(d). Moreover, the observed dislocation was determined to be an edge dislocation with Burgers vector of
 $b = \left[ {01\bar{1}} \right]$, according to the rule for dislocation analysis [Reference Williams and Carter51]. Depending on the composition of the alloys, different deformation mechanisms have been reported according to the stacking fault energy (SFE) of the HEAs [Reference Laplanche, Kostka, Horst, Eggeler and George52, Reference Liu, Chen, Xu, Wu, Wang, Wang, Fang and Meng53]. In particular, the deformation behavior of CoCrFeMnNi-based HEAs with low SFEs was determined to be dislocation gliding at the initial plasticity stages, while deformation twinning dominates afterward [Reference Otto, Dlouhý, Somsen, Bei, Eggeler and George54]. However, UFG CoCrCuFeNi HEAs exhibit dislocation gliding as the dominant deformation behavior because their SFEs are higher than those of CoCrFeMnNi. Moreover, the refined microstructure influences the behavior, wherein twinning is more significant in materials with larger grains, as previously reported [Reference Wu, Wang, Yi, Jia, Hussain, Zhai and Liaw55]. The strengthening behavior of CoCrCuFeNi HEAs followed a Hall–Petch relationship, which is related to dislocation pile-up at the grain boundaries. Even though the strength of CoCrCuFeNi HEAs was reduced after heat treatment, the grain growth after heat treatment resulted in improved plastic deformation due to dislocation activation, showing the typical strength–ductility trade-off depending on the grain size.
(a) STEM-HAABF image and (b) selected area diffraction pattern and TEM weak-beam DF images observed at (c) g = [111] and (d) g = [200] of 1000 °C heat-treated HEA.

Conclusion
NC CoCrCuFeNi HEAs were produced via mechanical alloying followed by SPS, and subsequently, heat treatment was performed to produce their UFG HEAs counterparts. The as-sintered HEAs contained two FCC phases (i.e., CoCrFeNi-rich and Cu-rich phases), whereas 1000 °C heat-treated HEA revealed a single CoCuFeNi-rich phase with an FCC structure. Moreover, the grain size increased from 59 to 386 nm after heat treatment. Consequently, although yield strength decreased from 1930 to 883 MPa, plastic strain to failure increased from 8 to 32% owing to the activation of lattice dislocations. According to microstructural observation, the dominant strengthening mechanism for NC CoCrCuFeNi HEAs can be considered to be grain boundary strengthening. Furthermore, the strengthening coefficient for boundary strengthening of NC HEA was higher than that in the corresponding pure elemental metals with FCC structure owing to its significant lattice distortion.
Experimental procedure
CoCrCuFeNi HEAs, with a wide range of grain sizes from 59 to 386 nm, were produced by annealing P/M HEAs produced via ball milling followed by SPS. First, a hand mixed blend of Co, Cr, Cu, Fe, and Ni powders (all powders with >99.5% purity, supplied by Sigma–Aldrich Korea Co., Ltd., Yongin, Korea) with equiatomic ratio was mechanically alloyed using an attrition mill (AT-01; Daewha tech Co., Ltd., Yongin, Korea). Stainless steel balls of 5 mm diameter were utilized as the milling media with a ball-to-powder ratio of 10:1, and 2 wt% stearic acid [CH3(CH2)16CO2H; Sigma Aldrich Korea Co., Ltd., Yongin, Korea] was used as a process control agent to prevent powder agglomeration during milling. The blend powder, balls, and stearic acid were placed into a stainless steel chamber. To prevent the increase of internal temperature during milling, cooling water was circulated through the wall of the chamber. High-energy ball milling was performed at 600 rpm for 24, 48, 72, 96, and 120 h under an Ar atmosphere. After milling, the stearic acid was burned off at 500 °C for 30 min for the subsequent sintering process. The ball-milled powder was sintered into a pellet using SPS (JM-SPS-025; Vacuum Science Laboratory, Seoul, Korea). The ball-milled powder was placed in a graphite mold with a 30-mm-diameter cylindrical inner cavity, and sintering was conducted at 800 °C for 10 min under a uniaxial pressure of 75 MPa and vacuum of 60 mtorr. Finally, the specimens were heat treated at 400, 600, and 1000 °C for 72 h using a laboratory chamber furnace (ECF 12/6; Lenton Furnaces Ltd., Hope Valley, UK) in air to investigate the microstructural and mechanical evolution after heat treatment.
Phase identification was performed on the ball-milled powders and the as-sintered and heat-treated HEAs using XRD (Smartlab; Rigaku, Tokyo, Japan) with Cu Kα radiation at 1.5406 Å. Field-emission SEM (Verios 460L, FEI, Hillsboro, Oregon) with EDS (EDAX-AMETEK, Mahwah, NJ) was used to observe the surface morphology and elemental distribution of the sintered HEAs. Microstructures of the HEAs were characterized using a high-resolution transmission electron microscopy (Tecnai G2 F20, FEI, Hillsboro, Oregon) system operated at 200 kV. The TEM samples were prepared using a dual-beam focused ion beam SEM (Helios NanoLab 650, FEI, Hillsboro, Oregon). To evaluate the mechanical property of the alloys, Vickers hardness tests (HM-200; Mitutoyo, Kawasaki, Japan) were performed on the fine-polished samples under an applied load of 0.5 kgf. The hardness and elastic moduli of the phases formed in the as-sintered sample were compared using in situ SEM picoindentation tests (PI-87; Hysitron Inc., Minneapolis, MN) with a cube-corner probe till an indentation depth of 700 nm. Compression tests were performed for samples with a size of 2 × 2 × 3 mm3 at a strain rate of 10−4 s−1 using a universal testing machine (RB Model 301 Unitech M; R&B Inc.).
Acknowledgment
This study was supported by the National Research Foundation (NRF) of Korea and funded by Ministry of Science, ICT (MSIT; 2013K1A4A3055679, 2015R1D1A1A01060718, 2015R1A5A7037615, 2016M2B2A9A02943809, and 2017M1A3A3A02015639).