Introduction
Body weight of farm animals, a composite of different anatomical parts of the animal, has been predicted from linear body measurements using regression analysis (Latshaw and Bishop, Reference Latshaw and Bishop2001; Olawoyin, Reference Olawoyin2007; Raji, Igwebuike and Usman, Reference Raji, Igwebuike and Usman2009; Udeh, Isikwenu and Ukughere, Reference Udeh, Isikwenu and Ukughere2011). The morphometric traits used for this purpose are carefully chosen based on their close association with one another and with body weight. The use of regression models does not only make on-farm determination of animal weight less tedious but also reduces the risk of hazards associated with the use of weighing scale especially in farm animals with large body size. Strong correlations between some linear body measurements and many production traits as well as qualities of carcasses in sheep have been documented (Otoikhian et al., Reference Otoikhian, Otoikhian, Akporhuarho and Isidahomen2008; Abdel-Moneim, Reference Abdel-Moneim2009).
Simple correlations between traits have commonly been used in the past; however, their suitability as a measure of degree of association between traits is enhanced when combined with path analysis. Yakubu and Mohammed (Reference Yakubu and Mohammed2012) opined that body measurements that are used to predict body weight may affect its determination directly and indirectly. Thus with the use of path analysis, the correlation coefficient between two characters is partitioned into direct (path coefficient) and indirect (effect exerted through other variables) portions. This provides an effective means of partitioning correlation coefficients into unidirectional path ways and alternate path ways, thus permitting a critical examination of specific factors that produce a given correlation; a standardized partial regression analysis that deals with a closed system of variables which are linearly related. Path analysis is very similar to multiple regression analysis, the critical difference between the two is that in the former the analytical model is built around specific causal relationships among linear measurements that determine body weight while the latter assumes a simpler causal relationship in which all linear measurements affect body weight. Even when predictor variables in multiple regressions have produced sufficiently high coefficient of determination (R 2) to justify the prediction of body weight, path analysis can provide guidelines about possible unmeasured predictor traits. The technique of path analysis in livestock experiments has been extensively used by Yakubu and Salako (Reference Yakubu and Salako2009); Ogah et al. (Reference Ogah, Yakubu, Momoh and Dim2011); Yakubu and Mohammed (Reference Yakubu and Mohammed2012). The objective of this study was to obtain a detailed relationship between body weight and some linear body measurements in West African Dwarf (WAD) sheep from Nigeria.
Materials and method
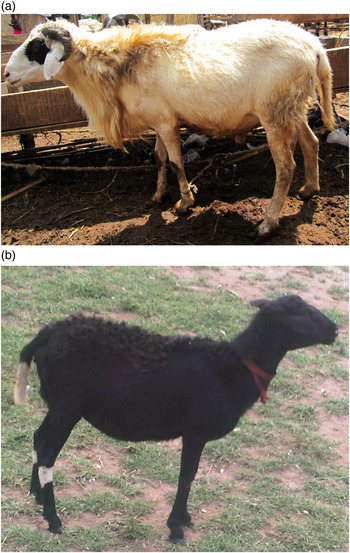
The study was carried out at the sheep unit of the teaching and research farm, University of Ibadan, Ibadan, Southwest Nigeria (Figure 1). Body weight and nineteen (19) linear measurements were taken from four hundred and seventeen (417) adult WAD sheep comprised of two hundred and one (201) rams, and two hundred and sixteen (216) ewes. Data were taken between August 2012 and May 2013. Although many of the sheep were purchased from pastoralists, they have been reared intensively in the teaching and research farm for a minimum of three months before measurements were taken. Pregnant, lactating and sick animals were excluded from the study. Body measurements were taken when the animals were in standing position with head raised and weight on all four feet without body movement. Animals were restrained physically to limit movement. Measurements were taken in the morning before feed was supplied giving a minimum of 16 h between feeding and weighing. Linear characters were measured with a measuring tape. The methods used for the measurements are as described by FAO (2012). Anatomic reference points for the measurements are as described by Searle, McGraham and Donnelly (Reference Searle, McGraham and Donnelly1989), and Salako and Ngere (Reference Salako and Ngere2002). Linear body characters considered were rump width (RW), rump length (RL), tail length (TL), wither height (WH),thorax depth (TD), shin circumference (SC), heart girth (HG), paunch girth (PG), rump height (RH), ear length (EL), fore-leg length (FLL), rear-leg length (RLL), body length (BL), shoulder width (SW), neck circumference (NC), head length (HL), head width (HW), hock length (Hock) and horn length (HoL for rams alone).
West African Dwarf (WAD) Ram (A) and Ewe (B), Teaching and Research Farm of University of Ibadan.

Means, standard deviation (SD) and coefficient of variation (CV) were determined for live weight and linear body measurements. A t-test was used to check whether morphometric characters between the two sexes were significantly different. Pearson correlation coefficients were calculated to determine the degree of association between the variables. Data were checked for multicollinearity and singularity. Compound linear regression was also performed, where partial regression coefficients were standardized. The standardized linear regression coefficient (path coefficient) shows the direct effect of linear measurements (X) on live weight (Y).
 $${\rm PY}.\,{X_{\rm i}} = {b_i}\, \displaystyle{{{\rm SD}{X_i}} \over {{\rm SD}Y}}$$
where PY.X i , path coefficient from X i to Y (i = HL, HW, HoL, EL, NC, HG, SW, TD, FLL, WH, Hock, BL, PG, RH, TL, RL, RLL, SC and RW); b i , unstandardized or partial regression coefficient; SDX i , standard deviation of linear measurements; SDY, standard deviation of live weight.
The indirect effects of X i on Y through X j were computed as
 $${\rm IEY}{X_i} = \lpar r{X_i}{X_j}P\rpar \, \lpar {\rm PY}.\,{X_j}\rpar$$
where IEYX i , correlation coefficient between ith and jth linear measurements; PY.X j , path coefficient that indicates the direct effect of jth linear measurement (exogenous variable) on live weight (endogenous variable).
The model for the multiple linear regression was
 $$Y = a + {b_ 1}{X_ 1} + {b_ 2}{X_ 2} + \cdots + {b_{ 19}}{X_{ 19}}$$
Y, body weight (dependent variable); a, intercept; b, standardized regression coefficient; X, exogenous variable (HL, HW, HoL, EL, NC, HG, SW, TD, FLL, WH, Hock, BL, PG, RH, TL, RL, RLL, SW and SC).
The significance of each path coefficient in the model was tested by the t-test procedure according to the method of Yakubu and Mohammed (Reference Yakubu and Mohammed2012)
 $${t_j}=\displaystyle{{{b_j} - {\beta _j}} \over {\sqrt {{\rm var}\lpar {b_j}\rpar } }}\,{\rm \sim }t\alpha \lpar n - p - 1\rpar \semicolon \; \quad j= 1\comma \; \, 2\comma \; \ldots {\rm\comma \; }\, p$$
where var(b j ), the diagonal member of matrix S 2 (X′X)−1; S 2, mean square of residual obtained from ANOVA.
Though partitioning of total coefficient of determination (R 2) into direct and combined effects of explanatory predictor variable is possible, the computation of combined effects will be ambiguous because of large number of predictor variables considered in this study. There are 171 combinations for 19 predictor variables (19C2). Thus, a pooled combined effect was generated
 $$\eqalign{{R^ 2}\, {\rm resulting}\, {\rm from}\, {\rm direct}\, {\rm effect}& = {P^ 2}Y.\,{X_ 1} + {P^ 2}Y.\,{X_ 2} \cr & \quad + {P^ 2}Y.\,{X_ 3} + {P^ 2}Y.\,{X_ 4} \cr & \quad + {P^ 2}Y.\,{X_ 5} + {P^ 2}Y.\,{X_ 6} \cr & \quad + {P^ 2}Y.\,{X_ 7} + {P^ 2}Y.\,{X_ 8} \cr & \quad + {P^ 2}Y.\,{X_ 9} + {P^ 2}Y.\,{X_{ 10}} \cr & \quad + {P^ 2}Y.\,{X_{ 11}} + {P^ 2}Y.\,{X_{ 12}} \cr & \quad + {P^ 2}Y.\,{X_{ 13}} + {P^ 2}Y.\,{X_{ 14}} \cr & \quad + {P^ 2}Y.\,{X_{ 15}} + {P^ 2}Y.\,{X_{ 16}} \cr & \quad + {P^ 2}Y.\,{X_{ 17}} + {P^ 2}Y.\,{X_{ 18}} \cr & \quad + {P^ 2}Y.\,{X_{ 19}}}$$
where, P 2 Y.X 1, direct effects of predictor variables (HL, HW, HoL, EL, NC, HG, SW, TD, FLL, WH, Hock, BL, PG, RH, TL, RL, RLL, SW and SC) in contributing to the variation of Y (body weight). Data were analysed with SPSS 15.0 while computation of path coefficients was done manually.
Results and discussion
Descriptive statistics for body weight and linear body measurements
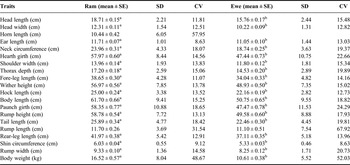
The difference in body weight means between rams and ewes was on average 5.91 kg (Table 1). The mean weight in this study was similar to the 15.28 kg found for rams and lower than the 15.90 kg for ewes reported by Yakubu (Reference Yakubu2010) for Yankasa lambs. There was significant sexual dimorphism in all traits considered (p < 0.05) except for length of rump. The means for linear body parameters in this study are similar to those reported by Yunusa, Salako and Oladejo (Reference Yunusa, Salako and Oladejo2013) for WAD sheep. The means of 58.35 ± 0.77 and 23.96 ± 0.31 cm obtained for paunch girth and neck circumference respectively are different from those of Yunusa, Salako and Oladejo (Reference Yunusa, Salako and Oladejo2013), and this may be explained by large environmental influences on these traits. Large coefficients of variation obtained for neck circumference (18.07 percent) and paunch girth (18.65 percent) may further suggest large environmental influence on these biometric traits (Table 2). Because of gut fill, the paunch girth of an animal depends on its feeding regime, and therefore is highly variable. Mane in the neck region, especially in WAD rams makes it a highly variable measure; there were large individual differences in the incidence and amount of mane. Thus, neck circumference in WAD rams is usually over estimated when mane is included. Although ewes do not have a mane, higher variability was obtained for them compared with rams. Height at wither obtained in this study for both sexes were lower than the 61.74 ± 0.29 cm reported by Salako and Ngere (Reference Salako and Ngere2002) for mature WAD sheep, although the authors did not indicate sex of the animals. Mean wither height of 57.97 ± 0.60 cm obtained for WAD rams in this study was closer to the mean the previous author reported. They also reported mean body length 62.56 ± 0.37 cm for WAD sheep which is similar to what we obtained. The sheep were found to be longer than they are tall. Coefficients of variation of 48.67 and 52.03 percent were obtained for body weight of rams and ewes, respectively. The reason for the large coefficients of variation is not clear. Body weight is the resultant of all component body parts; the large variability could have resulted from variability in gut fill since gut fill is a component of live weight. Within breed diversity has been reported for different breeds of sheep indigenous to Nigeria with the use of DNA markers (Agaviezor et al., Reference Agaviezor, Adefenwa, Peters, Yakubu, Adebambo, Ozoje, Ikeobi, Ilori, Wheto, Ajayi, Amusan, Okpeku, Onasanya, De Donato and Imumorin2012a, Reference Agaviezor, Peters, Adefenwa, Yakubu, Adebambo, Ozoje, Ikeobi, Wheto, Ajayi, Amusan, Ekundayo, Sanni, Okpeku, Onasanya, De Donato, Ilori, Kizilkaya and Imumorin2012b; Yunusa, Salako and Oladejo, Reference Yunusa, Salako and Oladejo2013), which suggest that many traits are still largely unselected for in these animals, thus confirming them as a valuable genetic resource.
Description of body weight and linear body measurements.

abMeans along same row with different superscripts are significantly different (P < 0.05).
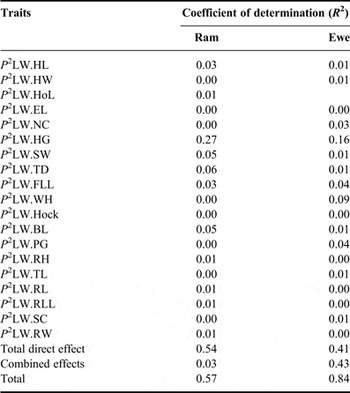
Direct and combined effects of the biometric traits.

P 2, square of path coefficient; HL, head length; HW, head width; EL, ear length; NC, neck circumference; HG, heart girth; SW, shoulder width; TD, thorax depth; FLL, fore-leg length; WH, wither height; Hock, hock length; BL, body length; PG, paunch girth; RH, rump height; TL, tail length; RL, rump length; RLL, rear-leg length; SC, shin circumference; RW, rump width.
Correlation between traits
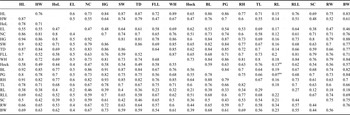
Correlations among body weight and linear body measurements of WAD rams and ewes are presented in Table 3. There were significant correlations (p < 0.05) between all pairs of traits in rams. The range of correlations between body weight and all linear body measurements was 0.227–0.726 in rams. In ewes, rump length showed insignificant (p > 0.05) correlation with both hock length and paunch girth, indicated that these traits are not associated. The range of correlations between body weight and all linear body parameters was 0.183–0.878 in ewes. The highest and lowest correlations were obtained for heart girth and rump length with body weight, respectively, in both sexes. High correlation of heart girth with body weight has been documented (Searle, McGraham and Donnelly, Reference Searle, McGraham and Donnelly1989; Afolayan, Adeyinka and Lakpini, Reference Afolayan, Adeyinka and Lakpini2006; Yakubu, Reference Yakubu2010). Afolayan, Adeyinka and Lakpini (Reference Afolayan, Adeyinka and Lakpini2006) reported that heart girth accounted for 90 percent of total weight variance in Yankasa sheep. There was no multicollinearity between traits in both sexes since the pilot analysis indicated that the value of variance inflation factor (VIF) was less than 10 and the tolerance (T) value was greater than 0.1 in all cases (Gill, Reference Gill1986; Pimentel et al., Reference Pimentel, Queiroz, Carvalheiro and Fries2007; Yakubu, Reference Yakubu2010).
Simple correlation analysis of body weight and linear body measurements with ewes above the diagonal and rams below.

ns: non-significantly correlation.
HL, head length; HW, head width; HoL, horn length; EL, ear length; NC, neck circumference; HG, heart girth; SW, shoulder width; TD, thorax depth; FLL, fore-leg length; WH, wither height; Hock, hock length; BL, body length; PG, paunch girth; RH, rump height; TL, tail length; RL, rump length; RLL, rear-leg length; SC, shin circumference; RW, rump width; BW, body weight.
Path coefficient
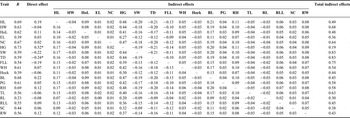
Path coefficients of the linear body measurements (independent variable) of WAD rams are presented in Table 4. Path analysis permits the partitioning of correlation coefficients into component parts (Marjanovic-Jeromela et al., Reference Marjanovic- Jeromela, Marinkovic, Mijic, Zdunic, Ivanovska and Jankulovska2008; Yakubu, Reference Yakubu2010). The path coefficients reveal both positive and negative direct effects of linear traits on body weight. In the rams, the highest significant direct effect of linear traits on body weight as indicated by the t-test was exhibited by heart girth (0.52) followed by thorax depth (−0.24). Though other linear characters with insignificant (p > 0.05) direct effects had high correlations with body weight, their indirect effect through heart girth were generally positive and high in magnitude. The highest indirect effect was obtained for head length through heart girth (0.483) which explains 70.51 percent of the correlation coefficient for association between head length and body weight. The highest and lowest single effects were exerted by heart girth (R 2 = 0.265) and head width (R 2 = 0.002), respectively. Path analysis principle states that the sum of determination coefficients and determination error is equal to 1 (Wu et al., Reference Wu, Ma, Tian, Wu, Li, Guan, Li and Wang2008; Yakubu, Reference Yakubu2010). In this study, the sum of determination coefficients of any predictor variable and combination of two predictor variables for rams ∑d = 0.574, thus the determination error (1 − ∑d) was 0.426. The pilot regression equation where all traits were considered in ram was:
Direct and indirect effect of linear body measurements on live weight of WAD rams.

*: Path coefficient significant at 0.05; **: Path coefficient significant at 0.01.
r, correlation coefficient; HL, head length; HW, head width; HoL, horn length; EL, ear length; NC, neck circumference; HG, heart girth; SW, shoulder width; TD, thorax depth; FLL, fore-leg length; WH, wither height; Hock, hock length; BL, body length; PG, paunch girth; RH, rump height; TL, tail length; RL, rump length; RLL, rear-leg length; SC, shin circumference; RW, rump width.
 $$\eqalign{{\rm BW = } & - 22{\rm .20 + 0}{\rm .19HL} - 0{\rm .04HW + 0}{\rm .11HoL} \cr & \quad + 0{\rm .03EL}{\rm .24NC + 0}{\rm .52HG} - 0{\rm .22SW} \cr & \quad - 0{\rm .24TD} - 0{\rm .19FLL + 0}{\rm .07WH} - 0{\rm .06Hock} \cr & \quad + 0{\rm .22BL + 0}{\rm .05PG + 0}{\rm .12RH} - 0{\rm .06TL} \cr & \quad - 0{\rm .08RL + 0}{\rm .09RLL + 0}{\rm .06SC + 0}{\rm .12RW}}$$
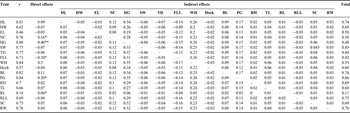
Path coefficients of the linear body measurements (independent variables) in WAD ewes are presented in Table 5. Heart girth had the most significant (p < 0.05) direct effect on body weight followed by fore-leg length, paunch girth, neck circumference and rump length in decreasing order of magnitude. Similar to that obtained in rams, the highest indirect effects were obtained for all linear characters through their relationship with heart girth. Paunch girth exerted the highest indirect effect (0.36) through heart girth which explains 44.14 percent of the correlation coefficient. The highest lone effect on body weight was exerted by heart girth (R 2 = 0.160).The determination error in ewes (1 − ∑d) was 0.159. The predictor variables in this study explain 84 and 57 percent of body weight in ewes and rams, respectively. High determination error in rams obtained in this study compared with ewes may be explained with two reasons, either there are some unmeasured linear traits in rams that explains the remaining 43 percent of body weight or linear body measurements are more useful in predicting body weight in ewes than rams. The pilot regression equation where all traits were considered in ewes was:
Direct and indirect effect of linear body measurements on live weight of WAD ewe.

r, correlation coefficient; HL, head length; HW, head width; EL, ear length; NC, neck circumference; HG, heart girth; SW, shoulder width; TD, thorax depth; FLL, fore-leg length; WH, wither height; Hock, hock length; BL, body length; PG, paunch girth; RH, rump height; TL, tail length; RL, rump length; RLL, rear-leg length; SC, shin circumference; RW, rump width.
 $$\eqalign{{\rm BW = } & - 22{\rm .20 + 0}{\rm .09HL} - 0{\rm .07HW} - 0{\rm .05EL} \cr & \quad + {\rm 0.16NC + 0}{\rm .40HG} - 0{\rm .07SW} - 0{\rm .08TD} \cr & \quad - 0{\rm .20FLL + 0}{\rm .30WH} - 0{\rm .04Hock + 0}{\rm .11BL} \cr & \quad + {\rm 0.20PG} + 0{\rm .02RH + 0}{\rm .07TL + 0}{\rm .06RL} \cr & \quad - 0{\rm .04RLL + 0}{\rm .75SC + 0}{\rm .76RW}}$$
Establishment of optimum multiple linear regression model
All predictor variables considered in rams except heart girth and thorax depth were statistically not significant (p > 0.05). This brought to light that these traits were not important in the estimation of body weight and were discarded. After the deletion of less important variables, the path coefficients of heart girth and thorax depth were 0.852 and −0.146, respectively, with R 2 of 0.533. The optimum regression model for WAD ram was BW = −22.71 + 0.85HG − 0.15TD.
Heart girth, neck circumference, fore-leg length, paunch girth and rump length were statistically significant in WAD ewes; the other predictor variables were discarded. The new path coefficients were 0.548, 0.228, −0.035, 0.219 and 0.059 for heart girth, neck circumference, fore-leg length, paunch girth and rump length, respectively. The optimum regression model for WAD ewes was BW = −13.36 + 0.55HG + 0.23NC − 0.04FLL + 0.22PG + 0.06RL with R 2 of 0.824. Heart girth was the most important trait for prediction of body weight both in rams (0.85) and ewes (0.55).The use of path analysis to explain the relationship between morphometric traits and body weight of sheep had been reported (Yakubu, Reference Yakubu2010). Although, the numbers of linear measurements considered in this study were more than what the author documented, however, heart girth was reported as the most important predictor variable with coefficients of 0.243 and 0.249 in male and female, respectively. The author further reported the highest indirect effects of both wither heights and body length on body weight, through their relationship with heart girth in both sexes. Lack of mane at the neck region in ewes may support the usefulness of neck circumference in the prediction equation. Ewes in this study have at least lambed once, the extension of abdominal region during gestation, which is not totally reversible, may support the significance of paunch girth in the optimal regression model.
Conclusion
All linear traits had significant correlation with body weight in both sexes. Heart girth had the highest correlations with body weight, both in rams and ewes. Although a large number of predictor variables were considered in this study, heart girth contributed the most to the coefficient of determination in both sexes. Predictor variables with insignificant path coefficients had high correlations with body weight; however, their indirect effects were obtained mostly via their relationship with heart girth.