INTRODUCTION
Watershed nitrogen (N) budgets are typically unbalanced. Jordan & Weller (Reference Jordan and Weller1996), Howarth et al. (Reference Howarth, Billen, Swaney, Townsend, Jaworski, Lajtha, Downing, Elmgren, Caraco, Jordan, Berendse, Freney, Kudeyarov, Murdoch and Zhao-Liang1996), Boyer et al. (Reference Boyer, Goodale, Jaworski and Howarth2002), Schaefer & Alber (Reference Schaefer and Alber2007) and Schaefer et al. (Reference Schaefer, Hollibaugh and Alber2009) showed that export of N from large rivers draining the US accounts for only 9–33% of the net anthropogenic N inputs (NANI) to their watersheds of 103–107 km2. This imbalance of anthropogenic N between inputs and outputs, which is called ‘the missing N’ (David & Gentry Reference David and Gentry2000), is usually considered to be the result of N stored within watersheds (groundwater, soil, plant biomass), or lost as N gases via denitrification or other dissimilatory biological processes (van Breemen et al. Reference van Breemen, Boyer, Goodale, Jaworski, Paustian, Seitzinger, Lajtha, Mayer, Van Dam, Howarth, Nadelhoffer, Eve and Billen2002).
The inability to balance N inputs and exports also occurs at smaller spatial scales. On the Mid-Atlantic Coastal Plain, Jordan et al. (Reference Jordan, Correll and Weller1997) calculated that only 15–30% of the net anthropogenic N load to agricultural watersheds <300 km2 was discharged in streams. In the Choptank River Basin, Lee et al. (Reference Lee, Fisher and Rochelle-Newall2001) showed that 20–90% of groundwater NO3 − in watersheds with drainage areas of <50 km2 appeared in baseflow. This imbalance between watershed N inputs and outputs over a broad range of spatial scales represents a fundamental gap in our understanding of watershed N biogeochemistry.
There are many processes which could be responsible for the missing N. These include errors in estimating NANI, e.g. NH3 volatilization (Langford et al. Reference Langford, Fehsenfeld, Zachariassen and Schimel1992), plant N uptake leading to organic N storage (Pessarakli Reference Pessarakli1999), accumulation of NO3 − in groundwater (Bohlke & Denver Reference Bohlke and Denver1995), denitrification and other biological processes leading to N2 production (Seitzinger et al. Reference Seitzinger, Harrison, Bohlke, Bouwman, Lowrance, Peterson, Tobias and Van Drecht2006; Burgin & Hamilton Reference Burgin and Hamilton2007), and nitrification and denitrification leading to N2O production (Groffman et al. Reference Groffman, Gold and Addy2000; Beaulieu et al. Reference Beaulieu, Tank, Hamilton, Wollheim, Hall, Mulholland, Peterson, Ashkenas, Cooper, Dahm, Dodds, Grimm, Johnson, McDowell, Poole, Valett, Arango, Bernot, Burgin, Crenshaw, Helton, Johnson, O'Brien, Potter, Sheibley, Sobota and Thomas2011).
Terrestrial denitrification is often associated with hydric soils. These are wet, usually hypoxic soils often found in wetlands and poorly drained uplands. Many areas with hydric soils are extensively ditched to improve drainage for anthropogenic land uses. Lee et al. (Reference Lee, Fisher and Rochelle-Newall2001) found that losses of nitrate from groundwater were associated with hydric soils and denitrification was inferred as the reason for the decreasing transfer of groundwater NO3 − to baseflow; however, no measurements were available.
These observations suggest that land areas with hydric soils and wetlands adjacent to N-rich agricultural areas could be hot spots for nitrogen (N2) and nitrous oxide (N2O) gas production. Wetlands by definition have soils with reduced levels of oxygen for at least a portion of the year, and wetlands that exist next to agricultural areas potentially have a substantial supply of N available. Although wetlands exist within watersheds in their natural state, they are also often constructed, restored and managed. A number of wetlands were studied within the Choptank River Basin (Denver et al. Reference Denver, Ator, Lang, Fisher, Gustafson, Fox, Clune and McCarty2014) to examine the denitrification process and the present paper summarizes the results with regard to the biogenic N gases, N2 and N2O.
The overarching hypothesis of the current research is that denitrification and other biological processes lead to N2 and N2O in excess of atmospheric equilibrium in soils, groundwater and streams. Measuring excess concentrations of N2 and N2O would be a first step towards quantifying their loss to the atmosphere, which might represent a significant proportion of the N budgets for some watersheds. If diffusive losses of biogenic N gases to the atmosphere are significant, then accumulation of biogenic N2 and N2O gases would be especially pronounced in diffusion-restricted groundwater and soils. Although N2 is likely to be the primary product of dissimilatory processes, the greenhouse gas N2O is a product of both nitrification and denitrification (Zumft Reference Zumft1997), and N2O should also accumulate in diffusion-restricted environments (e.g. Vilain et al. Reference Vilain, Garnier, Tallec and Tournebize2012).
There are several novel aspects to the present study. First, precise measurements of N2/argon (Ar) in soil gases in the vadose zone are provided, for which very few data are available. Secondly, a summary of excess N2, N2O, nitrate (NO3 −) and oxygen (O2) data in groundwater and their relationships across a broad range of wetland conditions is presented. Finally, dissolved O2 and NO3 − data from first- and second-order streams are presented with their relationships to dissolved excess N2.
MATERIALS AND METHODS
Study site description
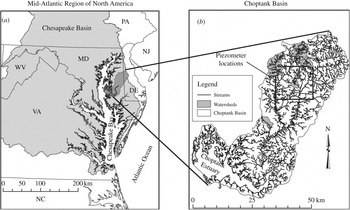
The Choptank River Basin (1756 km2) is located on the Delmarva Peninsula on the Mid-Atlantic Coastal Plain of North America (Figs. 1(a) and (b)). The Choptank River Basin lies within the Chesapeake Bay drainage area and has low topographic relief (<30 m asl) with partially incised, non-tidal, stream valleys and poorly drained, hydric soils. The stream valleys are typically forested in second and higher-order streams and are often ditched in first-order streams (Norton & Fisher Reference Norton and Fisher2000). The land use of the adjacent uplands was previously dominated by row crops, peaking in c. 1900, but in recent decades, farmland has been slowly converted to low-density residential and commercial use (Lee et al. Reference Lee, Fisher and Rochelle-Newall2001; Benitez & Fisher Reference Benitez and Fisher2004). The estuary of the Choptank Basin shows classic signs of eutrophication (turbid green surface waters, low bottom dissolved oxygen) due to increasing nutrient loading (Fisher et al. Reference Fisher, Hagy, Boynton and Williams2006, Reference Fisher, Jordan, Staver, Gustafson, Koskelo, Fox, Sutton, Kana, Beckert, Stone, McCarty, Lang, Kennish and Paerl2010).
(a) The Choptank River Basin lies within the eastern part of the Chesapeake Bay Basin and is on the mid-Atlantic Coastal Plain of North America. (b) The piezometer locations were in the non-tidal, freshwaters of the upper Choptank River Basin (large square), and the five small watersheds sampled for dissolved gases and nutrients are shaded. The vadose zone equilibration chambers were located in the Little Choptank River Basin, which lies south of the Choptank River basin.

Conceptual model
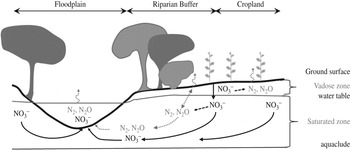
The accumulation of biogenic N2 and N2O was measured in the three land components that represent the majority of the watershed: (1) the vadose zone of soils, (2) groundwater and (3) streams. Below, a conceptual model is presented that describes N cycling in agricultural watersheds (Fig. 2).
Conceptual model of N cycling within agricultural watersheds. Data presented within this paper include N2/Ar in vadose zone gas and dissolved excess N2, N2O, O2 and NO3 − in groundwater and streams.

In all of the presented sub-watersheds in the Choptank River Basin, the major source of N was agriculture (Fisher et al. Reference Fisher, Jordan, Staver, Gustafson, Koskelo, Fox, Sutton, Kana, Beckert, Stone, McCarty, Lang, Kennish and Paerl2010). Manure, sludge and fertilizer (anhydrous ammonium, urea) are generally applied during the spring and early summer to enhance crop yields. In the vadose zone of soils, organic N and urea applied to the soil are subject to decomposition by soil microbes, resulting in production of ammonium (NH4 +). The ammonium is either taken up by plants or is nitrified by soil microbes and converted to NO3 − (Fig. 2). Nitrate may be taken up and stored by crops (Falkengren-Grerup Reference Falkengren-Grerup1995; Glass et al. Reference Glass, Britto, Kaiser, Kinghorn, Kronzucker, Kumar, Okamoto, Rawat, Siddiqi, Unkles and Vidmar2002), leached to groundwater during rain events, or biologically reduced to N2 and N2O by denitrifying organisms in hypoxic micro-environments within the soil (Mehnert et al. Reference Mehnert, Hwang, Johnson, Sanford, Beaumont and Holm2007). The N2 and N2O produced in the vadose zone can also be transported to groundwater by infiltrating rain, or released to the atmosphere by advective and diffusive processes.
Nitrate is the dominant form of N in groundwater because of the high mobility of NO3 − in soils. Groundwater NO3 − can be conserved or can be subjected to the same biological reduction to N2 and N2O that occurs in the vadose zone (Fig. 2). Nitrogen and N2O in groundwater either flows with the groundwater towards a surface water body such as a stream, or the gases may diffuse from groundwater into the vadose zone above (Fig. 2).
Biogenic N2 and N2O that enter streams will diffuse to the atmosphere through the stream surface. Nitrogen and N2O can also be produced within the stream ecosystem (especially the sediment layer); however, in accounting for the missing N, the location of N gas production does not matter.
Soil gas sampling
The N2/Ar and N2O data are presented from the vadose zone of a forested riparian buffer bordering an agricultural field sampled from 2008 to 2010. Soil gas samples were obtained using the 50 ml equilibrium chamber design of Silver et al. (Reference Silver, Lugo and Keller1999). Boreholes of 38 mm diameter were hand-augured for each equilibration chamber at 0·25 m depth intervals to 1·5 m in duplicate transects. The chambers were placed at the desired depth with the stopcock protruding 0·1–0·2 m above the soil surface. The soil horizons were backfilled in approximately the same order in which they were removed, and the soil was allowed to settle for several weeks prior to sampling.
Gas samples were obtained in 60 ml syringes. One full syringe volume was removed through the stopcock to ensure adequate flushing of the tubing and stopcock, and then the syringe was refilled to inject 15 ml of sample into 12 ml evacuated Exetainers®, High Wycombe, UK, deliberately overpressurizing to exclude exchange with the atmosphere. Field air standards were taken similarly. Samples were processed by capillary inlet mass spectrometry (CIMS, see below) within 2 days.
Groundwater sampling
Data are presented on excess N2, N2O and nutrients in 46 groundwater piezometers over six sites within the upper Choptank River basin in 2008/09. Groundwater in the unconfined surface aquifer was monitored by installation of c. 50 mm internal diameter polyvinyl chloride (PVC) pipes with a 0·3 m screen at the bottom to allow inflow of groundwater. Boreholes were manually augured to depths of 2–4 m. After installation, the piezometers were pumped dry 2–3 times over several weeks to flush and refill the piezometers with local groundwater prior to sampling. The piezometers protruded 0·2–0·5 m above the ground and were closed with a removable cap.
Groundwater was sampled for gas analyses with minimum exposure to the atmosphere at approximately monthly intervals in 2008/09. On the day prior to sampling, the groundwater depth was manually recorded using a water level indicator (Solinst model 101M, Georgetown, Canada), and then the piezometers were pumped out using a peristaltic pump (Solinst model 410, Georgetown, Canada). To minimize contact between inflowing groundwater and air within the piezometer, a float with a diameter of c. 50 mm was lowered to the bottom of the piezometer following pump out.
The day following pump out, the float was removed and the freshly recharged groundwater within the piezometer was immediately sampled using a Teflon bailer with external diameter of c. 45 mm (Fisher et al. Reference Fisher, Jordan, Staver, Gustafson, Koskelo, Fox, Sutton, Kana, Beckert, Stone, McCarty, Lang, Kennish and Paerl2010). Groundwater samples were transferred to 29 ml ground glass-stoppered tubes or 22 ml tubes with rubber septa with at least one volume of overflow to reduce air exposure and eliminate bubbles. The tubes were stored in ice to prevent bubble formation until analysis by gas chromatography or membrane inlet mass spectrometry (MIMS, see below) in the next 1–3 days. Samples for nutrient analyses (NH4 +, NO3 −, phosphate ions (PO4 3−)) were collected in 250 ml pre-cleaned plastic bottles and stored on ice until the end of the sampling day. In the laboratory on the next day, samples were filtered through glass fibre filters (0·7 nm nominal porosity) and frozen for up to a month, before automated colorimetric analyses (Fisher et al. Reference Fisher, Jordan, Staver, Gustafson, Koskelo, Fox, Sutton, Kana, Beckert, Stone, McCarty, Lang, Kennish and Paerl2010; Sutton et al. Reference Sutton, Fisher and Gustafson2010).
Stream sampling
Streams were sampled for N2, Ar, O2 and nutrients in autumn 2009, spring 2010 and summer 2010 within five small watersheds (5–20 km2), dominated by agriculture, within the upper Choptank River Basin (Fig. 1(b)). Collections were made at 105 stream/road crossings. All of the streams within a watershed were sampled throughout the course of the same day for N2, Ar, O2 and nutrients. Stream-dissolved gas samples were collected with minimal air exposure by inserting a 0·4 m piece of tubing (internal diameter 2 mm) to the bottom of a 27 ml glass tube, and the tube and tubing were inserted upside down into the stream water. The tubing acted as a vent to allow air to exit the glass tube as the water rose within it. After the glass tube was filled, the tubing was removed and the glass tube was capped underwater. Samples were placed in ice water to prevent bubble formation and were processed by MIMS within 1–3 days. Additional samples were placed in plastic bottles for colorimetric chemistry (NH4 +, NO3 −, PO4 −3), as described above.
Gas analyses
The stream- and groundwater-dissolved gases N2, O2 and Ar were analysed by MIMS (Kana et al. Reference Kana, Darkangelo, Hunt, Oldham, Bennett and Cornwell1994) in quadruplicate with a precision of 0·2%. Deionized water standards were equilibrated with air at observed sample temperatures. The concentrations of Ar were used to estimate recharge temperature using an inverted solubility curve (Colt Reference Colt1984; Bohlke & Denver Reference Bohlke and Denver1995; Fisher et al. Reference Fisher, Jordan, Staver, Gustafson, Koskelo, Fox, Sutton, Kana, Beckert, Stone, McCarty, Lang, Kennish and Paerl2010), and the Ar recharge temperature was used to estimate the background N2 and O2 concentrations assuming air saturation at the recharge temperature. An N2 concentration greater than the background N2 was considered as excess N2 and expressed as N2-N for the direct comparison with NO3 −-N. An O2 level less than saturation was considered as deficit O2 and was expressed as % saturation (100× observed O2/saturation O2).
Dissolved N2O was analysed in duplicate using a Shimadzu GC-14B gas chromatograph equipped with a HayeSep Q column (Sigma-Aldrich, Saint Louis, USA) and an electron capture detector. Gas standards with known N2O concentrations were used to establish the linear range of the instrument with each group of samples. For water samples, 8 ml aliquots were injected in duplicate into vented 12 ml Exetainers® (High Wycombe, UK), previously purged with N2. Vials were shaken manually and vigorously for 2 min, and allowed to sit at the room temperature for at least 30 min to ensure full equilibration of the N2 headspace and water aliquots. Then 0·1 ml of head space gas was injected into the injection port, and sample concentrations were corrected for sample and Exetainer® volumes, pressure, temperature and solubility to standard temperature and pressure conditions.
High precision N2/Ar measurements of vadose gases were done using CIMS. The inlet consisted of a 90 cm length of SGE© (Austin, TX, USA) fused silica capillary tubing attached to a Swagelok® (Solon, OH, USA) reducing union which served as a sample reservoir. The reducing union was partially filled with epoxy to reduce the internal inlet volume to 0·6 ml. An Exetainer® (High Wycombe, UK) septum sealed the reducing union from the atmosphere and allowed injection of 0·6 ml of sample gases into the inlet system. A valved two-stage rotary vane pump was used to evacuate samples from the inlet system, and the capillary tube coming from the inlet was thermally stabilized at 50 °C using a water bath. On the vacuum side, the sample passed across 600 °C copper to eliminate O2, followed by a liquid N cryotrap to eliminate CO2 and water vapour prior to entering the quadrapole mass spectrometer (QMS). The QMS monitored the mass-to-charge ratio (m/e) peaks at 14, 28, 32, 40 and 44. The N2/Ar was determined from the ratio of 14/40, and the m/e 14 peak (N+) was used in place of the m/e 28 peak (N2 +) as a measure of N2 gas to avoid interference from trace amounts of CO2 which generates the fragment CO+ with the same m/e as N2 +. A two-sided t-test was performed between N2/Ar measured in the triplicate soil sample gas tubes and standard field air tubes. If the sample gas N2/Ar was not significantly different from the N2/Ar of the field air, then the ratio was reported as 83·60, the atmospheric N2/Ar (the atmospheric composition of N2 divided by the atmospheric composition of Ar, 0·7808/0·009340). If the sample was significantly different from the standards, the sample 14/40 was scaled to atmospheric N2/Ar according to:
 $$\displaystyle{{{\rm N}_2} \over {{\rm Ar}}} = \left( {\displaystyle{{(({\rm m/e}\_14)/({\rm m/e}\_40))_{{\rm sample}}} \over {(({\rm m/e}\_14)/({\rm m/e}\_40))_{{\rm std}}}}} \right) \times 83.60$$
Further details are given in Fox (Reference Fox2011).
RESULTS
Nitrogen/argon measurements in soil gases
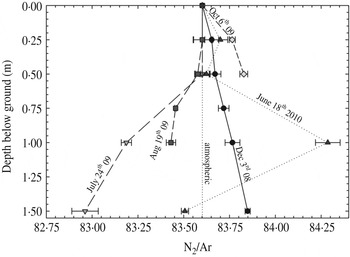
Vadose zone N2/Ar measurements were made to infer biological N2 contributions to the N2 gas pool in soils. In the vadose zone samples, N2/Ar values above, below and equivalent to atmospheric N2/Ar values (83·60) were measured. Values greater than atmospheric levels ranged from 83·65 to 84·57, and values less than atmospheric ranged from 82·80 to 83·55. Typically, all of the N2/Ar ratios within an individual soil profile were either indistinguishable from atmospheric or consistently above or below the atmospheric ratio (Fig. 3). The N2/Ar soil profiles in the riparian buffer appeared to follow a seasonal cycle related to groundwater temperature, which undergoes an annual sinusoidal variation with a minimum value in early March and a maximum temperature in late September to early October (Fisher et al. Reference Fisher, Jordan, Staver, Gustafson, Koskelo, Fox, Sutton, Kana, Beckert, Stone, McCarty, Lang, Kennish and Paerl2010). The N2/Ar values were below the atmosphere ratio when groundwater was warming from March to September, and vadose N2/Ar was greater than atmospheric when groundwater was cooling from October to March (Fig. 3). The water table typically intersects the soil surface in January–May at this location, precluding vadose sampling at this time of year. An exception to this seasonal pattern was the June 2010 peak in N2/Ar at 1·0 m (Fig. 3, black triangles), where peaks in CO2 (2954 μm) and N2O-N (0·19 μm) were also observed, suggesting that the peak in the N2/Ar ratio at 1 m depth was at least partially due to biogenic N2.
Vertical profiles of N2/Ar in vadose zone gases averaged between two transects obtained in a forested riparian buffer.

Nitrogen and nitrous oxide in groundwater
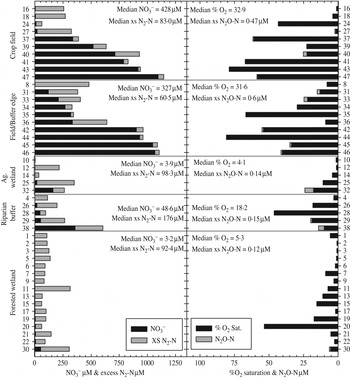
Measured excess N2 concentrations varied spatially, but there was dissolved excess N2 in groundwater at nearly all sampling locations (Fig. 4). In general, the highest NO3 − and % O2 values and lowest excess N2 concentrations were associated with crop fields (Fig. 4). However, variability existed within land uses due to other factors such as soil type or water content. Piezometers 16, 18 and 24 were either located within agricultural wet spots or were situated within fields with heavier soils, explaining their lower NO3 − and higher excess N2 concentrations. The highest excess N2 concentrations were found in piezometers with % O2 values under 20% in close proximity to agriculture (e.g. agricultural wetlands, riparian buffers and sometimes agricultural/buffer edge, Fig. 4.). The highest excess N2 concentrations were measured at an agricultural/hydrologically restored wetland border, i.e. site 8 (Fig. 4). The median of excess N2 measurements taken monthly in 2008/09 was 484 μm N2-N, and the highest individual measurement, taken in April 2010, was 616 μm N2-N, which represents a 53% increase in N2 over the background concentration in equilibrium with air. Forested wetlands had low NO3 − due to a lack of connectivity to agriculture, low % O2 saturation and moderate excess N2. This relatively low excess N2 may have been partly due to excess air that was formed after air bubbles trapped within the soil were forced into solution by hydrostatic pressure (Ingram et al. Reference Ingram, Hiscock and Dennis2007) because no NO3 − source, other than atmospheric deposition and internal N recycling, was present.
The median concentrations of NO3 − and excess N2-N (left panel) and % O2 saturation and N2O-N (right panel) for individual piezometers sorted by land use and ranked by NO3 − concentration within each land use (1 is lowest, 47 is highest) in 2008. Each number on the Y-axis corresponds to a specific piezometer. Gas concentrations within piezometers were not typically normally distributed and are therefore reported as median values. Ag wetland piezometers were within restored riparian or wetland locations and were situated within standing water for the majority of the year. Thirteen piezometers (all forested wetland sites except piezometer 24) had close to zero N2O and therefore were not sampled consistently for N2O.

Concentrations of N2O in groundwater also varied throughout the sampling locations, from undetectable to 75 μm N2O-N. Typically, N2O concentrations represented <1–10% of measured excess N2 values (Fig. 4). However, there were exceptions, and the N2O concentration in December 2008 was approximately equal to the N2 concentrations at a hydrologically restored wetland site, i.e. site 10 (Fig. 4) where N2O was 75 μm N2O-N and excess N2 was 76 μm N2-N. The median excess N2 value at this site was very low due to high methane (CH4) concentrations that caused CH4 ebullition and the stripping of dissolved N2, N2O and Ar (Fisher et al. Reference Fisher, Jordan, Staver, Gustafson, Koskelo, Fox, Sutton, Kana, Beckert, Stone, McCarty, Lang, Kennish and Paerl2010). These data, therefore, represent an underestimate of the N2 and N2O concentration in the absence of ebullition.
Nitrogen in stream water
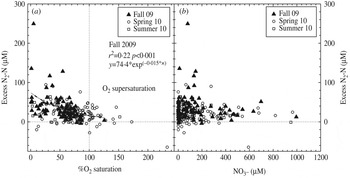
Gaining streams or streams that gain discharge through groundwater inflow are a focal point for emerging groundwater and are a potential location of high N2 and N2O fluxes to the atmosphere. The groundwater emerging into streams integrates the effects of large land areas, over different time periods (years to decades, Fisher et al. Reference Fisher, Jordan, Staver, Gustafson, Koskelo, Fox, Sutton, Kana, Beckert, Stone, McCarty, Lang, Kennish and Paerl2010) and various land uses (primarily agriculture and forest in the Choptank watersheds). At most stream sampling locations, N2 concentrations exceeded the equilibrium concentration for the temperature at which the observed Ar concentration was in equilibrium (Fig. 5). Excess N2 concentrations ranged from 1·8 to 250 μm N2-N. Deficits in N2 concentration also occurred, with concentrations expressed as negative values ranging from −0·2 to −65 μm N2-N. The % O2 saturation typically ranged from 1 to 100%, but in spring 2010 O2 super-saturation was observed ranging from 100 to 233%, probably due to diurnal temperature variations and in-stream photosynthesis. Excess N2 concentrations were inversely related to % O2 saturation over all sampling periods, but the relationship was particularly evident in autumn 2009 (Fig. 5(a)). Nitrate concentrations in these streams ranged from undetectable to c. 1 mm, and the highest excess N2 values were observed with NO3 − concentrations less than 200 μm (Fig. 5(b)).
Dissolved excess N2-N and % O2 saturation (a) and excess N2-N and NO3 − (b) measured in flowing streams throughout five small watersheds in the upper Choptank River Basin.

DISCUSSION
Accumulations of excess N2 were observed in nearly all of the stream and groundwater sampling locations. Within the vadose zone, N2 and Ar concentrations can be increased or decreased by abiotic processes such as seasonal temperature change in groundwater and soils, and N2 can be affected by biotic processes. Furthermore, increases in N2/Ar measured along with parallel increases in N2O and CO2 suggest the presence of biogenic N2. The large excess N2 and N2O concentrations observed in groundwater are temporarily stored and will eventually escape to the atmosphere through the soil or through groundwater inflow to streams. The current data provide evidence of significant accumulations of N2 in groundwater and stream water. These data describe field observations that will be used elsewhere to test the hypothesis that the majority of the missing N is caused by the loss of biologically produced N2 and N2O within watersheds.
Soil gas nitrogen/argon measurements
Few measurements of gaseous N2/Ar ratios in soils exist in the literature. Green et al. (Reference Green, Fisher and Bekins2008) presented a single profile of N2/Ar measurements taken from a riparian zone in Nebraska: they not only measured vadose gas N2/Ar values equivalent to the atmospheric ratio within analytical error in the top 7 m of the soil, but also observed an above atmospheric N2/Ar value at 20 m soil depth, just above the water table. Green et al. (Reference Green, Fisher and Bekins2008) suggested that this increase could potentially be due to denitrification near the water table, and they had additional supporting evidence that denitrification was occurring in the saturated zone slightly below the sampler. However, an above atmospheric N2/Ar value in vadose zone gas could also be due to an abiotic process such as cooling groundwater differentially absorbing Ar from the vadose zone gas.
It is clear that measured N2/Ar values are affected by both abiotic and biotic processes. Yang & Silver (Reference Yang and Silver2012) calculated the effect of three abiotic processes that affect N2/Ar values measured within a surface flux chamber on top of a sand diffusion box. Detection of N2/Ar changes within their soil chamber required use of a stable isotope mass spectrometer to achieve sufficient precision (1 part in 106). In contrast, the current measurements of N2/Ar within the soil can be made with sufficient precision (1 part in 104) using a quadrupole mass spectrometer because N2 and Ar in soil can build to higher concentrations since diffusion is restricted due to the increased diffusional pathways created by partially water-filled pores. The next step in this research effort is to look for evidence of other abiotic processes affecting the N2/Ar ratio, and to model these processes to distinguish biogenic N2 from abiogenic N2.
Groundwater nitrogen and nitrous oxide concentrations
Large excess N2 and N2O concentrations were measured in groundwater under different land uses in the upper Choptank River Basin. These measurements indicate that denitrification or other biological processes within the soil produce N2 and N2O that accumulate to significant concentrations within groundwater in excess of atmospheric equilibrium. Groundwater movement is slow, and accumulated N2 and N2O concentrations are temporarily stored prior to dispersion to the atmosphere either through soil or stream surfaces. Although N2 and N2O accumulations in excess of atmospheric equilibrium may result from biotic processes, N gas accumulation may also result from abiotic processes such as diurnal or seasonal temperature changes or excess air due to gas bubble dissolution into groundwater (see below). A primary source of abiotic excess N2 is the seasonality of groundwater recharge, which primarily occurs at cooler temperatures (October–April) when evapotranspiration is low (Fisher et al. Reference Fisher, Jordan, Staver, Gustafson, Koskelo, Fox, Sutton, Kana, Beckert, Stone, McCarty, Lang, Kennish and Paerl2010). This results in excess N2 in groundwater because of the higher solubility of gas at lower temperatures and the seasonal warming of the groundwater in spring. In the current paper, the calculations of excess N2 in groundwater and streams based on dissolved Ar concentrations account for this effect by referencing the data to an apparent recharge temperature based on Ar concentrations. Nevertheless, upward diffusion of the abiogenic excess N2 in groundwater appears to influence the N2/Ar that was measured in the vadose zone.
Excess N2 concentrations in groundwater can also result from air bubble entrapment and dissolution (Vogel et al. Reference Vogel, Talma and Heaton1981) during seasonal changes in groundwater level (Ingram et al. Reference Ingram, Hiscock and Dennis2007). In the data presented above, the assumption was made that N2 concentrations greater than equilibrium with air at the recharge temperature are due to denitrification. However, there are documented measurements of elevated N2, Ar or other noble gas concentrations due to excess air entrapment below the water table (Wilson & McNeill Reference Wilson and McNeill1997; Ingram et al. Reference Ingram, Hiscock and Dennis2007). Air bubble entrapment and dissolution increases both the N2 and Ar concentration; however, because N2 is relatively less soluble than Ar (Colt Reference Colt1984), relatively more N2 than Ar is forced into solution in groundwater by bubble dissolution under pressure compared with atmospheric equilibrium. In order to estimate biogenic excess N2, excess air measurements must be made using other noble gases such as neon (Ne) and xenon (Xe, Aeschbach-Hertig et al. Reference Aeschbach-Hertig, Peeters, Beyerle and Kipfer1999, Reference Aeschbach-Hertig, El-Gamal, Wieser and Palcsu2008). Although a portion of the excess N2 that was observed in groundwater may be due to excess air, Ingram et al. (Reference Ingram, Hiscock and Dennis2007) reported values of abiogenic excess N2 due to excess air ranging from 110 to 188 μm N2-N. Preliminary estimates of N2 from excess air range from 0 to 166 μm N2-N (R. C. Hamme & T. R. Fisher, unpublished). Biogenic excess N2 is still likely to be occurring at most sampling locations, although excess air might be responsible for most of the excess N2 signal at certain locations (e.g. forested wetland sites).
Nitrogen concentrations in streams
It was surprising to find widespread accumulations of excess and deficit N2 concentrations within streams. Not only were excess concentrations present, sometimes these concentrations were 20% greater than background values. Deficit N2 concentrations were also observed, which (expressed as negative values) were as great as −65 μm N2-N. These N2 deficits are not likely to be due to biological N-fixation, which would be inhibited at the relatively high concentrations of dissolved inorganic N in the streams. Nitrogen can be stripped from groundwater by ebullition of biogenic CH4 (Fisher et al. Reference Fisher, Jordan, Staver, Gustafson, Koskelo, Fox, Sutton, Kana, Beckert, Stone, McCarty, Lang, Kennish and Paerl2010) or potentially by O2 ebullition in streams, which might also remove N2 from stream water.
Fluctuations in water temperature may be a primary driver for the lack of gas equilibrium. The temperature of streams fluctuated significantly on sunny days. All of the streams within one watershed were purposely sampled on the same day to try to eliminate differences due to weather (e.g. rainfall, discharge etc.). However, throughout the time spent sampling in the field, stream temperatures within a single watershed varied as much as 12 °C, and air temperature fluctuated by as much as 10 °C. Solubility of gases in water varies substantially over a 12 °C range. For example, using data from one of the sampling days, at 11 °C dissolved N2 at equilibrium with air is 1269 μm N2-N, and at 23 °C it is 1008 μm N2-N (Colt Reference Colt1984). However, the measurements of excess N2 are not as sensitive to temperature change as is the absolute N2 concentration because excess N2 was calculated as the amount in excess of the N2 expected in equilibrium at the temperature at which the observed Ar would be in equilibrium. Regardless, the temperature driven changes in N2 and Ar solubility and rates of exchange with the atmosphere lead to diurnal changes in excess N2. Thus, a measurement of excess N2 in stream water at one time of day is not sufficient to calculate the flux of biogenic N2 to the atmosphere. To account for diurnal stream temperature changes, the research group is currently using an approach similar to McCutchan et al. (Reference McCutchan, Saunders, Pribyl and Lewis2003) to measure biogenic N2 fluxes from streams based on time series of dissolved gas concentrations over 6–24 h. Most previous studies using this approach have focused on measuring N2 production in streams with small or negligible amounts of groundwater input (Laursen & Seitzinger Reference Laursen and Seitzinger2004). In contrast, the research group responsible for the present paper is studying streams with significant influx of groundwater containing excess N2. Current measurements integrate fluxes of N2 (and N2O) produced over a wide area with multiple land uses and varying soil properties, and preliminary estimates indicate that streams are hot spots of biogenic N2 loss to the atmosphere.
CONCLUSIONS
Watershed N budgets are unbalanced; up to 91% of NANI is missing in stream/river output (Schaefer & Alber Reference Schaefer and Alber2007; Schaefer et al. Reference Schaefer, Hollibaugh and Alber2009). This paper presented the first seasonal vadose zone N2/Ar values measured using a QMS, and vadose N2/Ar profiles show evidence of both biotic and abiotic influences that must be separated to isolate biogenic N2. Significant accumulations of excess N2 and N2O were measured in groundwater at most sampling locations throughout the upper Choptank River Basin. Nitrous oxide concentrations in groundwater can be high, but N2O is <1–10% of excess N2. Therefore, N2O losses are not likely to be a significant portion of watershed N budgets, although N2O loss to the atmosphere from agriculture is a significant contributor to global climate change. Both excess and deficit N2 concentrations were measured in streams which are affected by abiotic processes such as diurnal stream temperature changes. The next step for the current authors is to use these data to make estimates of stream and soil N gas fluxes to the atmosphere and expand our sampling frequencies and distributions in order to estimate biogenic N2 and N2O loss at the watershed scale.
We thank Joe Miklas, Alley Bullock, Nancy Goff, Katie Bentley, Lindsay Tempinson, Shadaesha Greene and Whitley Gilbert for collection of stream and groundwater samples. We also thank Dana Brenner, Karen Knee and John Gardner for additional laboratory and field support. Dana Bunnell-Young created Fig. 2. Financial support was provided by the USDA Cooperative State Research, Education, and Extension Service (CSREES, 2005-35102-16299 to TRF, 2008-51130-04898 to TRF) and NSF Ecosystem Studies Programme (DEB-091981 ARRA to TRF, DEB-091941 ARRA to TEJ and DEB-1252923 to TRF and RJF). RJF was additionally funded by a grant from the Washington D.C. Explorers Club for Exploration and Field Research, the University of Maryland Graduate Student Summer Research Fellowship and the Horn Point Laboratory Education Fund. This is University of Maryland Center for Environmental Science contribution number 4871.