In 1787, three years after the Treaty of Paris ended the Revolution, the founding fathers crafted a new constitution. This U.S. Constitution, ratified by the states and then adopted by Congress in 1789, united the states into one country both politically and economically to a greater extent than what had existed under the preceding Articles of Confederation or under British rule prior to 1776. It required state governments to relinquish their sovereign power to place revenue-generating duties on commerce with other states and foreign nations, as well as relinquish their sovereign power to emit fiat paper monies and determine what could be legal tender within their jurisdictions. The Constitution also required national tariffs on imports from outside the United States to be uniform across the states and prohibited export tariffs (Article 1, Sections 8, 9, and 10). In short, it swept away trade barriers, both real and monetary, between the states and did so with constitutional force and certainty. It made the United States a common market.
Today, we enjoy the fruits of integrated national markets and look back to the Constitution as the watershed institutional change that created those markets.Footnote 3 But did it really? How much extra economic integration was gained by adopting the Constitution—a lot, a little, or next to nothing? Did it represent a discrete break in the economic integration of the nation? To answer such questions, the economic integration among the states soon after the adoption of the Constitution should be measured against the economic integration that would have occurred under the next best institutional alternative to the Constitution regarding interstate trade rules.
FINDING A BENCHMARK FOR COMPARISON
If the United States had not adopted the Constitution exactly as written, what would have been the alternative? It is abundantly clear in the writings of the day that something was going to be changed in the 1780s; either the Articles of Confederation would be amended or some new constitution adopted. One significant impediment to the ratification of the Constitution was the degree by which it restricted state economic sovereignty.Footnote 4 Thus, if the founding fathers had offered a constitution in 1787 in all other respects exactly like the one actually written but with fewer restrictions on state economic sovereignty, it would have likely been ratified as well. Because such was considered at the Constitutional Convention in the summer of 1787, the prior drafts that offered different interstate trade rules can serve as an approximate identifier of a likely alternative constitution with respect to such rules and their effect on economic integration.Footnote 5
Regarding interstate trade rules, how did these early drafts differ from that eventually adopted? The first complete working draft of a constitution, which incorporated the convention's deliberations from May 25th through August 6th, stated, “No State, without the consent of the Legislature of the United States, shall … lay imposts or duties on imports …”Footnote 6 No other restrictions on state trade powers were stated. Only near the end of the convention on August 28th was the Constitution amended to restrict states from imposing export duties without congressional consent and, more importantly, amended to absolutely stop states from keeping any revenue from state duties on imports and exports. At the convention, James Madison considered this last restriction as effectively eliminating all state tariffs.Footnote 7 By contrast, the prior drafts basically replicated the colonial system with Congress replacing the British Board of Trade. While Congress, like the British Board of Trade, was given oversight power—the right of consent to state tariff legislation, states under these prior drafts enjoyed considerable latitude over instituting their own revenue-generating tariff policies just as their colonial antecedents had. With regard to state monetary powers, the convention's Committee of Detail (July 17th through August 4th) came close to adopting the colonial monetary system.Footnote 8 State legislatures could issue fiat paper money as long as Congress did not disallow such actions—much like what the British Board of Trade could do during the colonial period. States could determine legal tender within their jurisdictions at least for public debts, but could not determine legal tender in their dealings with the national government or in cross-state trade—again much like what the British Currency Acts in the late colonial period achieved. It was only near the end of the convention that this position was completely overturned and a no-exceptions ban on anything resembling the colonial monetary system was adopted. Supporters argued that this change would increase interstate economic integration. For example, during the ratification debates Madison argued, “Had every State a right to regulate the value of its coin, there might be as many different currencies as States; and thus the intercourse among them would be impeded …”Footnote 9
While the actual economic integration of the nation in the decades soon after the adoption of the Constitution can be measured, what that integration would have been under the next most likely alternative constitution cannot be directly measured because such is a hypothetical counterfactual world. A real world alternative that can be measured needs to be found to serve as a proxy for that counterfactual world. The degree of market integration observed among the colonies in the decades prior to the Revolution is not only the closest proxy that can be found, but their institutional constraints closely match what the early drafts of the Constitution at the 1787 Convention would have created with respect to interstate trade rules—with Congress replacing the British Board of Trade with regard to oversight powers on these matters.
So How Much Economic Sovereignty Did the Colonies Exercise over Their Borders?
The colonies were more or less free to pass laws regulating their own trade including placing revenue-generating tariffs on imports and exports that crossed their borders. They were also free to create inside fiat paper monies that could be, only within their jurisdictions, accepted as a legal tender for various subsets of transactions, such as paying local taxes. To varying degrees, many enacted and carried out such laws. They faced oversight by the British Board of Trade, but nothing near the absolute restrictions imposed on the states by the U.S. Constitution. Colonies placed revenue-generating import and export tariffs on all sorts of goods that crossed their borders, including most of the primary goods included in the price indices used below. For some colonies, these duties represented a substantial portion of that government's revenue, whereas for others they represented next to nothing. Colonies did not impose the same duties on the same products, altered their duties from year to year on some products, and were able occasionally to impose duties on goods imported from neighboring colonies. Differential tonnage duties were also imposed. Some colonies had excise (sales) taxes on products not produced in their colony which was functionally equivalent to placing an import tariff on said goods. Prohibitive tariffs, however, were not observed. Finally, some colonies imposed non-tariff trade regulations, such as inspection rules, that varied over time.Footnote 10
The exercise of sovereign power by individual colonies over the trade that crossed their borders had some constraints. First, colonial laws had to be approved by the British Crown—in the late colonial period via the Board of Trade—with the exception of Connecticut and Rhode Island whose laws were not subject to Crown review. The board typically let colonial trade laws stand except for a few of the most egregiously disruptive. For example, when New York tried to impose a 10 percent tariff upon goods imported from neighboring colonies the Crown disallowed it. Oliver Dickerson concluded that “The policy of the board on the subject of intercolonial commerce is … clear …, although there are fewer instances of its use. The few instances of action, however, were effective in preventing the growth of discriminating trade laws” within the empire. Yet, a number of revenue-generating duties imposed by one colony on another can be documented to have been not disallowed by the board or not disallowed in a timely fashion.Footnote 11
Second, import and export duties affecting neighboring colonies faced retaliatory actions that often led to their removal or alteration. For example, New Hampshire's export duty on lumber prompted Massachusetts to retaliate by imposing duties on the importation of New Hampshire merchandise, which in turn led New Hampshire to repeal its export duty on lumber. Pennsylvania imposed reciprocal duties on goods imported from New York and Maryland that would remain in force until its neighboring colonies removed their comparable duties. To what extent these two constraints mitigated trade barrier creation between colonies and stopped markets from being poorly integrated is an empirical matter that will be estimated below.Footnote 12
The colonies also exercised considerable sovereign power over their own monetary policies. They were allowed to issue their own fiat paper currencies, which at various times some did and some did not. The amounts issued, the timing of emissions, and their backing or redemption structures, along with their exchange rates to sterling, were allowed to and did vary considerably from colony to colony. There was little coordination of monetary policy across the colonies and no ability by colonies to enforce a fixed exchange rate between fiat currencies and specie by directly exchanging them for specie on demand. The British Parliament's Currency Acts of 1751, 1764, 1770, and 1773 constrained the colonies’ monetary behavior but only in limiting the maximum duration between emission and redemption in some colonies and, in all colonies, limiting the extent to which paper money could be made a legal tender for debts. Considerable flexibility in the exercise of monetary policy remained across the colonies.Footnote 13
The exercise of sovereign power by individual colonies over the real and monetary trade barriers at their borders, and the frequent and uncertain changes in these barriers, could create large and varying cost wedges between colonial markets thus thwarting market integration among the colonies. Because the Constitution removed these sovereign powers from the states, the expectation is that markets should be more integrated among post-Constitution U.S. states than among the same locations when they were separate British colonies. The early drafts of the Constitution at the 1787 Convention with respect to interstate trade rules replicated this colonial world with Congress playing the role of the British Board of Trade. As such, the difference between the market integration among the post-Constitution states and the same locations when they were colonies—used here as a proxy for the relevant counterfactual—measures the net contribution to the economic integration of the nation attributable to the U.S. Constitution.
WHAT WERE THE POST-CONSTITUTION TRADE BARRIERS BETWEEN STATES?
With the adoption of the Constitution states eliminated their revenue-generating tariffs on goods crossing their borders. The Constitution was an instant and overwhelming success on this point. For states such as Pennsylvania and South Carolina, this represented a major change in state fiscal behavior. Eliminating state tariff barriers, however, may not have translated into increased interstate market integration. Potential countervailing behaviors were available.
First, the Constitution did not stop states from enacting excise taxes. An excise (sales) tax on a product not produced internally is equivalent to an import duty. States, however, did not shift to sales taxes to replace the revenue lost from tariff duties. Before the adoption of the Constitution, states relied on poll and property taxes and land sales as their primary revenue sources. After the adoption of the Constitution, states continued to rely almost exclusively on these sources. They simply dropped the revenue earned on import and export duties without replacing it with other taxes. Federal assumption of state war debts in 1790 significantly reduced state expenses and so made this possible.Footnote 14 State sales taxes that could inhibit interstate market integration were largely unimportant pre-1812.Footnote 15
New York was an exception. From 1784 through 1811 it maintained a tax on the auction of “merchandise and effects of foreign production imported into the state.” Auction duties may have served as a surrogate for a tariff on foreign imports. In 1799 New York collected $47,908 in auction duties, 19 percent of total state revenue for that year. These auction duties could have produced price wedges between foreign goods in New York and the same foreign goods in other states and so inhibited better interstate market integration.Footnote 16
Second, the constitutional clause restricting state power to erect tariffs had an exception. States could place duties on imports and exports without congressional consent if they were “absolutely necessary for executing its inspection laws …”—Article 1, section 10, clause 2.Footnote 17 States could erect trade barriers in the guise of inspection laws, though they could not retain any revenue from such duties beyond the fees needed to defray the cost of inspection. States made extensive use of inspection laws, placing them on many important trade goods.
Only a few state inspection laws targeted imports, such as gunpowder imported into Pennsylvania. Most targeted goods produced within their respective states that were to be exported. For example, Pennsylvania required inspection of flour, bread, beef, pork, flaxseed, butter, biscuits, shingles, staves, Indian corn, hog lard, and black oak bark produced in Pennsylvania that were to be exported from the state; Maryland required said for tobacco, potash, bacon, beef, pork, fish, flour, and bread; Virginia required said for tobacco, flour, bread, fish, pork, beef, tar, pitch, turpentine, and ship ballast; and South Carolina required said for tobacco, beef, pork, rice, pitch, tar, rosin, turpentine, shingles, staves, cotton, bread, flour, corn, peas, potatoes, oats, wheat, and rye. These inspection laws applied to goods exported to other states as well as to foreign countries, but not to goods consumed within state. This fact is illustrated by Virginia who altered its law in 1802 to exempt flour shipped to the District of Columbia from inspection. This change turned the District of Columbia from an outside to an inside market vis-à-vis Virginia with respect to flour prices. In general, inspection laws were not uniformly enforced and they were changed from time to time.Footnote 18 They created varying price differentials between goods sold within state versus when the same goods were sold out of state thereby inhibiting better interstate market integration.
Third, while the Constitution eliminated competing state-issued monies and led to a common national currency of account (the U.S. Dollar) under a fixed specie exchange rate regime, it did not create a common paper medium of exchange. In fact, what arose post-Constitution were a greater number of paper currencies (different banknotes) than what had existed during the late colonial era. From 1787 to 1805 the number of privately run banks chartered by state governments increased from 3 to 76. These banks issued banknotes backed by fractional reserves of specie. A wide range of banknotes entered cross-state trade. The notes facilitated trade but at the cost of banknotes trading at varying discounts off their face value, depending on the distance to the issuing bank and that bank's reputation. This may have increased the transactions cost of cross–state arbitrage to a level comparable with what existed in the late colonial era of floating exchange rates between the fiat paper currencies issued by colonial legislatures. Monetary union did not mean financial union. Financial market integration by some measures would take another century. Even a national paper currency exchangeable at par throughout the country was 75 years away.Footnote 19 As such, interstate market integration may have been inhibited because a common unit-of-account currency may not have always been accompanied by the actual media of exchange being used at par.
South Carolina is noteworthy for its post-Constitution creation of non-tariff trade barriers. Besides inspection laws and local banknote currencies, South Carolina also subverted the constitutional restriction on states issuing bills of credit and creating legal tender laws.Footnote 20 In 1786 South Carolina issued 100,000 pounds in loan office bills of credit—paper money the state government loaned to its citizens who mortgaged their lands as security. These bills were receivable at par with specie for repaying said loans and for state taxes. While these bills were to be called out of circulation by 1791, every year thereafter through 1811 the state legislature extended the period of their acceptance at par with specie. The South Carolina legislature also explicitly made paper vouchers paid to legislators a legal tender for paying state taxes. These actions gave a nominal anchor to old state bills of credit and current legislator pay vouchers and so helped maintain these instruments as credible inside monies within South Carolina.Footnote 21 The maintenance of non-specie-linked inside monies competing with specie-linked outside monies in South Carolina between 1790 and 1811 may have inhibited better interstate market integration.
The extent to which these non-tariff barriers countered the removal of state revenue-generating tariffs and prevented improved interstate economic integration post-Constitution, vis-à-vis what existed among the colonies, is an empirical question that is addressed next.
PURCHASING POWER PARITY AND MARKET INTEGRATION
What can be used as a comparable method of estimating economic integration that also is feasible given the current data? One such measure is purchasing power parity (PPP hereafter)—which measures how well the prices of goods in two markets approximate the law of one price after accounting for exchange rates between the markets. Full purchasing power parity in absolute terms would imply that at any point in time

where EXab is the exchange rate between places a and b, Pa is the price index of goods in place a in terms of currency in place a, and Pb is the price index of goods in place b in terms of currency in place b. In the absence of trade barriers, profit arbitrage among merchants should drive the PPP equation toward holding with equality. Because transportation costs act as a wedge between markets and because shocks are not always fully anticipated, the PPP equation is not expected to hold instantly and absolutely, but only relatively and with some equilibrating time needed. As such, the PPP equation is typically estimated in terms of rates of change over time

where t is time in years, and y is the yearly deviations from PPP.
Given integrated markets, deviations from PPP should be arbitraged away. Thus, the standard test of PPP, and hence of market integration, is to determine if the deviations from PPP (the lnyt’s) are stationary over time, in other words whether unit roots can be rejected. Non-stationary deviations (unit roots) indicate the presence of obstructions to trade that are thwarting the profitability of arbitrage and the free flow of goods. Even if deviations from PPP are stationary, the time it takes them to mean revert when shocks push them off their stationary path—the half-life—can be used as a relative measure of the magnitude of the trade barriers that are preventing these markets from being instantly integrated. As such, whether or not deviations from long-run PPP are permanent and, when not permanent, how long it takes shocks to mean revert can be considered a measure of how well two market locations are integrated.Footnote 22
DATA, TIME SPANS, AND EMPIRICAL DESIGN
Empirical Design
A four-way empirical comparison is used to isolate the source of change in market integration. First, PPP among six post-Constitution states—Massachusetts, New York, Pennsylvania, Maryland, Virginia, and South Carolina—is estimated and compared with PPP among their colonial antecedents. This comparison is the main counterfactual answer to the questions posed above. Let S 1 equal the PPP actually measured between U.S. states post-Constitution in terms of the half-life to shocks. Let S 2 equal the PPP between U.S. states post-Constitution under the next best or most likely alternative constitution with respect to interstate trade rules. The net contribution of the U.S. Constitution to national market integration would then be minus [S 1 – S 2] (“minus” because a smaller half-life implies better market integration). S 2, however, is not measureable. Let S 3 equal the PPP actually measured among the colonies that would become future U.S. states. As argued above, the institutional structure underlying S 2 and S 3 are similar and thus S 3 can be a proxy for S 2. The net contribution of the U.S. Constitution to national market integration thus becomes minus [S 1 – S 3].
Second, because S 1 and S 3 are from different time periods, [S 1 – S 3] does not control for time-varying shocks from outside the system. Thus, a difference-in-difference approach is needed. Let C 1 equal the PPP actually measured among Canadian locations (Montreal and Quebec) post-U.S. Constitution, and C 3 equal the PPP actually measured among these same locations pre-1776. Minus [C 1 – C 3] can serve as a control for time-varying shocks from outside the system. The net contribution of the Constitution to U.S. national market integration becomes: minus [(S 1 – S 3) – (C 1 – C 3)]. The United States went through institutional changes that supposedly affected market integration. Canadian locations did not. If Canadian locations experienced improved market integration similar to that experienced by U.S. locations, it would be difficult to attribute improved U.S. market integration to the adoption of the U.S. Constitution.
Third, PPP is estimated between Canadian locations and non-Canadian (future U.S.) locations prior to 1776. This is done to determine whether PPP among the colonies was more or less uniform—a member of the British Empire effect—or was unique to future U.S. states. Fourth, PPP is estimated between U.S. states and Canadian locations during the post-U.S. Constitution period. This result, in conjunction with the second and third comparison, determines whether the first comparison is unique to the U.S. It also provides a relative comparison for determining whether the sovereign border effect on market integration was more potent at the colony/state level or at the national level.
Prices and Exchange Rates
PPP comparisons require continuous yearly data on prices and exchange rates per location as well as the selection of an estimation time span.Footnote 23 Surviving data constrain what can be done. The long-established price indices for Massachusetts, Pennsylvania, New York, and South Carolina and the price indices recently created for Montreal and Quebec are used here. Added to these, are price indices constructed by the author for Maryland and Virginia from raw individual price series. All these indices are heavily weighted toward tradable goods, thus the possibility of PPP failure due to the presence of non-tradable goods is largely removed.Footnote 24
For the colonial period, each price index listed above was expressed in a different currency, either that colony's unit-of-account currency or its paper currency if it had issued such in this period. Direct yearly exchange rates between these locations have yet to be found. However, such can be indirectly calculated using the long-established yearly exchange rates between each location's currency and pounds sterling. The exchange rate between two locations [EXab] can be calculated by taking the ratio of each location's exchange rate to pounds sterling [EXab = EXa£/Exb£]. These indirect exchange rates are used here.
The exchange rates between any two U.S. states in the post-Constitution period are assumed to be one [EXab = 1]. While the media of exchange were U.S. dollar specie coins, U.S. dollar-denominated banknotes, and foreign specie coins, all prices in the U.S. data were in U.S. specie dollars. Because direct yearly exchange rates between Canada and U.S. states have yet to be found, indirect rates are constructed in the same manner as was done for colonial locations.
Time Span Selection
For the post-Constitution period, the time span selected is from 1796 through 1811. The Constitution was not adopted by Congress until 1789 and its effects on market integration were not instantaneous. Related monetary institutions took several years to get into place. The First Bank of the United States was not established until 1791 and the U.S. mint not until 1792. Vestiges of pre-Constitution state institutions also took several years to be displaced. As late as 1795 some newspaper price currents, used here to construct the price indices, quoted their prices in old state currencies. The earliest date that is not tainted by this non-U.S. dollar pricing is 1796.Footnote 25
The year 1811 is taken as the end testing point because the War of 1812 produced a substantial liquidity crisis and one of the largest price inflations between the Revolution and the Civil War. The charter for the First Bank of the United States was also allowed to lapse in 1811, and so 1811 marks a monetary institutional transition point and thus an appropriate data end point.Footnote 26 In short, the period 1796 to 1811 was selected because it represents, as best as can be selected, a relatively homogeneous institutional regime across U.S. states for the post-Constitution period.
For the colonial period, the time span ends in 1775 and is extended back as far as the data allow. Lower Canada (Montreal and Quebec) did not fall under British administration until after 1760—and price indices and exchange rates are not available before then.Footnote 27 The price indices used for Massachusetts and Maryland go back to 1750 and 1756, respectively, and Virginia did not issue paper money until after 1755 with Virginia prices and exchange rates not reflecting said until about 1757. The New York price index goes back to 1748. The Pennsylvania and South Carolina data go back further but, being only two locations, starting before 1748 would not be that informative. For the spans of data used in the colonial period, Massachusetts, Montreal, and Quebec used a non-paper money unit-of-account currency, the Massachusetts pound and Halifax pound, respectively. The other five colonies used their own individual paper money standards.Footnote 28 In short, the period 1775 back to 1748 (or as close to 1748 as possible) was selected because it represents, as best as can be selected, a relatively homogeneous institutional regime within each colony and so between the colonies prior to the American Revolution.
PPP TEST PROCEDURES AND RESULTS
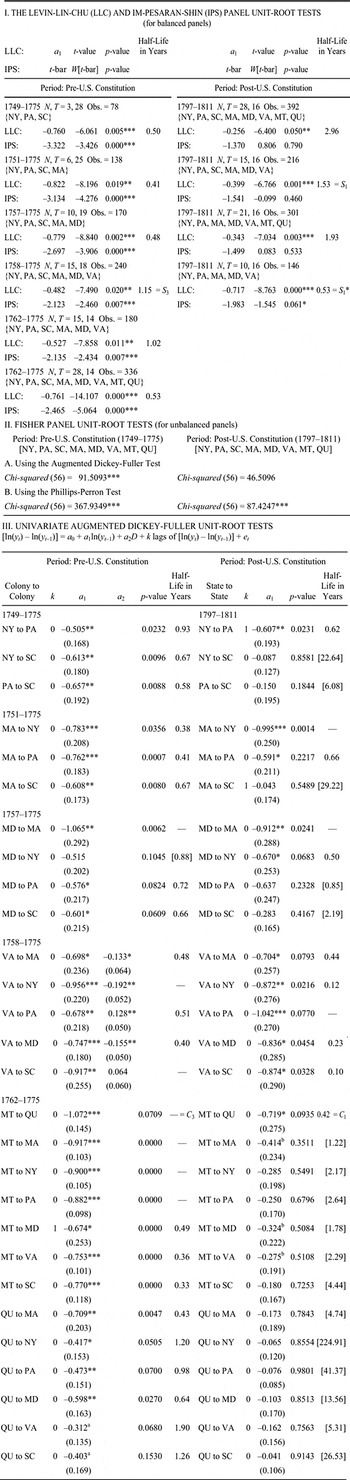
Table 1 presents several panel tests as well as the full complement of univariate augmented Dickey-Fuller tests for unit roots (non-stationarity) in the PPP equation residuals among the eight locations described above for the late colonial period (1748–1775) and the early U.S. national period (1796–1811).Footnote 29 To compare market integration among a group of locations post-Constitution with market integration among the same group in the colonial era, panel time-series techniques that group the locations together in each period are the most appropriate. Because panel tests vary in terms of how individuals in the panel are combined, how they perform in finite samples, and how the alternative to the null hypothesis of non-stationarity is constructed, it is important for robustness purposes to report a variety of panel tests. As such, all the panel tests currently available in STATA are reported here. The workhorse is the Levin-Lin-Chu test, in part because it is recommended for smaller panels and because it generates a coefficient (a 1) from which a half-life to shocks can be calculated. The panel results are also reported for different groupings in each period, such as for including Lower Canada versus not including Lower Canada and, for the colonial period, for a different span of years each time another colony enters the data set. This, along with the univariate tests, helps identify where the relative strengths of market integration lay within each panel grouping.Footnote 30
PANEL AND UNIVARIATE UNIT-ROOT TESTS FOR PPP, 1748–1775 VERSUS 1796–1811

***indicates that the coefficient is statistically different from zero above the 0.01 significance level. Dickey-Fuller critical values are used for a1 in the univariate regressions.
**indicates that the coefficient is statistically different from zero above the 0.05 significance level.
*indicates that the coefficient is statistically different from zero above the 0.1 significance level.
a If Period is contracted one year to 1763–1775, then the coefficients on a1 become statistically significant above the 0.1 level using Dickey-Fuller critical values.
b A unit root can be rejected if statistically insignificant lags (k = 3) are added.
Notes:
NY = New York, PA = Pennsylvania, SC = South Carolina, MA = Massachusetts, MD = Maryland, VA = Virginia, MT = Montreal (Lower Canada), and QU = Quebec (Lower Canada). The data are yearly. Standard errors are in parentheses. The p-values for the univariate regressions are MacKinnon approximate p-values generated by Phillips-Perron univariate tests when structural breaks are not present. Half-life calculations are bias-adjusted following Mark, International Macroeconomics, pp. 32, 44. When this bias-adjusted coefficient is too near to –1, a meaningful half-life different from zero cannot be calculated and is so indicated by a dash. Half-life estimates in brackets represents what the half-life would be if a unit root would have been rejected. See the text regarding S 1, S 3, C 1, and C 3. The panel tests for the pre-U.S. Constitution period do not incorporate the structural break in the Virginia series as was done for the univariate tests. While Period refers to the years spanned by the yt values, the existence and use of a yt –1 value is also implied for the initial year listed. y for the colonial period equals [(Colony A’s sterling exchange rate times Colony B’s Price Index) / (Colony B’s sterling exchange rate times Colony A’s Price Index)] for each colony-to-colony pairing, respectively. All cross-colonial exchange rates are derived by combining the respective colonies’ exchange rates with England, see Grubb, “Testing.” y for the U.S. dollar national period between U.S. states equals [State A’s Price Index / State B’s Price Index] for each state-to-state pairing, respectively. All cross-state exchange rates are assumed to be 1. y for the post-Constitution comparisons among Canadian locations (MT and QU) equals [Canadian Colony A’s Price Index / Canadian Colony B’s Price Index] and for each Canadian colony-to-U.S. state pairing equals [(Canadian Colony A’s Halifax pound to pounds sterling exchange rate times the U. S. State B’s Price Index) / (the U.S. dollar to pounds sterling exchange rate times the Canadian Colony A’s Price Index)]. Lags of the dependent variable were added to the specification until the k+1 lag was statistically insignificant at the 0.1 level. D for Virginia in the univariate regressions is a structural break dummy variable coded as one for the years 1766–1775 and zero otherwise. The colonial Maryland price index is an unweighted nine-commodity geometric price index constructed by the author from raw price data on corn, wheat, oats, rye, salt, beef, pork, sugar, and rum reported in Adams, “Prices,” p. 643. The Virginia and postcolonial Maryland price indices are both unweighted three-commodity geometric price indices constructed by the author from raw price data on corn, wheat, and tobacco provided by Walsh, “Personal Communication.” All other price indices and exchange rates were taken from the sources cited below.
Sources:
Bezanson, Gray, and Hussey, Wholesale Prices, pp. 293, 388; Cole, Wholesale Commodity Prices, pp. 11–12, 52, 57–58, 120–22, 135, 154–60; McCullough, Money, pp. 266–68; McCusker, Money, pp. 141–42, 164–65, 185–86, 198–99, 211–12, 223–24; Paquet and Wallot, “Some Price Indexes,” pp. 314–15; and Rothenberg, “Price Index,” pp. 975–76, 983–84, 1001. The U.S. dollar to pound sterling exchange rate is the Baltimore-White banknote adjustment to the true mint parity. See Officer, Between the Dollar-Sterling Gold Points, pp. 51–57, 76, 80–84. Alternative U.S. dollar to pound sterling exchange rates were tried, but none improved the results in terms of PPP holding more strongly over the period used here, see Grubb, “Creating the U.S. Dollar,” p. 1795.
Results for the Colonial Period
A unit-root process is rejected (PPP holds) in all panel tests for the colonial period regardless of test, time span, or location grouping. The half-lives to shocks are relatively short, between one-half and one year—the longer being when Virginia is included and Lower Canada is excluded. Given this data and using these methods, colonial markets appear well integrated. Despite a fair degree of practical sovereignty over their borders with respect to real and monetary trade barriers, the colonies did not exercise this sovereignty in a way to seriously inhibit the profitability of arbitrage and the free flow of goods. Weak British oversight and the threat of retaliatory action between colonies may have been enough to maintain market integration.Footnote 31
The univariate tests support the panel results and show that the results are spread evenly across the panel. A unit root can be rejected for 27 of the 28 pairings, and the half-lives to shocks are uniform across pairings, ranging between one-third and two-thirds of a year for most.Footnote 32 Only Virginia exhibits some structural break issues. For all colonies paired with Virginia in a univariate setting, a unit root cannot be rejected (results not shown). However, once a structural break is added so that 1757–1765 is different from 1766–1775, then a unit root is rejected. This makes sense for Virginia because, unlike the other colonies, Virginia had no experience issuing paper money before 1755 and engaged in poor money management early on. Complaints about Virginia were, in part, responsible for the passage of the 1764 Currency Act which supposedly corrected Virginia's behavior.Footnote 33 Nevertheless, the panel results, which do not incorporate the structural break in Virginia's behavior, show that this weakness in Virginia's PPP is minor.
Results for the Post-Constitution U.S. States
The panel tests are mixed regarding PPP holding among the post-Constitution U.S. states. The Im-Pesaran-Shin test fails to reject a unit root (PPP does not hold) except when South Carolina is excluded from the sample space and then only barely rejecting a unit root. By contrast, the Levin-Lin-Chu test rejects a unit-root process (PPP holds) for all groupings. The half-lives to shocks in these tests are relatively long at 1.5 years for the six U.S. states. This is between one-third and one-half longer than what is estimated among the panel tests in the colonial period. Only when South Carolina is dropped from the post-Constitution panel does the half-life to shocks improve into the range estimated for the colonial period.
The univariate tests support the panel results and show that the primary problem lies with South Carolina. PPP among U.S. states holds for 10 of the 15 pairings. PPP fails to hold for the Maryland-Pennsylvania pairing (just missing the 10 percent significance level) and for four of the five South Carolina pairings. The half-lives to shocks, excluding the South Carolina pairings, is comparable to that in the colonial period, confirming that it is something about South Carolina that is making market integration among the U.S. states look worse than among the colonies.
Given the totality of estimates in Table 1, the impression is that when applying the same methods and test criteria, PPP holds marginally better across the six colonies that would be future U.S. states than it does across the same locations post-Constitution. Relatively short half-lives to shocks are found which is consistent with colonial and early national markets being reasonably well integrated, with the exception of post-Constitution South Carolina. Quantitatively, the net contribution of the Constitution to increasing market integration can be measured as minus the difference in the half-life to shocks post-Constitution versus pre-Revolution. Comparing the panel estimate for the six states in the post-Constitution period (S 1) with the worst result in the panel estimates for these same six locations in the colonial period (S 3) yields a net gain in market integration of [minus (S 1 – S 3)] = –0.38. Even when selecting results biased in favor of the Constitution causing increased market integration among the states, a marked deterioration is found instead. Only if South Carolina is dropped from the post-Constitution panel can a case be made for improved market integration—the best case being [minus (S 1* – S 3)] = +0.62.
Market integration as measured by PPP across U.S. states pre-1812 was not improved by the U.S. Constitution compared with that in the late colonial period. The key economic clauses in the Constitution that removed real and monetary trade barriers between the states had little net effect compared with its likely and almost adopted alternative. As such, a constitution just like the one adopted in 1789 but with restrictions on state economic sovereignty regarding the trade that crossed their borders being less absolute and more akin to that experienced by the colonies prior to the Revolution (and with the U.S. Congress replacing the British Board of Trade with regard to oversight powers on these matters) may not have yielded worse market integration.
Robustness Checks: The South Carolina Anomaly Post-Constitution
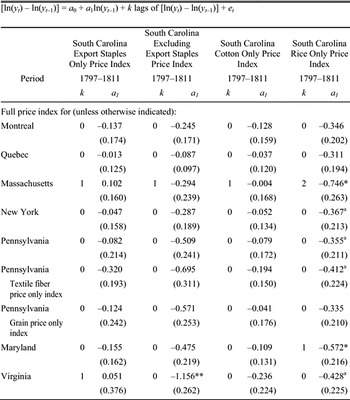
The failure of PPP to hold for most South Carolina pairings with other U.S. states in the early national period might be due to changes in the composition of goods in the South Carolina price index. Between 1748 and 1775 the South Carolina price index is heavily weighted toward rice and indigo, 51 and 22 percent, respectively. Cotton received zero weight. Between 1796 and 1811 the South Carolina price index is heavily weighted toward cotton, being now 32 percent of the index. The patenting of Eli Whitney's cotton gin in 1794 and the explosion in cotton production after 1795 drove cotton prices down. When the South Carolina price index is separated into its subcomponents, it shows that indeed cotton prices declined precipitously between 1796 and 1811, more so than for other goods. Given cotton's weight in the index, South Carolina's price index was dragged down relative to the price indices of other states.Footnote 34
Table 2 reports univariate augmented Dickey-Fuller tests for PPP between South Carolina and the other U.S. states and with Lower Canada for when the South Carolina price index is restricted to its reported subcomponents. The results show that export staple prices, in particular cotton prices, are a substantial contributor to the PPP failure of South Carolina pairings. However, removing export staples or just using rice prices from the South Carolina index, while moving the estimate toward PPP holding, does not improve the estimates enough to statistically reject PPP failure at the 10 percent level. Even when restricting the Pennsylvania and South Carolina indexes to be as close to each other in composition as possible, PPP failure cannot be statistically rejected. As such, the failure of PPP to hold for most South Carolina pairings in the post-Constitution period is a robust result.
UNIVARIATE AUGMENTED DICKEY-FULLER TESTS FOR PPP USING ALTERNATIVE SOUTH CAROLINA PRICE INDICES, 1796–1811

* indicates that the coefficient is statistically different from zero above the 0.1 significance level using Dickey-Fuller critical values.
** indicates that the coefficient is statistically different from zero above the 0.05 significance level using Dickey-Fuller critical values.
a If one or two statistically insignificant lags are added to the specification then the coefficients on a1 become statistically significant above the 0.1 level using Dickey-Fuller critical values.
Notes:
See the notes to Table 1. South Carolina Export Staples Only Price Index included cotton, indigo, rice, tar, tobacco, and turpentine—receiving weights of 65, 7, 15, 3, 7, and 3 percent in the index, respectively. South Carolina Excluding Export Staples Price Index included bacon, beeswax, corn, flour, pork, American rum, cognac brandy, foreign molasses, Jamaican rum, Liverpool salt, and muscovado sugar—receiving weights of 6, 2, 16, 15, 7, 14, 3, 7, 2, 10, and 18 percent in the index, respectively. The Pennsylvania Textile Fiber Price Only Index is an unweighted arithmetic index of cotton, flax, hemp, and wool prices. The Pennsylvania Grain Only Price Index is an unweighted arithmetic index of corn, oats, rice, rye, and wheat prices.
Sources:
See the source note to Table 1; and Bezanson, Gray, and Hussey, Wholesale Prices, pp. 13–16, 388, 394–95.
Difference-in-Difference Controls and Sovereign Border Effects: The Results for Lower Canada
The deterioration of market integration among U.S. states post-Constitution compared with pre-Revolution [minus (S 1 – S 3) in Table 1] might simply reflect some general deterioration of market integration among North Atlantic economies over this period. In other words, the Constitution might still be seen as improving market integration among the states if market integration in nearby locations that did not experience U.S. style institutional changes suffered even more deterioration. The difference in market integration in terms of the half-life to shocks between Montreal and Quebec after 1795 (C 1) compared with before 1776 (C 3) is used to net out such a possibility using a difference-in-difference assessment, namely minus [(S 1 – S 3) – (C 1 – C 3)] in Table 1. A small positive effect indistinguishable from zero (0.04) is produced when (S 1 – S 3) and C 3 = 0 are chosen for the calculation—choices that bias the result in favor of the Constitution increasing interstate market integration. Again, only if South Carolina is excluded from the panel of U.S. states (replacing S 1 with S 1*) can a case be made for the Constitution positively increasing interstate market integration.
The Canadian results can also be used to assess changes in market integration when national sovereign borders change. Table 1 tests PPP between Lower Canada and the U.S. states before U.S. independence (1761–1775) and after the adoption of the Constitution (1796–1811). The estimates reveal an erosion of market integration after the United States left the British Empire. Before the American Revolution, Lower Canada cannot be distinguished from non-Lower Canada in terms of PPP behavior. Post-U.S. Constitution, PPP continues to hold between Montreal and Quebec but now fails to hold between Montreal and all other U.S. states and between Quebec and all other U.S. states. The panel tests show a similar result. The half-life to shocks is much longer post-Constitution when Lower Canada is included compared with when it is excluded from the panel, 2 to 3 years compared with 0.5 to 1.5 years, respectively.
Market integration between Lower Canada and the United States parted ways post-Constitution. Lower Canada remained part of the British Empire which maintained substantial trade barriers against nations outside the empire, which now included the United States. Britain also went to war with France, suffered inflation, and went off the gold standard in 1797. The U.S. states were able to decouple their economies from Britain, not go to war, not go off a specie monetary standard, and not suffer as much inflation relative to the British and Canadian economies.Footnote 35 As such, these results are consistent with the relative importance of international sovereign borders as an impediment to PPP found in studies of the modern era.Footnote 36
CONCLUSIONS
Institutional change may matter, but sometimes not by much, and sometimes not in ways obvious to us or foreseen by their creators. Today, looking back two centuries into the past, the U.S. Constitution gives the appearance of having swept away both real and monetary trade barriers between the states thus enhancing national market integration. But in fact, it may not have done so within the lifetime of many of the Constitution's authors. Market integration as measured by PPP during 1796–1811 was not superior to market integration during the 1748–1775 colonial period. The institutions of the colonial period, with the U.S. Congress substituted into the oversight role played by the British Board of Trade, was a viable alternative in the discussions at the 1787 Constitutional Convention. As such, adopting the U.S. Constitution was not a watershed institutional change or a discrete break with the past with regard to national market integration prior to the War of 1812. While constitutionally changing the economic sovereignty of state borders mattered little for the early U.S. republic, changing the economic sovereignty of national borders mattered a lot. After 1795 a gap in market integration is apparent between the United States and what remained of the British Empire in America, a gap that did not exist before 1776.