Implications
This study demonstrates the usefulness of a cattle commercial SNPchip panel to estimate several population genetic parameters of in water buffalo. Our results have shown that 20 000 single nucleotide polymorphisms (SNPs) of the nearly 800 000 contained in the SNPchip are polymorphic for the water buffalo. This number of markers was sufficient to clearly distinguish between the swamp and river type buffalos, plus their hybrids. In addition, we have identified a few hundreds of SNPs located in major candidate genes that were associated with milk production traits in cattle. This information can be important to guide selection for milk traits in water buffalo.
Introduction
Water buffalos are an important farm livestock species in many tropical and subtropical climates. Although, traditionally buffalos were raised by small farm holders for multipurpose (milk, draught, meat), recently their use has been expanding to new regions and large and intensive buffalo farms are starting to emerge, particularly for milk production.
Currently, the domestic buffalo is divided into two domestic types with different karyotypes: the swamp type (Bubalis bubalis carabensis, 2n=48) present in South and Southeast China and Southeast Asia and, the river type (B. bubalis bubalis, 2n=50) mainly present in India, southwestern Asia, Egypt and southern Mediterranean Europe (Moioli et al., Reference Moioli, Georgoudis, Napolitano, Catillo, Giubilei, Ligda and Hassanane2001). The origins of the domestic water buffalo types are debated, although phylogenetic studies, mostly based on mitochondrial DNA (mtDNA), indicate that the river type may have originated from India and was domesticated about 5000 years ago in an atypical manner involving continuous introgression of wild animals to the domestic stocks in Indian subcontinent before mature phase of Indus Valley civilization (2600 to 1900 bc) (Nagarajan et al., Reference Nagarajan, Nimisha and Kumar2015).
Swamp type may have originated in the border between Indochina and Southwestern China and was domesticated about 4000 years ago (e.g. Yang et al., Reference Yang, Liu, Chen and Speller2008; Zhang et al., Reference Zhang, Lu, Yindee, Li, Kuo, Ju, Ye, Faruque, Li, Wang, Cuong, Pham, Bouahom, Yang, Liang, Cai, Vankan, Manatchaiworakul, Kowlim, Duangchantrasiri, Wajjwalku, Colenbrander, Zhang, Beerli, Lenstra and Barker2016). Y-chromosomal variation also confirms an independent domestication of swamp and river buffalo (Yindee et al., Reference Yindee, Vlamings, Wajjwalku, Techakumphu, Lohachit, Sirivaidyapong, Thitaram, Amarasinghe, Alexander, Colenbrander and Lenstra2010).
Swamp buffalo presents a higher diversity of both maternal and paternal lineages than river buffalo and also a strong geographic differentiation. River buffalo has a weak phylogeographic structure (Zhang et al., Reference Zhang, Lu, Yindee, Li, Kuo, Ju, Ye, Faruque, Li, Wang, Cuong, Pham, Bouahom, Yang, Liang, Cai, Vankan, Manatchaiworakul, Kowlim, Duangchantrasiri, Wajjwalku, Colenbrander, Zhang, Beerli, Lenstra and Barker2016). Hybridization between swamp and river buffalo was also reported (Zhang et al., Reference Zhang, Lu, Yindee, Li, Kuo, Ju, Ye, Faruque, Li, Wang, Cuong, Pham, Bouahom, Yang, Liang, Cai, Vankan, Manatchaiworakul, Kowlim, Duangchantrasiri, Wajjwalku, Colenbrander, Zhang, Beerli, Lenstra and Barker2016). Crosses between the two types are fertile, although the hybrid may have a lower reproductive value (Harisah et al., Reference Harisah, Azmi, Hilmi, Vidyadaran, Bongso, Nava, Momongan and Basrur1989; Iannuzzi, Reference Iannuzzi2009).
The growing importance of the water buffalo, genome-wide information and the modern sequencing and genotype platforms have been developed (i.e. Axiom® Buffalo Genotyping Array 90 K). Up to now, the number of studies reporting the use of the latter buffalo SNPchip only produced an handful of papers, which were focused at prospecting for major genes associated with milk traits (de Camargo et al., Reference de Camargo, Aspilcueta-Borquis, Fortes, Porto-Neto, Cardoso, Santos, Lehnert, Reverter, Moore and Tonhati2015; El-Halawanya et al., Reference El-Halawanya, Abdel-Shafy, Shawkya, Abdel-Latifc, Al-Tohamya and El-Moneima2017), animal management and breeding (Iamartino et al., Reference Iamartino, Williams, Sonstegard, Reecy, Cv, Nicolazzi, Biffani, Biscarini, Schroeder, de Oliveira, Coletta, Garcia, Ahmad, Ramunno, Pasquariello, Drummond, Bastianetto, Fritz and Knoltes2013), population diversity (Colli et al., Reference Colli, Milanesi, Vajana, Iamartino, Bomba, Puglisi, Del Corvo, Nicolazzi, Ahmed, Herrera, Cruz, Zhang, Yang, Hao, Zuo, Lai, Wang, Liu, Gong, Mokhber, Shahrbabak, Mao, Guan, Vlaic, Ramunno, Ahmad, Soysal, Ünal, Ketudat-Cairns, Garcia, Utsunomiya, Parnpai, Drummond, Galbusera, Burton, Hoal, Yusnizar, Sumantri, Moioli, Valentini, Stella and Williams2016) and a data analysis application (Nicolazzi et al., Reference Nicolazzi, Iamartino and Williams2014). Two of the major reasons for the small number of papers reporting the use of this technology might be the relatively elevated costs of using this technology and, the existence of a very few breeding programs for this species.
However, water buffalo (B. bubalis) and cattle (Bos taurus) are phylogenetically very close, have an high chromosomal homology between species and share gene order and chromosome banding homology (Borquis et al., Reference Borquis, Baldi, de Camargo, Cardoso, Santos, Lugo, Sargolzaei, Schenkel, Albuquerque and Tonhati2014). Therefore, buffalo studies can benefit of genomic tools developed for cattle, to gather genome-wide diversity information of the buffalo populations. Thus, the illumina BovineHD BeadChip developed for cattle are yet an interesting tool to collect population genomic information such as variation, structure, origins and relationships between populations and types of buffalos (swamp and river).
As the SNPs incorporated in this array have a uniform coverage of the bovine genome, it is expected to detect major changes induced by selection at coding regions of major candidate genes for milk and meat production, and thus, be as well an important source of genomic information for buffalo breeding programs. As any study using cross-species genetic markers, requires a preliminary testing of its suitability, here we aim study the usefulness of the cattle illumina BovineHD BeadChip to assess population genetics parameters, such as diversity, population structure, levels of population admixture and probabilities of identity (traceability) and parental exclusion.
Material and methods
Sampling and DNA extraction
A total of 15 samples of swamp buffalo and 15 samples of river buffalo were collected in China (ear skin biopsy, Supplementary Material Table S1). Samples from Swamp buffalo lineage selected for meat production were collected in Mangshi, Dehong, Yunnan, while the dairy river buffalo lineage samples were collected in Tengchong, Baoshan, Yunnan. Genomic DNA was extracted using a commercial JETQUICK Tissue DNA Spin Kit extraction (Genomed GmbH, Loehne, Germany) following the standard manufactures’ procedure.
As the mtDNA phylogenetic studies revealed the existence of two main distinct maternal lineages (A and B) in swamp buffalo, and one maternal lineage in river buffalo (Lei et al., Reference Lei, Zhang, Chen, Lu, Ge, Liu, Dang, Yao, Yao, Lu and Zhao2007), a 320 base pairs (bp) fragment of mtDNA D-loop were amplified to obtain a preliminary differentiation between river and swamp types, using previously described primers (Troy et al., Reference Troy, MacHugh, Bailey, Magee, Loftus, Cunningham, Chamberlain, Sykes and Bradley2001) and procedures for cattle (Beja-Pereira et al., Reference Beja-Pereira, Caramelli, Lalueza-Fox, Vernesi, Ferrand, Casoli, Goyache, Royo, Conti, Lari, Martini, Ouragh, Magid, Atash, Zsolnai, Boscato, Triantaphylidis, Ploumi, Sineo, Mallegni, Taberlet, Erhardt, Sampietro, Bertranpetit, Barbujani, Luikart and Bertorelle2006).
Samples were genotyped with the Illumina BovineHD BeadChip (Illumina, Inc. San Diego, CA, USA). The array comprises SNPs covering the 29 bovine autosomes, the sex chromosome (BTA X) and three unassigned linkage groups (Matukumalli et al., Reference Matukumalli, Lawley, Schnabel, Taylor, Allan, Heaton, O’Connell, Moore, Smith, Sonstegard and Van Tassell2009). The BovineHD BeadChip has 777 962 SNP markers spread through the genome, and the average distance between markers of 3.43 kb. Quality control filters were applied in order to eliminate all the genotypes that violated the Hardy–Weinberg equilibrium, to eliminate technology errors of the ‘no call’ type and monomorphic markers. Filtering was carried out by PLINK (Purcell et al., Reference Purcell, Neale, Todd-Brown, Thomas, Ferreira, Bender, Maller, Sklar, de Bakker, Daly and Sham2007). The QC criteria were minor allele frequency (MAF) threshold of 0.05%, the Hardy–Weinberg equilibrium threshold of P<0.001 and a SNP call rate threshold of 95%. All SNPs were annotated using SnpEff version 3.6 (Cingolani et al., Reference Cingolani, Platts, Wang le, Coon, Nguyen, Wang, Land, Lu and Ruden2012) to classify variants (into synonymous and non-synonymous) using the B. taurus genome assembly UMD 3.1. Enriched functional annotation clusters were defined using functional annotation tool implemented in Panther (Protein Analysis Through Evolutionary Relationships; www.pantherdb.org/tools/csnp) (Thomas et al., Reference Thomas, Campbell, Kejariwal, Mi, Karlak, Daverman, Diemer, Muruganujan and Narechania2003).
Statistical analysis
To identify genetic clustering in the buffalo data set we performed principal component analysis (PCA). Vectors constructed with the number of structural variations per chromosome were used to perform a PCA and look for differentiation between buffalo types. We used PLINK command make-rel option square to perform this analysis (Purcell et al., Reference Purcell, Neale, Todd-Brown, Thomas, Ferreira, Bender, Maller, Sklar, de Bakker, Daly and Sham2007). Population assignment analysis was performed using ADMIXTURE (Alexander et al., Reference Alexander, Novembre and Lange2009). The program implements a maximum likelihood method to infer the genetic ancestry of each individual from a mixture of K predefined ancestral groups. The number of clusters (K) tested ranged from 2 to 4. A preferable value of K will exhibit a low cross validation error compared with other K values.
Admixture between populations was calculated applying the three-population test (f3-test) with ADMIXTOOLS (Patterson et al., Reference Patterson, Moorjani, Luo, Mallick, Rohland, Zhan, Genschoreck, Webster and Reich2012). This is a formal test of admixture, to detect the occurrence of past gene flow events that led into admixture. In brief, what this test does is to test if swamp buffalo type has ancestry from the other two river buffalo lineages and vice versa. If one of the types is unadmixed, then the f3 has non-negative mean. But if f3 has negative mean this implies that the tested buffalo population is admixed with the other populations (Patterson et al., Reference Patterson, Moorjani, Luo, Mallick, Rohland, Zhan, Genschoreck, Webster and Reich2012). In our analysis, we divide river buffalo in the two groups identified by the PCA, and by the mtDNA lineage classification (Supplementary Material Table S1). Finally, we also ran these three different tests – Admixture, PCA and f3-test – with a data set containing only the SNPs that were polymorphic in both subspecies and the similarity between these values indicates the consistency of the results (data not shown).
Lastly, since SNPs genotyping profiles have potential to be used in forensic tests of identity and parentage exclusion (for review see e.g. Jobling and Gill, Reference Jobling and Gill2004), it can be of extreme importance to correct possible pedigrees errors of those individuals used in breeding programs or property disputes. For this reason, we have estimated the potential power of this set of SNPs to assess the probabilities of identity (PI; as the average probability of two independent samples having the same identical genotype) and the probabilities of parentage exclusion (PE). This probability was estimated under three different scenarios (Jamieson and Taylor, Reference Jamieson and Taylor1997) for each buffalo type were calculated using GENALEX v.6.5 (Peakall and Smouse, Reference Peakall and Smouse2012). The probability of exclusion for one putative parent when the other parent’s genotype is known
 $( {PE_{{X1}} \, {\equals}\, \mathop{\sum}\nolimits_i^n {p_{i} \left( {1\, {\minus}\, p} \right)^{2} \, {\minus}\, \mathop{\sum}\nolimits_{i\,\gt\,j\, {\equals}\, 1}^n {\left( {P_{i} P_{j} } \right)^{2} \,\left[ {4\, {\minus}\, 3\left( {P_{i} {\plus}P_{j} } \right)} \right]} } } )$
, where p
i
is the frequency of all the alleles x
i+
…
+
x
n
; estimates the probability of parental exclusion when the genotype of one parent is known but the other genotype is unavailable
 $PE_{{X2}} \, {\equals}\, 1\, {\minus}\, 4\mathop{\sum}{p_{i}^{2} } {\plus}2\left( {\mathop{\sum}{p_{i}^{2} } } \right)^{2} {\plus}4\mathop{\sum}{p_{i}^{3} \, {\minus}\, 3} \mathop{\sum}{p_{i}^{4} } $
; and the probability of excluding a putative parent pair
 $( {P_{{X3}} \, {\equals}\, 1{\plus}4\mathop{\sum}{p_{i}^{4} \, {\minus}\, } 4\mathop{\sum}{p_{i}^{5} \, {\minus}\, 3\mathop{\sum}{p_{i}^{6} \, {\minus}\, } } 8\left( {\mathop{\sum}{p_{i}^{2} } } \right)^{2} {\plus}8 \left( {\mathop{\sum}{p_{i}^{2} } } \right)$
 $\left( {\mathop{\sum}{p_{i}^{3} } } \right){\plus}2\left( {\mathop{\sum}{p_{i}^{3} } } \right)^{2} } \right) $
. The probability of identity (PI) was calculated using a conservative approach that considers the possibility of related individuals be included in the sample, by applying the formula:
 $PI\, {\equals}\, 0.25{\plus}( {0.5\mathop{\sum}p _{i}^{2} } ){\plus}$
 $[ {0.5( {\mathop{\sum}p _{i}^{2} } )^{2} } ]\, {\minus}\, ( {0.25\mathop{\sum}p _{i}^{4} } )$
for each locus, where p
i
is the allele frequency of a given allele i (Waits et al., Reference Waits, Luikart and Taberlet2001).
Results
A total of 15 samples of swamp buffalo and 15 samples of river buffalo were genotyped with the Illumina BovineHD BeadChip (777 962 SNPs). The genotyping rate was around the 86%. From these SNPs, 145 880 variants were removed due to missing genotype data and 611 603 markers were removed due to minor allele threshold. A total of 20 479 variants (mean gap size=1269 kb) remained for analysis (Supplementary Material Table S2). For the selected SNPs the genotyping rate was 98% and 724 of this SNPs were not mapped. Mean change rate was one change every 122 666 bases. The observed and expected heterozygosity (H) obtained from this subset of SNPs was HO=0.330 and HE=0.279 for the river type (standard deviation (SD) of 0.285 and 0.116, respectively), while for the swamp type it was slightly lower (HO=0.275 and HE=0.227, SD of 0.304 and 0.194 correspondingly), for all individuals we found and HE of 0.306 and HO=0.309 with a SD of 0.250 and 0.144, respectively.
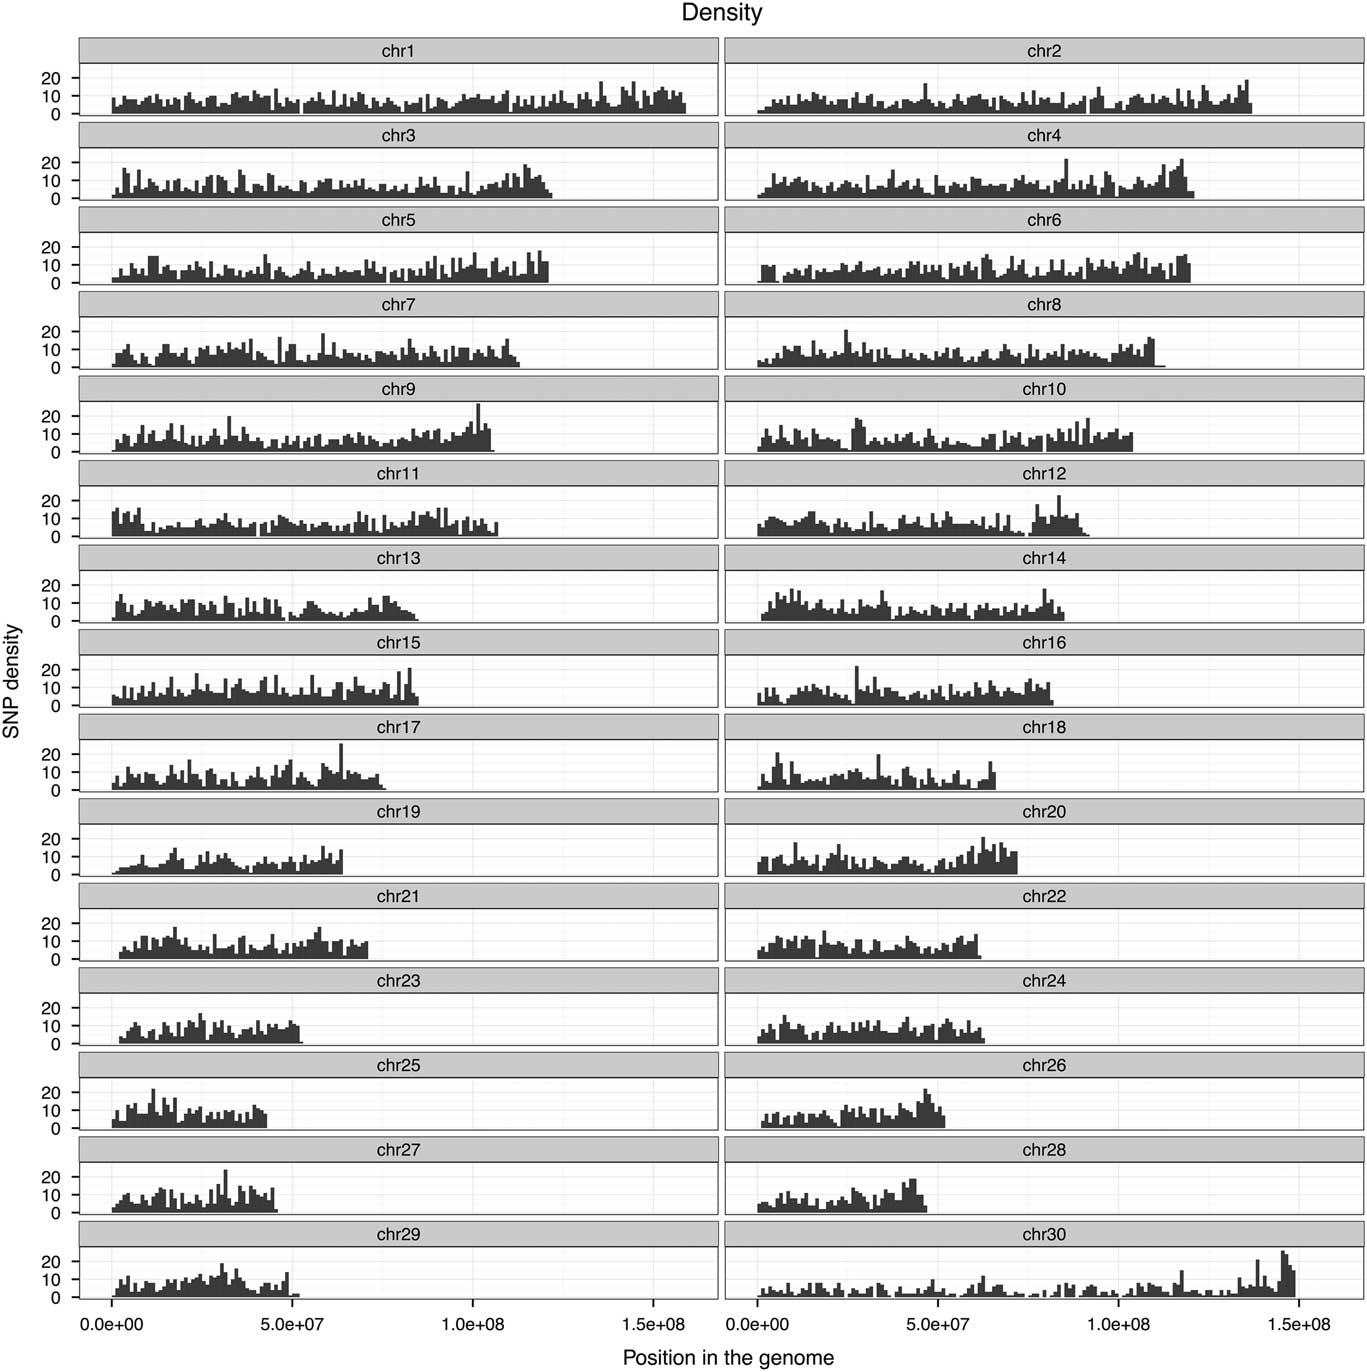
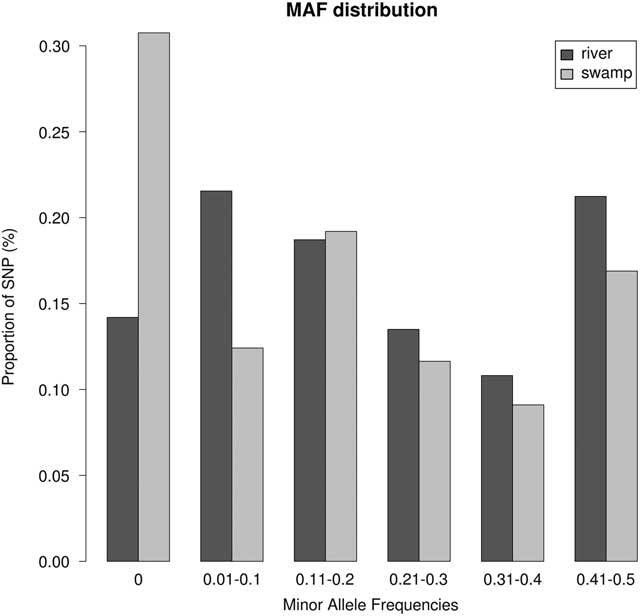
In river buffalo, 17 572 SNPs were polymorphic and 14 181 SNPs in swamp, and 11 274 SNPs were polymorphic in both subspecies. A total of 6298 SNPs were monomorphic in swamp and 2907 SNPs were monomorphic in river buffalo. All of these SNPs are evenly distributed across the bovine genome (Figure 1). To characterize selected SNPs, we determined the distribution of MAFs in each of the two-domestic subspecies (see Figure 2). The distribution of less frequent allele was slightly different between the two types.
Histogram representing the distribution of the single nucleotide polymorphisms (SNPs) included in our data set (20 479 SNPs) across the bovine genome. Each bar corresponds to 1 million base pairs of the chromosome.

Minor allele frequency (MAF) distributions. Average proportion of single nucleotide polymorphisms (SNPs) of various frequencies for swamp and river buffalo.

Regarding the final SNPs data set mapping, a total of 357 markers mapped within or around several major candidate genes (Table 1). We have found that some of those SNPs are located in genes related with production traits as growth hormone receptor, prolactin releasing hormone, α-lactalbumin, casein α S1, ATP binding cassette subfamily G member 2 (junior blood group) and diacylglycerol acyltransferases 2; immunological response: BoLA-DRB3 (major histocompatibility complex, class II); and reproduction traits: pregnancy-associated plasma protein A, pappalysin 1 (Santiago et al., Reference Santiago, Voge, Aad, Allen, Stein, Malayer and Spicer2005).
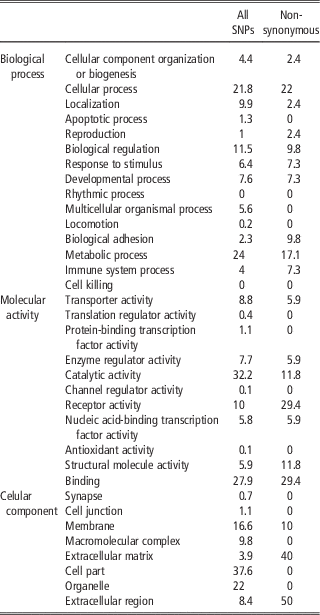
Summarized results of querying the PANTHER database for biological processes, molecular activity and cellular component

PANTHER clustering was performed in two groups: (1) using all data set of SNPs and (2) using only SNPs with non-synonymous effect. Results are given in percentage.
The tests on the possible impact of the SNP changes in the amino acids (aa) and protein function was performed using SnpEff (Cingolani et al., Reference Cingolani, Platts, Wang le, Coon, Nguyen, Wang, Land, Lu and Ruden2012), pointed one SNP having high impact, 26 moderate and 265 with low impact, and a total of 22 648 SNPs that despite modifying the aa do not interfere in the protein function (Supplementary Material Table S2). With respect to the protein change, we found 207 synonymous and 26 non-synonymous changes (Supplementary Material Table S2). A total of 11 SNPs affected UTR 5' regions and 57 affected UTR3' regions.
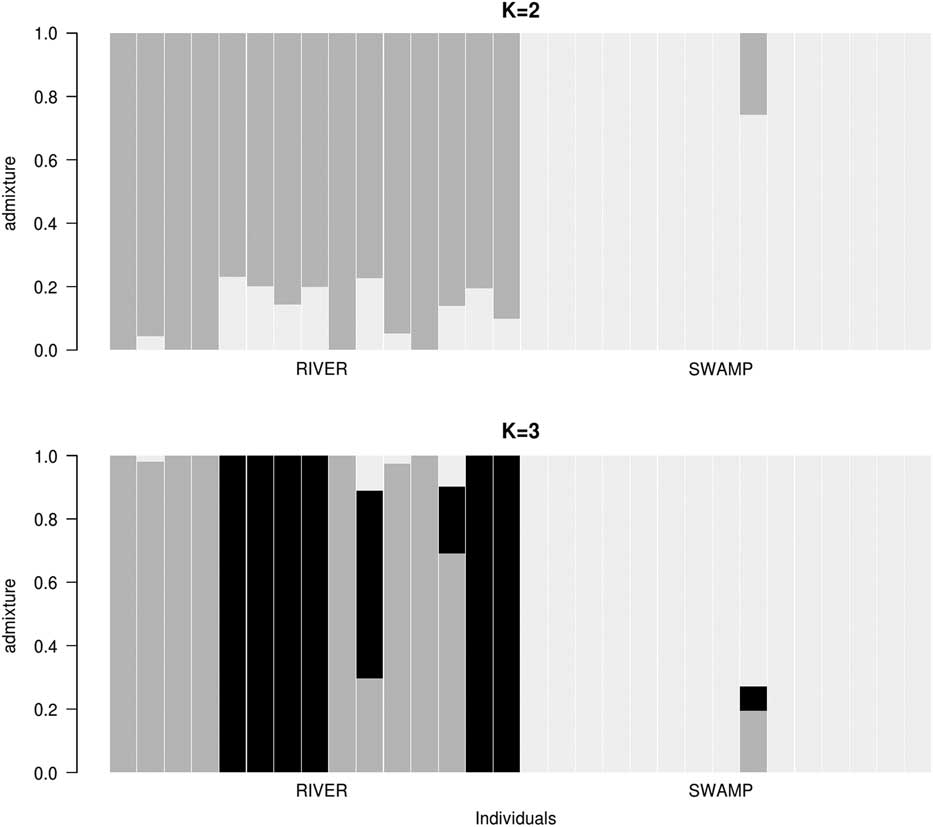
The results of the admixture test revealed two divergent clusters. Admixture between populations is a fundamental process that shapes genetic variation (Patterson et al., Reference Patterson, Moorjani, Luo, Mallick, Rohland, Zhan, Genschoreck, Webster and Reich2012). At first clustering (K=2), the major ancestral component of swamp is clearly distinct from the major component of river (Figure 3). Only five of 15 river samples do not contain swamp admixture. One swamp individual presented substantial river admixture. At K=3 a separation between river populations was observed. The lowest cross validation error indicates that 2 is the most parsimonious number of clusters.
Population structure of swamp and river buffalo. On top admixture plot for K=2, on bottom admixture plot for K=3. Cross validation error (CV error) for: K=2 was 0.47650, K=3 was 0.59353 and for K=4 was 0.65898.

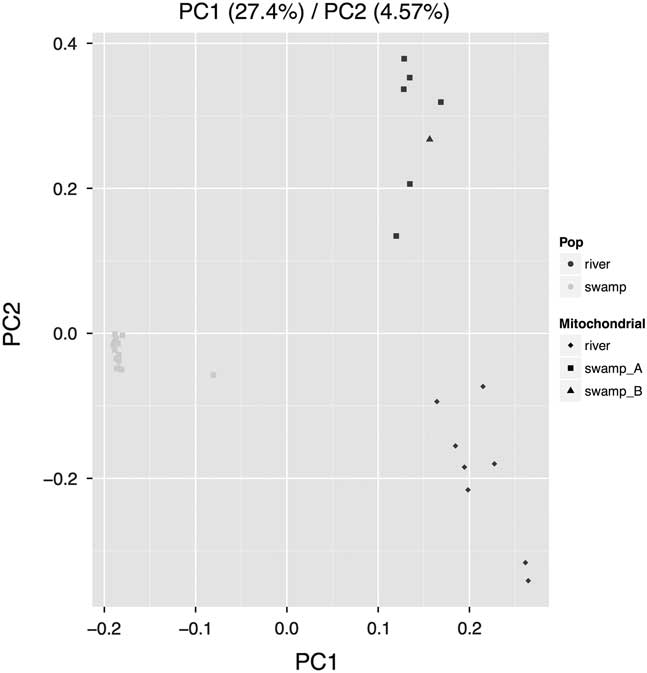
An exploratory PCA (Figure 4) also revealed two distinct groups. The first principal component (PC1) explained 27.4% of the total variance in the data and separated swamp form river buffalos. Besides of PC1, the only other component explaining a substantial part of the variance was PC2 (≈5%), which separates all the river buffalos in two groups. Regarding the classification based on the mtDNA sequencing data analysis (Supplementary Material Table S1), all swamp buffalos presented lineage A except one individual who presented lineage B. Six river buffalos were from lineage swamp A, one was from lineage swamp B and the rest were identified by the admixture test as from the river lineage.
Principal component (PC) analysis. River buffalo samples are in black and swamp in gray. The plot also shows river (diamond), swamp_A (square) and swamp_B (triangle) mitochondrial lineage. All PC values from PC1 to PC10: 27.4, 4.57, 3.48, 3.09, 3.05, 2.97, 2.93, 2.89, 2.84, 2.78.

Finally, the f3-test results obtained after running the analysis on all possible triplet populations combination (river 1, river 2 and swamp; see Supplementary Material Table S1), only the river 2 mtDNA lineage displayed values of admixture (f3=−0.0462 with a Z-score of −19.419). These values, can be taken as a strong evidence that river 2 is composed of both swamp and river type.
The maximum probability of exclusion for a set of 4664 SNPs setting the MAF at ⩾0.3 (Heaton et al., Reference Heaton, Leymaster, Kalbfleisch, Kijas, Clarke, McEwan, Maddox, Basnayake, Petrik, Simpson, Smith and Chitko-McKown2014), for the P X1 scenario was attained with just 34 and 46 SNPs for river and swamp type, respectively. The maximum probability for the P X2 was attained with a combination of 79 and 67 SNPs for river and swamp type, respectively. The maximum probability for the third scenario (P X3 ) was attained with a combination of 31 and 22 SNPs for river and swamp type, respectively. Finally, the combination of only 40 SNPs attained a PI as small as 2.3×10⁻⁵ and 2.0×10⁻⁷ for the river and swamp buffalos, respectively.
Discussion
In our study, we found a total of 20 479 SNP polymorphic in water buffalo and a call rate of 86%. In a similar study, 16 580 SNPs were found in 384 swamp type samples at a similar call rate (85%; Borquis et al., Reference Borquis, Baldi, de Camargo, Cardoso, Santos, Lugo, Sargolzaei, Schenkel, Albuquerque and Tonhati2014). Our higher number of SNPs is mostly due to the use of swamp and river buffalo samples in our testing. In fact, when consider only the 15 swamp samples, we have found only 14 181 SNPs. When, compared with works where the BovineSNP50 Genotyping BeadChip, were used in water buffalo a much smaller number of sites were found to be polymorphic (around 930) and had a lower call rate (~75%) (Michelizzi et al., Reference Michelizzi, Wu, Dodson, Michal, Zambrano-Varon, McLean and Jiang2010; Wu et al., Reference Wu, Song, Wu, Liang, Yang, Wathes, Pollott, Cheng, Shi de, Liu, Yang and Zhang2013).
The river buffalo ongoing expansion is generally linked to its dairy production capacity, although they are still used for meat production and draught. Comparative to dairy cattle, dairy buffalo production is still very incipient with a low reproductive efficiency due to long gestation period, long calving interval, silence heat and low conception rate (e.g. see review by Warriach et al., Reference Warriach, McGill, Bush, Wynn and Chohan2015). Nonetheless, river buffalo is well suited to poor feeding management as well as adapted to the hot-humid tropical climate condition (Iannuzzi, Reference Iannuzzi2009). As milk production is even lower in swamp buffalo type than in river buffalo, crossings between female swamp buffalos with male river buffalos is increasing with the aim of increasing the milk production in the swamp type (Iannuzzi, Reference Iannuzzi2009). One problem of theses crossings is the lower reproduction value of the hybrids (Harisah et al., Reference Harisah, Azmi, Hilmi, Vidyadaran, Bongso, Nava, Momongan and Basrur1989). Therefore, there a long way to be walked in terms of animal breeding to improve performances at several traits, from which reproduction and milk quantity are the most desired ones. The close genetic proximity with cattle and the allele sharing at major candidate genes, indicate that much of the molecular and physiological architecture of some production traits, might be shared among these two species. Although, in a recent study de Camargo et al. (Reference de Camargo, Aspilcueta-Borquis, Fortes, Porto-Neto, Cardoso, Santos, Lehnert, Reverter, Moore and Tonhati2015) considered that those shared polymorphisms might represent an ancestral polymorphism, and therefore might not be appropriate to study the result of artificial selection in dairy buffalos, we think that SNP frequency distribution patterns in a certain region are more important in genome-wide association studies than the evolutionary history/genealogy of the SNP itself. For example, a statistical significant allele frequency departure from the neutral expectations, shared by one or more SNPs located in a specific region of the genome might merits to be tested for association with a certain phenotype. Therefore, those shared SNPs which we found located in genes related with production traits, immunological response, and reproduction traits (Supplementary Material Table S2), can be a good starting point for marker assistance selection in buffalo.
Regarding the impact on the biological, cellular and molecular pathways caused by all the analyzed SNPs, the clustering analysis showed that the molecular function most largely affected are the catalytic and binding functions. When we consider only the non-synonymous aa changes (26 SNPs), the molecular function most largely represented are the binding and the receptor activity (Supplementary Material Table S2). When considering both (all SNPs plus the non-synonymous changes) the most common processes affected were the cellular process and the metabolic process. It is important to note that it is not uncommon for a gene to have more than one transcript and consequently the same variant (e.g. a SNP) might affect different transcripts in different modes. Therefore, careful should be paid when interpreting the different scales of impact estimated by the method used by SNPeff software for a given SNP.
The buffalo classification based on the mtDNA revealed a striking alignment with the results obtained from the admixture and PC analysis. The genetic variation of swamp buffalo is clearly distinct from river buffalo, and both our results, mtDNA sequencing and SNPchip, suggest that the three main groups (swamp, river 1 and river 2, Supplementary Material Table S1) can be differentiated from each other. The negative f3-test results can be taken as a strong evidence that river 2 is composed of both swamp and river types. Indeed, this analysis showed that nearly half of the river individuals were crossed with swamp buffalos (seven out of 15; see Figures 3 and 4).
Finally, the P E and P I estimates clearly demonstrate that a combination of a small number of SNPs (<80) offers enough power to be used in parental testing and traceability (identity). The slightly different P E and P I values obtained for the different types reflect the heterozygosity differences observed at each buffalo type – river and swamp. Nonetheless, none of the combinations necessary to obtain the highest probabilities required more than 80 SNPs. Therefore, this set of SNPs can be used for testing parentage and traceability of the many breeds and types of water buffalos.
Conclusions
Here we demonstrated that a subset of 20 000 SNPs from the BovineHD BeadChip is sufficient to differentiate between swamp and river buffalo and to estimate the different admixture proportion in crosses of both types. However, a denser SNP data set would permit to increase the accuracy of the genomic linkage disequilibrium and selective sweeps for these species. Nonetheless, the current number of SNPs (±20 000) found in this SNPchip, has enough information to draw some population genetics parameters (parentage and individual identification), and the fact that it includes SNPs located in major candidate genes involved in milk production traits, it can be useful in further studies to determine whether these SNPs are significantly associated with these traits in buffalos as they are in dairy cattle.
Acknowledgments
This work was supported by a project grant from FCT PTDC/CVT/117851/2010. LP-P is funded by an FCT scholarship (SFRH/BPD/94518/2013). AB-P is supported by FCT through an IF-FCT contract (IF/00370/2013). V.C. is funded by an FCT scholarship (SFRH/BD/88129/2012) and S.C. is supported by High-Level Overseas Talents Recruitment Program of Yunnan Province. The authors thank the two anonymous reviewers for their careful reading of our manuscript and their many insightful comments and suggestions.
Supplementary Material
To view supplementary material for this article, please visit https://doi.org/10.1017/S1751731117001719