INTRODUCTION
As one of the world's most important food crops, accounting for more than 0·34 of global cereal production (FAO 2012), the yield of maize needs to double by 2050 to ensure global food security (Rosegrant et al. Reference Rosegrant, Ringler, Sulser, Ewing, Palazzo, Zhu, Nelson, Koo, Robertson, Msangi and Batka2009; Shiferaw et al. Reference Shiferaw, Prasanna, Hellin and Bänziger2011; Tilman et al. Reference Tilman, Balzer, Hill and Befort2011; Ray et al. Reference Ray, Mueller, West and Foley2013). In recent decades, maize yield has increased as a result of a combination of enhanced genetics and better crop management (e.g. improved environmental stress tolerance and increased use of nitrogen (N) fertilization) (Cardwell Reference Cardwell1982; Tollenaar & Lee Reference Tollenaar and Lee2002; Duvick Reference Duvick2005; Lee & Tollenaar Reference Lee and Tollenaar2007). Modern hybrids are grown at a high plant density to optimize yield (Tokatlidis & Koutroubas Reference Tokatlidis and Koutroubas2004). In practice, however, the rates of gain in maize yield have slowed markedly (Peltonen-Sainio et al. Reference Peltonen-Sainio, Jauhiainen and Laurila2009; Finger Reference Finger2010; Ray et al. Reference Ray, Ramankutty, Mueller, West and Foley2012), despite the fact that planting densities have continued to increase with new varieties and N application strategies (Tollenaar & Lee Reference Tollenaar and Lee2002; Tokatlidis & Koutroubas Reference Tokatlidis and Koutroubas2004; Tilman et al. Reference Tilman, Balzer, Hill and Befort2011). An understanding of how yield and biomass accumulation are influenced by plant density and N application is necessary to guide farmers’ practice towards achieving high grain yield and nitrogen use efficiency (NUE).
Maize grain yield is determined by the total biomass accumulation and allocation to the grain during the grain-filling period (Tollenaar Reference Tollenaar1991; Ma & Dwyer Reference Ma and Dwyer1998; Rajcan & Tollenaar Reference Rajcan and Tollenaar1999; Ding et al. Reference Ding, Wang, Jiang, Liu, Niu and Gao2005; Pommel et al. Reference Pommel, Gallais, Coque, Quillere, Hirel, Prioul, Andrieu and Floriot2006; Echarte et al. Reference Echarte, Rothstein and Tollenaar2008). Increases in plant density and N application rate for maize production generally have a large positive impact on the canopy leaf area index (LAI) and as a consequence, on biomass accumulation (Tollenaar & Aguilera Reference Tollenaar and Aguilera1992; Andrade et al. Reference Andrade, Vega, Uhart, Cirilo, Cantarero and Valentinuz1999). However, excess LAI often causes leaf shading and lower leaf nutrient concentration, reducing canopy photosynthesis (Vos et al. Reference Vos, van der Putten and Birch2005), accelerating leaf senescence and reducing grain yield and NUE (Tollenaar et al. Reference Tollenaar, Aguilera and Nissanka1997). Boomsma et al. (Reference Boomsma, Santini, Tollenaar and Vyn2009) reported an increase in NUE with increased plant density from sub-optimal to optimal when N fertilizer was applied and a decrease in NUE as the rate of N application increased. A more in-depth study on plant density interactions with N management strategies is necessary to optimize the interaction between increased canopy LAI and reduced leaf photosynthesis in developing effective approaches to achieve high grain yield and NUE.
Previous studies on optimal N management to improve grain yield and NUE have highlighted the need for greater synchrony between plant N demand and supply throughout the growth period (Cassman et al. Reference Cassman, Dobermann and Walters2002; Chen et al. Reference Chen, Zhang, Römheld, Horlacher, Schulz, Böning-Zilkens, Wang and Claupein2006). An in-season root zone N management (INM) strategy considering crop N requirements at different growth stages and soil nitrate (NO3 –) content in the root zone was developed to optimize the rate of N fertilization on the North China Plain (NCP) (Chen et al. Reference Chen, Zhang, Römheld, Horlacher, Schulz, Böning-Zilkens, Wang and Claupein2006; Cui et al. Reference Cui, Zhang, Chen, Miao, Li, Shi, Xu, Ye, Liu, Yang, Zhang, Huang and Bao2008). According to this strategy, maize growth was divided into three periods and the recommended N rate, applied between rows as a side-dressing, was calculated by deducting the measured soil NO3 – content in the root zone from the N target value based on the crop N requirements at each growth stage. Studies demonstrated that the rate of N fertilizer application using this INM strategy on the NCP was reduced by 41–79% compared with standard farmers’ practice, with no crop yield losses (Zhao et al. Reference Zhao, Chen, Zhang, Zhang, Schroder and Römheld2006; Cui et al. Reference Cui, Zhang, Mi, Chen, Li, Chen, Li and Shi2009; Yan et al. Reference Yan, Yue, Qiu, Chen, Cui and Chen2014). In an attempt to increase yield on the NCP, maize plant density has been increased from 4·5 to 5·5 plants/m2 in recent decades and is projected to increase further in the future (Chen et al. Reference Chen, Yang, Zhao and Zhao2008). However, to date, few attempts have been made to evaluate the effects of differences in plant density on the N management strategy. The results from such research will be useful in improving specific N management strategies for sustainable maize production, especially on the NCP due to its particular climate and environment.
The objectives of the present study were to: (i) evaluate the effects of plant density and N management on maize grain yield and NUE; (ii) evaluate the regulation of plant density combined with N management on the dynamics of biomass production and allocation to the grain; (iii) optimize the interaction between increased canopy LAI and reduced leaf productivity through changing plant density and N management strategy; and (iv) identify the pre- and post-silking N uptake in maize at varying plant densities and N management strategies. These results will hopefully provide useful information to aid in the selection of optimal plant density and N management strategies to enable farmers to improve both grain yield and NUE.
MATERIALS AND METHODS
Site description
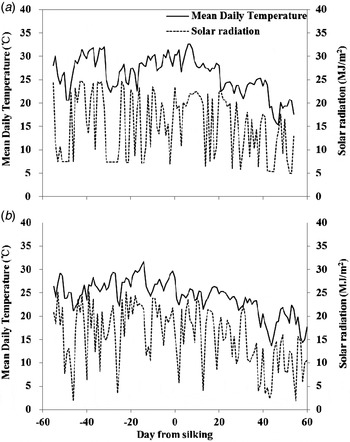
Field experiments were conducted in 2013 and 2014, in Quzhou (QZ) County (36°54′N, 115°00′E, 40 m a.s.l.), Hebei Province, China. The primary crop rotation is winter wheat–summer maize; maize is planted after the winter wheat is harvested in mid-June, and the maize is harvested in early October. Meteorological conditions were automatically recorded by a standard agro-meteorological station located in the experimental field. The daily mean temperature and solar radiation during the two growing seasons are presented in Fig. 1. In 2013 and 2014, the daily mean temperatures were 26 and 24 °C, the total solar radiation was 1659 and 1807 MJ/m and the total precipitation was 351 and 274 mm, respectively. Ninety millimetres of irrigation water was applied immediately after sowing of the maize in each year. In 2014, an additional 80 mm of irrigation water was applied on 20 July due to drought stress. The soil was clay loam with the following characteristics: organic matter content, 14·2 g/kg; total N, 0·83 g/kg; Olsen phosphorus (P), 7·2 mg/kg; NH4OAc-potassium (K), 125 mg/kg; pH, 8·3; and bulk density, 1·36 g/cm3.
Daily mean temperature and solar radiation during the maize growing seasons in 2013 and 2014 in Quzhou (QZ) County (36°54′N, 115°00′E, 40 m a.s.l.), Hebei Province, China.

Experimental design
The experimental design was a split-plot with four replicates. Five N treatments were applied as the main plot, and the three plant densities were designated as sub-plots. The size of the main plot was 20 × 15 m, and the sub-plot size was 20 × 5 m. The N treatments were as follows: control (0 N), 0·7 optimal N rate (ONR × 0·7), ONR based on INM (see below), 1·3 optimal N rate (ONR × 1·3) and the typical N dose used by farmers on the NCP (FNP). The leaf collar method was used to document maize development (Ritchie et al. Reference Ritchie, Hanway, Benson and Herman1993). The FNP was set at 250 kg/ha (100 kg/ha was applied at the 3-leaf stage (V3), and 150 kg/ha was applied at the 6-leaf stage (V6)), which is typical for Hebei Province (Cui Reference Cui2005). The ONR was determined as follows: the maize-growing season was divided into three stages: planting to V6, V6 to flowering (VT) and VT to maturity (R6). At sowing, 45 kg/ha was applied; the ONR was determined using the V6 to VT and the VT to harvest stages by subtracting the measured soil NO3 – content in the root zone (0–90 cm for the two growth stages) from the target N value. The target value for each successive growth period was estimated based on the target yield and crop N uptake (Cui et al. Reference Cui, Zhang, Chen, Miao, Li, Shi, Xu, Ye, Liu, Yang, Zhang, Huang and Bao2008). In the present study, the target N values were 60, 185 and 160 kg/ha for the planting to V6, V6–VT and VT–R6, respectively. The rates of N application in the ONR were 163 and 174 kg/ha in 2013 and 2014, respectively. Urea was applied deep (10 cm) into the soil with a furrowing machine at the V6 and VT stages according to the N treatments. Based on the soil P and K test results, all plots received appropriate amounts of triple superphosphate (P2O5 45 kg/ha) and potassium chloride (K2O 90 kg/ha) at sowing, accompanied by the application of urea.
A typical maize hybrid, Zhengdan958, the main maize cultivar on the NCP, was planted after the harvest of winter wheat in mid-June at three plant densities (6·0, 7·5 and 9·0 plants/m2), with the same row spacing of 60 cm. The maize was harvested at the beginning of October, and the average harvest plant densities were 6·1, 7·6 and 8·9 plants/m2 for the three plant density treatments, respectively, across both growing seasons. The 6·0 and 7·5 plants/m2 treatments had similar growing cycles; silking occurred on 10 August 2013 and on 5 August 2014 in all N treatments, except the 0 N treatment. The silking stage of the 9·0 plants/m2 treatment for both years was 1 day later than that of the 6·0 and 7·5 plants/m2 densities, and the silking stage of the 0 N treatment was 3 and 4 days later than that of the other N treatments in 2013 and 2014, respectively. The grains were harvested before complete maturity (black layer or R6) on 4 October 2013 and 3 October 2014 because of a need to plant winter wheat at the site. No obvious water limitation, weed or pest occurrences were observed during either growing season.
Sampling and measurements
A minimum of five soil samples (30-cm increments from 0 to 90 cm) were collected from each plot before planting, 1 day before N application, at the V6 and flowering stages and at harvest. The soil samples were extracted with 0·01 M calcium chloride solution (CaCl2), and continuous flow analysis (TRAACS 2000, Bran & Luebbe, Norderstedt, Germany) was used to analyse the ammonium (NH4 +) and NO3 – content. NO3 – test strips and a reflectometer (Reflectometer RQflex, E. Merck, Darmstadt, Germany) were used to analyse soil NO3 – and to calculate the ONR.
The leaf collar method was used to document maize development. Plant samples were taken at the V6, V10, flowering (VT), milk (R3) and dent (R5) stages and at harvest. During each sampling event, the above-ground biomass was estimated by clipping six plants in three rows near the middle of each plot. At harvest, plants were removed manually from 5 × 2·4 m strips (four rows) in the middle of each plot. The stover and spike were separated at the R2 stage, and the stover and kernel were separated at harvest. All plant samples were dried at 70 °C in a forced-draft oven to constant weight and subsequently weighed. Sub-samples were passed through a 1-mm screen in a sample mill and mineralized using H2SO4–H2O2, after which the N concentration was determined using the Kjeldahl method (Horowitz Reference Horowitz1970).
Leaf length (L) and width (W) were measured at the V6, V10, VT, R3 and R5 stages and at harvest, and leaf area (A) was calculated as A = L × W × K (Montgomery Reference Montgomery1911), where K = 0·75 for fully expanded leaves and K = 0·5 for incompletely expanded leaves (Bertin & Gallais Reference Bertin and Gallais2000). A leaf was considered to have senesced when half or more of its area had yellowed. Green LAI was calculated as the sum of the green leaf area of the six plants collected during each sampling event divided by the area occupied by those plants. Chlorophyll content was measured at the V6, V10, silking (VT), R3 and R5 stages and at harvest with a SPAD-502 chlorophyll meter (Konica Minolta, Ramsey, NJ, USA), which is well-adapted to maize leaves (Dwyer et al. Reference Dwyer, Tollenaar and Houwing1991). Thirty measurements were performed in the middle third of the ear leaf (lengthwise), and the mean of the 30 values was used.
Statistical analysis
Analysis of variance was performed using the SAS statistical analysis package (version 6.12, SAS Institute, Cary, NC, USA). The statistical model included sources of variation due to N level, replicate number and density. A two-way ANOVA model with N treatment (d.f. = 4) and plant density (d.f. = 2) was used to assess the overall variability of grain yield, HI and NUE. The NUE was calculated as the above-ground N uptake divided by the available N content (from both soil and fertilizer). The following equation was used to calculate NUE:
 $${\rm NUE}\, = \,({\rm Nupt}_{{\rm fert}.} - {\rm Nupt}_{{\rm unfert}.} )/{\rm N applied}$$
where Nuptfert. is N uptake in the fertilized plot and Nuptunfert. is N uptake in the unfertilized plot.
RESULTS
Grain yield and nitrogen use efficiency for different plant densities and nitrogen application rates
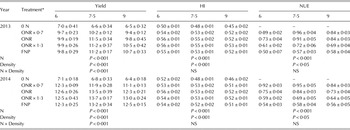
Across both years and all N management strategies, plant density had a significant (P < 0·001) effect on grain yield (Table 1). The average grain yields were in the following order: 11·0 t/ha in the 7·5 plants/m2 treatment >10·3 t/ha for 6·0 plants/m2 >10·2 t/ha for 9·0 plants/m2. Compared with the 6·0 plants/m2 treatment, the kernel number (KN) and thousand kernel weight (TKW) of the 7·5 plants/m2 treatment decreased by 9·9 and 5·4%, respectively, while the spike number at harvest increased by 24·6% (data not shown). As plant density further increased from 7·5 to 9·0 plants/m2, the spike number increased by 17·1%, whereas the average KN and TKW decreased by 15·0 and 6·8%, respectively, across the 2 years (data not shown).
Maize grain yield (t/ha) (15·5% moisture content), harvest index (HI) and nitrogen (N) use efficiency (NUE) (±s.e.) in 2013 and 2014, for plant densities of 6·0, 7·5 and 9·0 plants/m2 and all N treatments

*The N treatments were zero N (0 N), optimal N rate based on in-season root zone N management (ONR), ONR × 0·7, ONR × 1·3 and farmers’ standard N practice (FNP).
NS, not significant.
Maize grain yield was significantly (P < 0·001) affected by N management, and the response of grain yield to N application varied according to plant density (Table 1). Across the two growing seasons, the highest average grain yields for the 6·0, 7·5 and 9·0 plants/m2 densities were 11·5, 12·5 and 11·8 t/ha with the ONR × 0·7, ONR and ONR × 1·3 treatments, respectively. Further increases in the rate of N application, which exceeded the ONR × 0·7, ONR and ONR × 1·3 treatments in the 6·0, 7·5 and 9·0 plants/m2 treatments, respectively, failed to improve grain yield.
Plant density and N management had a significant (P < 0·05 and P < 0·001) effect on NUE in both years, while the plant density × N management interaction was not significant in either year (Table 1). Across both years and all N management strategies, the average NUE was in the following order: 0·78 kg/kg for 7·5 plants/m2 >0·71 kg/kg for 9·0 plants/m2 >0·69 kg/kg for 6·0 plants/m2. For the ONR, the average NUE in the 7·5 plants/m2 treatment was 0·88 kg/kg, which was 11·4 and 18·9% higher than the 0·79 and 0·74 kg/kg of the 9·0 and 6·0 plants/m2 treatments, respectively.
Dynamics of dry matter and grain accumulation for different plant densities and nitrogen application rates
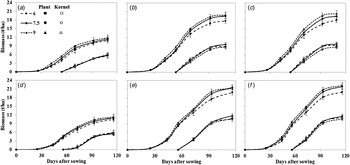
Plant and kernel biomass accumulation varied for different plant densities and N management strategies (Fig. 2). For the control N treatment, although the plant biomass accumulation of the 9·0 plants/m2 treatment was significantly (P < 0·05) higher than that of the 6·0 and 7·5 plants/m2 treatments for the entire growing season, the average kernel biomass accumulation was similar or even lower across the 2 years (Figs 2(a) and ( d )). As a result, the average harvest index (HI) of the 9·0 plants/m2 density was 0·45, which was significantly (P < 0·001) lower than the 0·48 and 0·51 of the 7·5 and 6·0 plants/m2, respectively, across the 2 years (Table 1).
Maize biomass and grain accumulation (±s.e.) during the growing period under zero N (0 N), optimal N rate (ONR) and ONR × 1·3 for three plant densities during the 2-year study. (a–c) show the biomass and grain accumulation for 0 N, ONR and ONR × 1·3 in 2013, respectively, and (d–f) show the biomass and grain accumulation for 0 N, ONR and ONR × 1·3 in 2014, respectively.

For the ONR treatment, the average total biomass levels were 18·8, 20·6 and 20·4 t/ha for the 6·0, 7·5 and 9·5 plants/m2 treatments, respectively (Figs 2(b) and ( e )). The significantly (P < 0·01) lower biomass of the 6·0 plants/m2 treatment was related to the lower post-silking biomass accumulation (10·9 t/ha) compared with the 12·4 t/ha biomass of the 7·5 plants/m2 treatment. Although total biomass accumulation at maturity was similar between the 7·5 and 9·0 plants/m2 treatments, the dynamics of the dry matter and grain accumulation differed. At the dent (R5) stage, the average biomass accumulation of the 9·0 plants/m2 treatment was 19·7 t/ha, more than 0·7 t/ha higher than the 19·0 t/ha of the 7·5 plants/m2 treatment. From the R5 to maturity stage, the average dry matter accumulation were 0·8 and 1·4 t/ha for the 9·0 and 7·5 plants/m2 treatments, respectively. The corresponding average grain biomass accumulation was 0·7 and 1·5 t/ha for the 9·0 and 7·5 plants/m2 treatments, respectively. Hence, a significantly (P < 0·001) higher grain yield for 7·5 plants/m2 was observed, increasing from 11·1 to 12·5 t/ha compared witho the 9·0 plants/m2 treatment.
As the rate of N application increased from ONR to ONR × 1·3, despite the fact that no differences in pre-silking biomass accumulation were observed in the 9·0 plants/m2 treatment, the average post-silking biomass accumulation increased from 11·4 to 12·2 t/ha (Figs 2(b), ( c ), ( e ) and ( f )). As a result, the biomass accumulation at maturity increased from 20·5 to 21·3 t/ha, and the kernel biomass of the ONR × 1·3 treatment was 0·7 t/ha higher than the 9·8 t/ha of the ONR treatment. In contrast, compared with the ONR treatment, no difference in the biomass accumulation and allocation to kernels was observed in the ONR × 1·3 treatment in the 6·0 and 7·5 plants/m2 treatments across the entire growth period.
Dynamics of canopy leaf area index and spike leaf SPAD (chlorophyll concentration) for different plant densities and nitrogen application rates
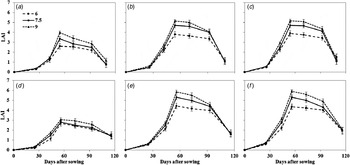
In both 2013 and 2014, plant density had a significant (P < 0·01) effect on canopy LAI (Fig. 3). In the ONR treatment, LAI of the 6·0 plants/m2 treatment was significantly (P < 0·01) lower than that of the 7·5 and 9·0 plants/m2 treatments across the entire growth period (Figs 3(b) and ( e )). Although the LAI of the 9·0 plants/m2 treatment was significantly (P < 0·01) higher than that of the 7·5 plants/m2 treatment before the milk (R3) stage, the average LAI of the 7·5 and 9·0 plants/m2 treatments decreased from 4·8 to 4·2, and 5·3 to 4·3, respectively, at the R5 stage. At maturity, similar LAIs were observed among different plant densities (1·4, 1·3 and 1·3 for 6·0, 7·5 and 9·0 plants/m2, respectively, Figs 3(b) and ( e )).
Maize canopy leaf area index (LAI) (±s.e.) development during the growing period under zero N (0 N), optimal N rate (ONR) and ONR × 1·3 for three plant densities during the 2-year study. (a–c) show the LAI for 0 N, ONR and ONR × 1·3 in 2013, respectively, and (d–f) show the LAI for 0 N, ONR and ONR × 1·3 in 2014, respectively.

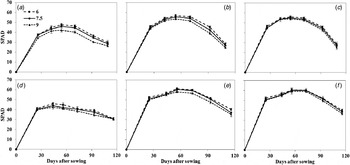
Leaf SPAD values (chlorophyll concentration) were significantly (P < 0·01) affected by plant density in both 2013 and 2014 (Fig. 4). For most growth stages in each growing season, leaf SPAD values declined with each incremental increase in plant density. However, for the ONR and ONR × 1·3 treatments in 2014, no difference was observed between the leaf SPAD values in the 6·0 and 7·5 plants/m2 treatments during the grain-filling period. In the ONR treatment, the average leaf SPAD values in the 7·5 plants/m2 treatment at the VT, R3, R5 and maturity stages were 57·9, 56·8, 46·5 and 32·0, respectively, significantly (P < 0·01) higher than the corresponding 55·8, 54·0, 43·2 and 30·2 in the 9·0 plants/m2 treatment across both growing seasons (Figs 4(b) and ( e )).
Maize leaf SPAD (±s.e.) development during the growing period under zero N (0 N), optimal N rate (ONR) and ONR × 1·3 for three plant densities during the 2-year study. (a–c)show the leaf SPAD for 0 N, ONR and ONR × 1·3 in 2013, respectively, and (d–f) show the leaf SPAD for 0 N, ONR and ONR × 1·3 in 2014, respectively.

The application of N fertilizer had a significant (P < 0·01) effect on the canopy LAI and leaf SPAD for all plant densities throughout the entire growth period (Figs 3 and 4). As the N application rate increased from the N 0 to the ONR treatment, both the canopy LAI and leaf SPAD significantly (P < 0·01) increased markedly for all plant densities (Figs 3(a), ( b ), ( d ) and ( e ) and 4(a), ( b ), ( d ) and ( e )). However, increasing the rate of N application from the ONR to the ONR × 1·3 treatment produced no further increase in canopy LAI and leaf SPAD in the 6·0 and 7·5 plants/m2 treatments across the entire growth period (Figs 3(b ), ( c ), ( e ) and ( f ) and 4(b), ( c ), ( e ) and ( f )). In contrast, the average canopy LAI for the 9·0 plants/m2 treatment increased from 4·31 to 4·62 and 1·31 to 1·69 at the R5 and maturity stages, respectively (Figs 3(b), ( c ), ( e ) and ( f )). Furthermore, the average leaf SPAD for the 9·0 plants/m2 treatment increased by 1·7 and 2·8 at the R3 and R5 stages, respectively, across 2013 and 2014 (Figs 4(b), ( c ), ( e ) and ( f )).
Pre- and post-silking nitrogen uptake for different plant densities and nitrogen application rates
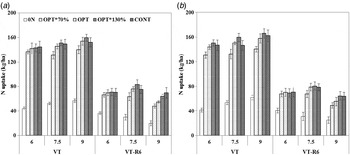
Nitrogen uptake was significantly (P < 0·05) affected by plant density (Fig. 5). The highest total N uptake, 194 kg/ha, was observed in the 7·5 plants/m2 treatment, which was 4·3 and 3·8% higher than that of 6·0 and 9·0 plants/m2 treatments, respectively, across the 2 years (Fig. 5). At silking, the average N accumulation rates were 122, 127 and 135 kg/ha for the 6·0, 7·5 and 9·0 plants/m2 treatments, respectively. Post-silking, the average N accumulation was 67 kg/ha for the 7·5 plants/m2 treatment, which was significantly higher than the 52 kg/ha for the 9·0 plants/m2 treatment.
Pre- and post-silking maize N uptake (±s.e.) as affected by different N management for three plant densities during the 2-year study. VT denotes the silking stage, and R6 donates the harvest (maturity) stage.

The pre- and post-silking N uptake was significantly (P < 0·01) affected by the N treatment strategy for all plant densities (Fig. 5). For the 6·0 plants/m2 treatment, the highest rates of pre-silking N uptake were observed in the ONR × 0·7 treatment in 2013, and ONR treatment in 2014, whereas the highest rate of post-silking N uptake was achieved in the ONR × 0·7 treatment in both 2013 and 2014. For the 7·5 plants/m2 treatment, the highest pre and post-silking N uptakes were achieved in the ONR treatment, whereas for the 9·0 plants/m2 treatment, an N application rate of ONR × 1·3 was required to produce the highest pre- and post-silking N uptake.
DISCUSSION
In the present study, the highest grain yield and NUE were achieved in the 7·5 plants/m2 treatment with 11·0 t/ha and 0·78 kg/kg, respectively; both the sub-optimal (6·0 plants/m2) and supra-optimal (9·0 plants/m2) plant densities resulted in reduced yield and NUE in both growing seasons. This is consistent with previous studies demonstrating that the response of maize grain yield to increasing plant density followed a parabolic curvilinear relationship (Tollenaar & Wu Reference Tollenaar and Wu1999; Sangoi et al. Reference Sangoi, Gracietti, Rampazzo and Bianchetti2002; Tokatlidis & Koutroubas Reference Tokatlidis and Koutroubas2004). The highest NUE, however, was observed in the highest plant density (10·0 plants/m2) by Ciampitti & Vyn (Reference Ciampitti and Vyn2011), which was related to higher N uptake with increased plant density (Boomsma et al. Reference Boomsma, Santini, Tollenaar and Vyn2009).
The maize grain yield was determined from the biomass accumulation and allocation to grain (Tollenaar Reference Tollenaar1991; Rajcan & Tollenaar Reference Rajcan and Tollenaar1999). In the present study, the 7·5 plants/m2 treatment displayed a higher biomass accumulation compared with that of the 6·0 plants/m2 treatment, which contributed to the higher grain yield in the former treatment. This is consistent with previous studies demonstrating that high-yield maize had higher biomass accumulation during the grain-filling period (Tollenaar Reference Tollenaar1991; Rajcan & Tollenaar Reference Rajcan and Tollenaar1999; Ding et al. Reference Ding, Wang, Jiang, Liu, Niu and Gao2005; Pommel et al. Reference Pommel, Gallais, Coque, Quillere, Hirel, Prioul, Andrieu and Floriot2006). When the plant density was further increased from 7·5 to 9·0 plants/m2, total biomass was similar, while a higher biomass accumulation from the R5 to maturity stage resulted in a higher yield for the 7·5 plants/m2 treatment.
Biomass accumulation depends primarily on radiation interception and radiation-driven photosynthetic conversion efficiencies, which are determined by the interaction between canopy LAI and single leaf productivity (Andrade et al. Reference Andrade, Uhart and Frugone1993, Reference Andrade, Calvino, Cirilo and Barbieri2002). Maddonni & Otegui (Reference Maddonni and Otegui1996) reported a critical LAI threshold in maize of almost 4·0, after which further increases in LAI were not reflected in increases in the proportion of intercepted radiation. In the present study, although the leaf SPAD for the 6·0 plants/m2 treatment was higher than that of the 7·5 and 9·0 plants/m2 treatments, the highest canopy LAI was <4·0, markedly lower than the 5·0 and 5·5 of the 7·5 and 9·0 plants/m2 treatments, respectively, which restricted the biomass production of the 6·0 plants/m2 treatment. In the 9·0 plants/m2 treatment, the canopy LAI decreased more rapidly than that of the 7·5 plants/m2 treatment during the grain-filling period, and leaf SPAD was consistently lower than that of the 7·5 plants/m2 treatment, both of which resulted in lower biomass accumulation of the 9·0 plants/m2 treatment during the grain-filling period. Similar results have been documented in former studies, i.e. that high plant density often accelerated leaf senescence (Borrás et al. Reference Borrás, Maddonni and Otegui2003; Antonietta et al. Reference Antonietta, Fanello, Acciaresi and Guiamet2014), and single plant productivity was restricted by leaf shading and competition for nutrients (Paponov & Engels Reference Paponov and Engels2003).
Nitrogen use efficiency and grain yield can be increased by better matching of temporal and spatial N supply with plant demand (Cassman et al. Reference Cassman, Dobermann and Walters2002; Tilman et al. Reference Tilman, Cassman, Matson, Naylor and Polasky2002; Chen et al. Reference Chen, Zhang, Römheld, Horlacher, Schulz, Böning-Zilkens, Wang and Claupein2006). Current results clearly demonstrated that the ONR treatment based on INM could satisfy maize N demand under the 7·5 plants/m2 treatment to achieve high grain yield and NUE. For the 6·0 plants/m2 treatment, however, the highest grain yield and NUE were observed in the ONR × 0·7 treatment because of lower N demand compared to the 7·5 plants/m2 treatment. In contrast, more N (ONR × 1·3) was required to achieve the highest grain yield in the 9·0 plants/m2 treatment because of the decreased root NUE (Rajcan & Tollenaar Reference Rajcan and Tollenaar1999). These results confirm the findings of previous studies reporting that mineral N application was more important for optimizing maize productivity at the supra-optimal than the sub-optimal or optimal plant density (Boomsma et al. Reference Boomsma, Santini, Tollenaar and Vyn2009). These results imply that the N management strategy should be determined based on both plant demand and plant NUE, which in turn are determined by factors such as plant density, variety and soil conditions (D'Andrea et al. Reference D'Andrea, Otegui and Cirilo2008).
According to the present study, a maize plant density of 7·5 plants/m2 combined with optimal management based on INM is an effective way to increase maize yield and NUE on the NCP. In the majority of maize fields on the NCP, however, the plant density is <5·0–6·0 plants/m2 (Li & Wang Reference Li and Wang2009), and the rate of N application is as high as 250 kg/ha (Cui Reference Cui2005), both of which lead to low grain yield and NUE (Cui Reference Cui2005; Meng et al. Reference Meng, Hou, Wu, Chen, Cui and Zhang2013). In contrast, in some high-yield maize studies, a super-high plant density (as high as 10 plants/m2) produced a grain yield of 15·2 t/ha (Chen Reference Chen1995; Chen et al. Reference Chen, Cui, Vitousek, Cassman, Matson, Bai, Meng, Hou, Yue, Römheld and Zhang2011), whereas when up to 747 kg/ha N fertilizer was applied in these studies, extremely low NUE resulted (Chen et al. Reference Chen, Cui, Vitousek, Cassman, Matson, Bai, Meng, Hou, Yue, Römheld and Zhang2011).
CONCLUSION
On the NCP, low plant density (5·0–6·0 plants/m2) and over-application of N fertilizer (~250 kg/ha) have commonly been used by the majority of farmers, both of which restrict yield and NUE. The current results demonstrated that a maize plant density of 7·5 plants/m2 produced optimum biomass accumulation and allocation to grains to achieve optimum grain yield and increased N uptake during the post-silking period to achieve optimum NUE, whereas further increases in plant density caused a reduction in both yield and NUE. In terms of N management strategy, in the 7·5 plants/m2 treatment, the ONR based on INM significantly decreased the rate of N application without yield loss compared with the current standard practice on the NCP of excessive N application. In the 6·0 plants/m2 treatment, less N fertilizer (ONR × 0·7) should be applied to achieve the optimum grain yield and NUE because of the lower N demand compared with the 7·5 plants/m2 treatment. However, more N fertilizer is required to achieve the optimum grain yield for the ONR × 1·3 compared with the 7·5 plants/m2 treatment, which was related to the lower N uptake efficiency during the post-silking stage.
This work was funded by Hundred-Talent Programme of Shanxi Province, the Special Fund for the Agricultural Profession (grant no. 201303103), National Natural Science Foundation of China (grant no. 31172036) and the Innovation Group Grant of the National Natural Science (grant no. 31121062).