Introduction
Radiative and turbulent energy fluxes are vital components of the surface energy balance. Small changes in the surface energy fluxes can lead to changes in the overall energy balance and ultimately can affect climate. In the polar regions, these energy fluxes are directly related with the accumulation and ablation processes at the ice or snow surface and are helpful in monitoring the health of glaciers and ice sheets. Many studies of the summer and annual surface energy balance of different parts of Antarctica have been reported (Bintanja Reference Bintanja1995, Bintanja & Van den Broeke Reference Bintanja and van den Broeke1995, Bintanja et al. Reference Bintanja, Jonsson and Knap1997, Reference Bintanja2000, Reijmer & Oerlemans Reference Reijmer and Oerlemans2002, Van den Broeke et al. Reference Van den Broeke, Reijmer and van de Wal2004, Reference Van den Broeke, Reijmer, van As, van de Wal and Oerlemans2005, Reference Van den Broeke, Reijmer, van As and Boot2006, Van As et al. Reference Van As, van Den Broeke and van de Wal2005, Gusain et al. Reference Gusain, Singh, Mishra, Srivastava and Ganju2009, Reference Gusain, Mishra and Negi2011, Kuipers Munneke et al. Reference Kuipers Munneke, van Den Broeke, King, Gray and Reijmer2012). It has been observed that radiative and turbulent energy fluxes are dependent on the location, surface characteristics and local weather conditions and vary from the Antarctic coast to high Antarctic Plateau.
Antarctic coastal regions are characterized by mild temperatures and high katabatic winds while the Antarctic Plateau is characterized by cold temperatures and low wind speeds. Approximately 2% of the Antarctic continent is in ice-free areas, also known as oases. The McMurdo Dry Valleys (c. 4800 km2) are the largest (Drewry et al. Reference Drewry, Jordan and Jankowski1982) and Schirmacher Oasis (c. 35 km2) is one of the smallest (Tyagi et al. Reference Tyagi, Singh and Mohapatra2011) oases in Antarctica. Surface energy balance of the McMurdo Dry Valley glaciers have been studied by many researchers (Lewis et al. Reference Lewis, Fountain and Dana1998, Hoffman et al. Reference Hoffman, Fountain and Liston2008, Bliss et al. Reference Bliss, Cuffey and Kavanaugh2011), who have observed that sublimation dominates the surface mass balance of the ablation zone. Gusain et al. (Reference Gusain, Singh, Mishra, Srivastava and Ganju2009) reported surface energy and mass balance of the ice sheet close to Schirmacher Oasis during the summer of 2007–08 and reported a high ablation rate for the ice sheet. Dakshin Gangotri Glacier, a part of the ice sheet close to the Schirmacher Oasis, is reported to be retreating with varying rates during different years in the past around the glacier tongue (Shrivastava et al. Reference Shrivastava, Asthana and Roy2011). The surface energy fluxes of the ice sheet close to ice-free areas (oases) or dry valleys will be of interest in such cases of retreating ice sheet and growing oasis areas.
This paper investigates the temporal, seasonal and diurnal variations of the meteorological parameters, radiative and turbulent energy fluxes of the ice sheet close to Schirmacher Oasis. The energy fluxes are analysed for the summer season (November, December, January, February), winter season (May, June, July, August), transition period from summer to winter (March, April; hereafter referred to as transition 1), and transition period from winter to summer (September, October; hereafter referred to as transition 2). The results are also compared with other studies of the ice sheet close to ice-free areas and coastal areas of Antarctica.
Observation site and instrumentation
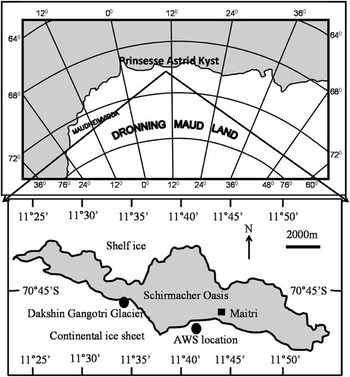
An automatic weather station (AWS) manufactured by Sutron was installed on the ice sheet close to Schirmacher Oasis during summer 2007. The AWS site (Dozer point, unofficial name) is at 70°46′05.1′′S, 11°42′12.2′′E (Fig. 1) at an altitude of 142 m above mean sea level. Schirmacher Oasis (70°44′–70°46′S, 11°24′–11°54′E) is about 16 km long in an east–west direction with maximum width of about 3 km, and about 70 km south from the Princess Astrid Coast in east Dronning Maud Land, Antarctica. It is a small moraine covered rocky area having low lying hills. More than 80% area of the oasis is covered with snow during winter which melts off during summer. Snow also accumulates on the ice sheet adjacent to the oasis and melts off in summer. The amount of snow accumulation varies annually and depends on the number of snow storms. Hourly observations of the snow meteorological parameters were recorded by the AWS. Wind speed and direction were measured with RM Young 05103 3-cup anemometers and wind vane. This sensor can record wind speed in the range of 0–50 m s-1 with an accuracy of ± 0.3 m s-1 and direction with an accuracy of ± 3°. Air temperature and relative humidity were measured with a Campbell Scientific 41372V-90 AT/Rh sensor having accuracy of ± 0.3°C and ± 3–4% respectively. Incoming solar radiation and reflected solar radiation were measured with a Kipp & Zonen CM3 albedometer with an accuracy of ± 10%. Air pressure and glacier surface temperature were measured with an Anika PTB210B2A1B and Everest 4000, with sensor accuracies of 0.5 mBar and ± 0.1–0.3°C, respectively. Hourly observations of cloud amount and type were recorded conventionally at the Indian Maitri Station, c. 1 km from the AWS site.
Observation site, south of the Princess Astrid Coast (Prinsesse Astrid Kyst).

Methodology
The method of estimation of incoming and outgoing longwave fluxes and turbulent energy fluxes are given in detail in Gusain et al. (Reference Gusain, Singh, Mishra, Srivastava and Ganju2009), and summarized here. Net radiation shortwave flux is estimated by the equation:
 $${\rm{SH}}{{{\rm{W}}}_{{\rm{net}}}}\: = \:{\rm{SHW}}\!\!\downarrow {\rm{ \,{\hbox-}\, }}\, {\rm{SHW}}\!\!\uparrow \, = \, {\rm{SHW}}\!\!\downarrow \!(1\, {\rm{ \,{\hbox-}\, }}\, {\rm{\alpha }}),\eqno\rm$$
where α is albedo of the surface. Incoming shortwave radiation flux (SHW↓) and outgoing shortwave radiation flux (SHW↑) were measured directly from the albedometer.
The downwelling longwave radiation flux (LW↓) was estimated using a model developed by Prata (Reference Prata1996). The model computes emissivity of the atmosphere (
 $$\[--><$>\repsi<$><!--$$
m) depending on precipitable water content (w) and is given by:
 $$ {\rm{LW}}\!\!\downarrow \, = \, {{ \repsi }_{\rm{m}}}\,{\rm{\rsigma }}\,{\rm{T}}_{{\rm{a}}}^{{\,\,\rm{4}}}, \eqno\rm$$
where
 $${{ \repsi }_{\rm{m}}}\, = \, {\rm{1 \,{\hbox-}\, (1}}\, {\rm{ + }}\, {\rm{w)}}\,{\rm{exp\{ \,{\hbox-}\, (1}}{\rm{.2}}\, + \, {\rm{3}}{\rm{.0w}}{{{\rm{)}}}^{1/2}}} \}, \eqno\rm$$
and
 $${\rm{w}}\, = \, 46.5\,({{{\rm{e}}}_{\rm{a}}}\, /\, {{{\rm{T}}}_{\rm a}).\eqno\rm$$
ea is vapour pressure (Pa) and Ta the absolute temperature measured at screen level height (c. 2 m) above surface.
Emitted longwave radiation (LW↑) was computed as:
 $${\rm{LW}}\!\!\uparrow \, = \, {{ \repsi }_{\rm{s}}}\,{\rm{\rsigma }}\,{\rm{T}}_{{\rm{s}}}^{{\,\,\rm{4}}}, \eqno\rm$$
where σ is the Stephan-Boltzmann constant (5.67 x 10⁻⁸ W m-2 K-4), Ts the radiative temperature of the surface in kelvins and ɛs the surface emissivity. The surface emissivity of the snow/ice surface is assumed to be unity (Bintanja & Van den Broeke Reference Bintanja and van den Broeke1994).
On a cloud free day, the net longwave radiation absorbed by the glacier surface is:
 $${\rm{L}}{{{\rm{W}}}_{{\rm{net}}}}\, = \, {\rm{LW}}\!\!\downarrow {\rm{ {\hbox-}\, }} {\rm{LW}}\!\!\uparrow \eqno\rm$$
 $$ = \,{{ \repsi }_{\rm{m}}}\,{\rm{\rsigma }}\,{\rm{T}}_{{\rm{a}}}^{{\rm{\,\,4}}} {\rm{ \,{\hbox-}\, }} {{ \repsi }_{\rm{s}}}\,{\rm{\rsigma }}\,{\rm{T}}_{{\rm{s}}}^{{\,\,\rm{4}}} .\eqno\rm$$
In overcast sky conditions the net longwave radiation is given by:
 $${\rm{L}}{{{\rm{W}}}_{{\rm{net}}}}\, = \, ({{ \repsi }_{\rm{m}}}\,{\rm{\rsigma }}\,{\rm{T}}_{{\rm{a}}}^{{\rm{\,\,4}}} \, {\rm{ {\hbox-} }}\, {{ \repsi }_{\rm{s}}}\,{\rm{\rsigma }}\,{\rm{T}}_{{\rm{s}}}^{{\rm{\,\,4}}} )({\rm{1}}\, {\rm{ {\hbox-} }}\, {\rm{kN)}},\eqno\rm$$
where the coefficient k depends on type and height of clouds, and N is the amount of cloudiness in terms of fraction of sky covered. Experimental values reported by the US Army Corps of Engineers (1956) are (Upadhyay Reference Upadhyay1999): k = 0.76 for low clouds, k = 0.52 for medium clouds, and k = 0.26 for high clouds.
Net radiative flux (Rnet) in the model was computed as:
 $${{{\rm{R}}}_{{\rm{net}}}}\, = \, {\rm{SHW}}\!\!\downarrow\!\!(1\, {\rm{ {\hbox-} }}\, {\rm{\alpha )}}\, + \, {\rm{(}}{{ \repsi }_{\rm{m}}}\,{\rm{\rsigma }}\,{\rm{T}}_{{\rm{a}}}^{{\rm{\,\,4}}} \, {\rm{ {\hbox-} }}\, {{ \repsi }_{\rm{s}}}\,{\rm{\rsigma }}\,{\rm{T}}_{{\rm{s}}}^{{\rm{\,\,4}}} )({\rm{1}}\, {\rm{ {\hbox-} }}\, {\rm{kN)}}{\rm{.}}\eqno\rm$$
Sensible heat flux and the latent heat flux are the turbulent energy fluxes. The vertical turbulent sensible heat flux was estimated (Ambach & Kirchlechner Reference Ambach and Kirchlechner1986, Paterson Reference Paterson1994) as:
 $${\rm{SHF}}\, = \, ({{{\rm{C}}}_{\rm{p}}}\,{{{\rm{\rrho }}}_{\rm{0}}}\, /\, {{{\rm{P}}}_{\rm{0}}})\,{{{\rm{K}}}_{\rm{n}}}\,{\rm{P}}\,{\rm{u}}\,{\rm{(}}{{{\rm{T}}}_{\rm{a}}}\, {\rm{ {\hbox-} }}\, {{{\rm{T}}}_{\rm{s}}})\eqno\rm$$
 $${{{\rm{K}}}_{\rm{n}}}\, = \, {{{\rm{k}}}^{\rm{2}}} \, /\, {{[\log ({{{\rm{z}}}_{\rm{a}}}\, /\, {{{\rm{z}}}_{\rm{0}}})]}^{\rm{2}}}, \eqno\rm$$
where Cp is the specific heat of air (1005 J kg-1 K-1) at constant pressure, ρ0 is the density of air (1.29 kg m-3) at the standard atmospheric pressure P0 (1.013 x 10⁵ Pa), Kn is a dimensionless transfer coefficient, P is mean atmospheric pressure (Pa) at the measuring site, u and Ta are measured wind speed and air temperature at a height of 2 m above the glacier surface respectively, k is von Karman's constant (0.41), za is sensor height above ground (2 m) and z0 is aerodynamic roughness length. We choose a value of z0 = 1 mm for the present study site based on best model agreement with measurements of ablation (Gusain et al. Reference Gusain, Singh, Mishra, Srivastava and Ganju2009).
Latent heat flux was estimated as:
 $${\rm{LHF}}\, = \, {{{\rm{L}}}_{\rm{v}}}\,(0.623{{{\rm{\rrho }}}_{\rm{0}}}\, /\, {{{\rm{P}}}_{\rm{0}}})\,{{{\rm{K}}}_{\rm{n}}}\,{\rm{u}}\,{\rm{(}}{{{\rm{e}}}_{\rm{a}}}\, {\rm{ {\hbox-} }}\, {{{\rm{e}}}_{\rm{s}}}),\eqno\rm$$
where Lv is the latent heat of vaporization, ea is the vapour pressure at height z above glacier surface and es is the saturation vapour pressure at the glacier surface. es is a function of the surface temperature and is 611 Pa for a melting surface (Paterson Reference Paterson1994). For distinguishing sublimation and condensation, guidelines given by Ambach & Kirchlechner (Reference Ambach and Kirchlechner1986) and Greuell & Konzelmann (Reference Greuell and Konzelmann1994) were followed. When (ea - es) is positive, and Ts = 0°C, water vapour condenses as liquid water on the melting glacier surface with Lv = 2.514 MJ kg-1; when (ea - es) is negative, there is sublimation with Lv = 2.849 MJ kg-1. Also, when (ea - es) is positive and Ts < 0°C, there is deposition from vapour to solid ice with Lv = 2.849 MJ kg-1.
The equations of sensible and latent heat fluxes are applicable for neutral atmospheric conditions. Stability corrections were applied using the transfer coefficient Kn in terms of bulk Richardson number (Ri). For unstable conditions (Ri < 0) the effective transfer coefficient is given by Kn.(1 - 10Ri); for neutral condition (Ri = 0) it is given by Kn; and for stable conditions (Ri > 0) it is given by Kn / (1 + 10Ri) (Price & Dunne Reference Price and Dunne1976).
Results
Meteorological parameters
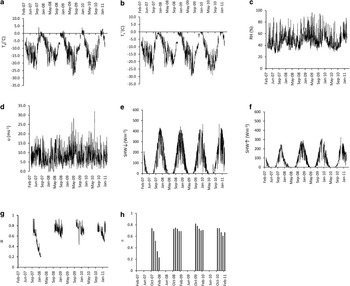
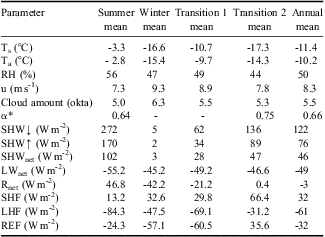
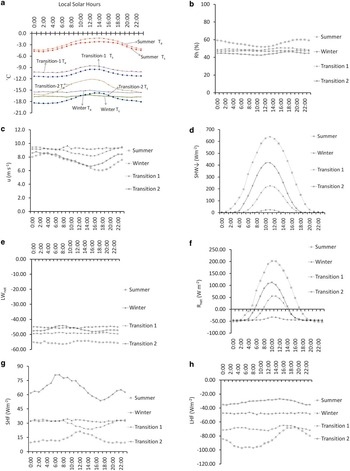
Daily averages of Ts (Tsd) and Ta (Tad) at the study location from 1 March 2007–28 February 2011 are shown in Fig. 2. Table I shows the averages during different seasons. Over the entire record, averages of Ta and Ts were -10.2°C ± 7°C (mean ± standard deviation) and -11.4°C ± 7.4°C respectively. Diurnal variation in the Ta and Ts are shown in Fig. 3 during the different seasons. The amplitude of diurnal variation of Ta and Ts were highest during the transition 2 period (2.0°C and 1.4°C) followed by summer (1.6°C and 1.3°C) and transition 1 (0.9°C and 1.0°C) periods. The lowest amplitude was observed during the winter period (0.35°C and 0.3°C).
Daily averages of a. Ta (the absolute temperature measured at screen level height (c. 2 m) above surface), b. Ts (the radiative temperature of the surface), c. RH (relative humidity), d. u (wind speed), e. SHW↓ (incoming shortwave radiation flux), f. SHW↑ (outgoing shortwave radiation flux), g. α (albedo of the surface), and h. monthly mean α.

Seasonal and annual mean of meteorological parameters and energy fluxes over four years.
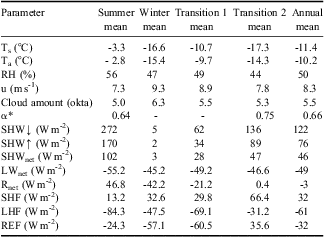
Ts = the radiative temperature of the surface, Ta = the absolute temperature measured at screen level height (c. 2 m) above surface, RH = relative humidity, u = wind speed, α = albedo of the surface, SHW↓ = incoming shortwave radiation flux, SHW↑ = outgoing shortwave radiation flux, SHWnet = net shortwave radiation flux, LWnet = net longwave radiation flux, Rnet = net radiative flux, SHF = sensible heat flux, LHF = latent heat flux, REF = residual energy flux.
*Mean albedo for the days of the season when mean daily solar zenith angle is < 80°.
Diurnal variation in a. Ta (the absolute temperature measured at screen level height (c. 2 m) above surface) and Ts (the radiative temperature of the surface), b. RH (relative humidity), c. u (wind speed), d. SHW↓ (incoming shortwave radiation flux), e. LWnet (net downwelling longwave radiation flux), f. Rnet (net radiative flux), g. SHF (sensible heat flux), and h. LHF (latent heat flux) during different seasons.

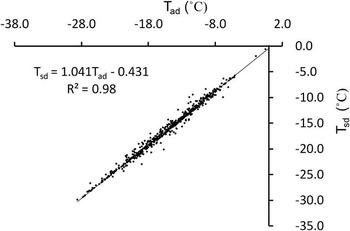
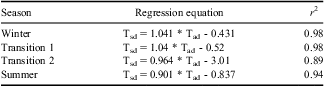
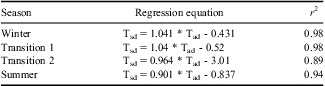
High correlation (r 2 0.89–0.98) was observed between Tad and Tsd for different seasons and Fig. 4 shows the correlation for winter season. Regression equation for each season was obtained and given in Table II.
Correlation between Tad (daily average of Ta) and Tsd (daily averages of Ts) during winter season. Ta = the absolute temperature measured at screen level height (c. 2 m) above surface; Ts = the radiative temperature of the surface.

Regression equation between Tsd and Tad for different seasons. Tsd = daily average of Ts (the radiative temperature of the surface), and Tad = daily average of Ta (the absolute temperature measured at screen level height (c. 2 m) above surface).
Daily mean relative humidity (RH) varied from 26–97% (Fig. 2c) during the study period and monthly averaged RH varied from 35–62%. In general the air close to the oasis is dry with four-year mean RH of 50%. Relative humidity was higher during summer than in other seasons (Table I). Figure 3b shows the mean diurnal variation in RH during different seasons. The amplitude of the diurnal cycle for summer, winter, transition 1 and transition 2 seasons were 4%, 0.5%, 1.5% and 2% respectively.
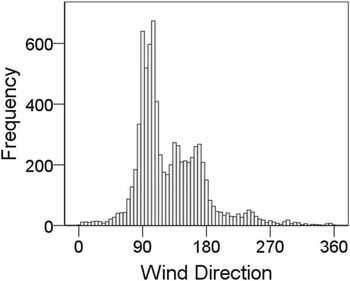
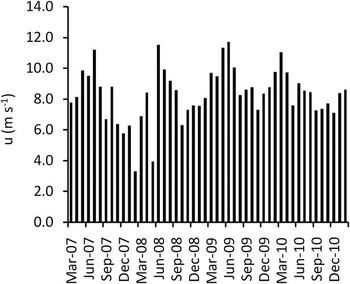
Daily mean wind speed (u) was recorded up to 32 m s-1 (Fig. 2d) at the study site and major wind directions were east, south-east and south (Fig. 5). Monthly averaged u varied from 3.2–11.7 m s-1 with a four-year average of 8.3 m s-1. A seasonal cycle was observed in the wind speed and during winter season wind was high compared to other seasons (Fig. 6). Diurnal variation was observed in the wind speed and Fig. 3c shows the diurnal variation during seasons. The amplitude of the diurnal cycle was 1.25 m s-1 for summer, 0.25 m s-1 for winter, 0.65 m s-1 for transition 1 and 1.1 m s-1for transition 2 seasons.
Wind directions at the study location. The frequency on the y-axis is in hours.

Monthly mean u (wind speed).

High seasonal and short-term variability was observed in SHW↓ and SHW↑ at the study site (Fig. 2e & f). Hourly mean SHW↓ (not shown) were up to 1100 W m-2, while daily averages were up to 499 W m-2 (Fig. 2e) with a four-year mean of 122 W m-2. As expected SHW↓ was highest during summer season, followed by transition 2 and transition 1 periods, and was almost zero for the winter months. Figure 3d shows the diurnal variation of SHW↓ during different seasons. The amplitude of the diurnal cycle during summer, winter, transition 1 and transition 2 periods were 318 W m-2, 12.5 W m-2, 112 W m-2 and 209.5 W m-2 respectively. Mean top of the atmosphere insolation was calculated at the location using mean Earth-Sun distance, solar constant and solar zenith angle values during the seasons. An overall transmissivity of 0.65, 0.6 and 0.72 were observed during summer, transition 1 and transition 2 periods respectively. The mean annual atmospheric transmissivity at the observation location was observed as 0.659 for all sky days and 0.8 for clear sky days.
Hourly and daily mean SHW↑ measured at our site varied up to 732 W m-2 and 385 W m-2 respectively with four-yearly average of 76 W m-2. Daily and monthly mean albedo of the glacier surface is shown in Fig. 2g & h respectively, for the days when mean daily solar zenith angle is < 80°. Albedo varied from 0.19–0.93 with mean annual albedo of 0.66 during four years. High interannual variation was observed in the albedo values and summer 2007–08 was exceptionally low, with mean albedo of 0.44. Mean albedo values during the summer of 2008–09, 2009–10 and 2010–11 were 0.72, 0.73 and 0.67 respectively.
Most of the days were observed partly cloudy to cloudy at the observation location and only 188 days were observed cloud free in the four years. Mean seasonal cloud amount was 5.5 okta, 5.3 okta, 6.3 okta and 5.0 okta during transition 1, transition 2, winter and summer seasons respectively (Table I).
Radiative energy fluxes
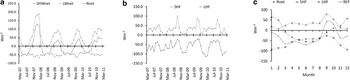
Figure 7a shows the temporal variation of net shortwave radiation flux (SHWnet), net longwave radiation flux (LWnet) and net radiation flux (Rnet). Hourly and daily mean SHWnet varied up to 765 W m-2 and 272 W m-2 respectively with a four-year average of 46 W m-2. Mean seasonal SHWnet was observed as 102 W m-2, 3 W m-2, 28 W m-2 and 47 W m-2 for summer, winter, transition 1 and transition 2 periods respectively.
Monthly mean a. radiative, and b. turbulent energy fluxes. c. Mean annual cycle of surface energy fluxes.

Seasonal variability in the LWnet was also observed. Net longwave radiation flux was high during the summer period compared to other seasons. Hourly LWnet varied from -12 W m-2 to -94.4 W m-2 and the daily mean LWnet varied from -14 W m-2 to -81 W m-2 with a four-year average of -49 W m-2. Figure 3e shows diurnal variation of LWnet during different seasons. The amplitude of the diurnal cycle of LWnet was 1.1 W m-2, 0.7 W m-2, 0.5 W m-2 and 2 W m-2 for the summer, winter, transition 1 and transition 2 periods, respectively. A strong seasonal cycle in Rnet was observed and during October, November, December, January and February months Rnet was positive at the site. The amplitude of the diurnal cycle was 128.2 W m-2, 6.1 W m-2, 52 W m-2 and 80.3 W m-2 for summer, winter, transition 1 and transition 2 seasons, respectively and net radiation was positive for about 14 hours, 7 hours and 10 hours during summer, transition 1 and transition 2 seasons, respectively in the diurnal cycle (Fig. 3f).
Turbulent energy fluxes
High temporal variability was observed in the sensible heat flux (SHF) and latent heat flux (LHF) (Fig. 7b). A strong seasonal cycle was observed in the SHF during all four years. Sensible heat flux was smallest during the summer period and gradually increased during the transition 1 and winter periods, reaching maximum values during transition 2 periods. Monthly average value of sensible heat flux varied from 1.3–101 W m-2 with a four-year average of 32 W m-2. Figure 3g shows the diurnal variation of SHF during different seasons and amplitude during summer, winter, transition 1 and transition 2 periods was 6 W m-2, 1.6 W m-2, 5.1 W m-2 and 13.6 W m-2 respectively.
Latent heat flux was evaluated using Eq. (12). Monthly average LHF varied from -21.2 W m-2 to -115.4 W m-2 with four-yearly mean of -61.3 W m-2. Latent heat flux was observed high during the summer period (seasonal mean -84.3 W m-2) followed by transition 1 (seasonal mean -69.1 W m-2), winter (seasonal mean -47.5 W m-2) and transition 2 (seasonal mean -31.2 W m-2) periods. Figure 3h shows diurnal variation of LHF during different period and amplitude of diurnal cycle was 14.8 W m-2, 1.5 W m-2, 3.8 W m-2 and 4.4 W m-2 for the summer, winter, transition 1 and transition 2 periods respectively.
Energy budget closure
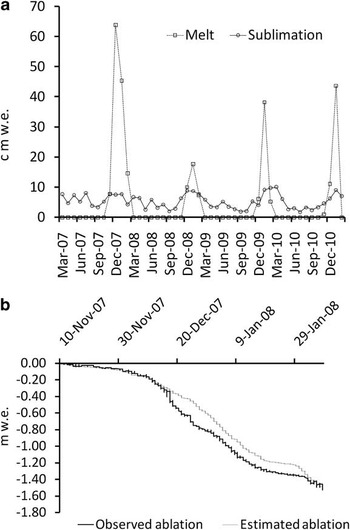
Net energy balance at the glacier surface is sum of Rnet, SHF, LHF and sub-surface heat flux (G) and termed as residual energy flux (REF) (mean annual cycle is shown in Fig. 7c). Positive REF is the energy available for melt if glacier surface temperature is at 0°C. Supposing the ground heat flux to be zero, hourly melt was estimated from the REF at the glacier surface for the four years. Sublimation was estimated from LHF. Monthly estimated sublimation and melt is shown in Fig. 8a. Melt was observed during summer season only and December and January are the months with highest melt rate. Sublimation was observed highest during summer season and lowest during transition 2 period. Estimated ablation (sum of sublimation and melt) at the glacier surface was compared with recorded ablation from the ultrasonic sensor for a limited period (Fig. 8b) at the study location. A high correlation coefficient (r 2 = 0.97) was observed between estimated and recorded ablation (Fig. 8b) and model estimated 1.51 m water equivalent (w.eq.) from 10 November 2007–7 February 2008 against 1.53 m w.eq. recorded ablation. Mean monthly residual energy flux was observed positive for transition 2 period and negative for the rest of the seasons over four years.
a. Monthly estimated sublimation and melt, and b. observed and estimated ablation.

Discussion
Meteorological parameters
Large short-term variability and a strong annual cycle were observed in the Ta and Ts for all the four years. Radiative heating during summer caused Ta to reach its maximum daily average value above 4.0°C at the study site. Absence of shortwave radiation and continuous longwave cooling of the surface caused Ta to dip down below -20°C during winter. August and September were the coldest months during all the four years. It is because the energy loss by net longwave radiation dominates over energy gained by net shortwave radiation till the month of September. From October onwards net radiation becomes a heat source to the glacier as energy gained by net shortwave radiation flux dominates energy loss due to net longwave radiation flux. The high amplitudes of diurnal variation in Ta and Ts during summer and transitions periods were due to high diurnal variation in solar heating. The maximum temperature that occurred in the diurnal cycle was around local solar noon. The average value of Ta was higher compared to the average value of Ts in the diurnal cycle for all the seasons at the observation location, which contributed to the downward sensible heat flux.
Daily mean RH also exhibits large short-term variability and seasonal cycle. High diurnal variation in RH during summer corresponds to high diurnal variation in radiation and low katabatic winds. Low diurnal variation during winter may be due to high katabatic winds causing air moisture to be well mixed in the boundary layer. Relative humidity was high during summer months when there was warm air advection and events with more than 80% daily averaged RH at the observation location correspond to the passage of cyclonic storms. Cyclonic events are generally more frequent in coastal stations compared to the interior part of Antarctica. The dominant wind direction was from the east during cyclonic events at the observation location and Reijmer & Van den Broeke (Reference Reijmer and van den Broeke2001) found that the source region of the moisture in Dronning Maud Land is most probably the Atlantic Ocean.
Strong katabatic winds were observed at the study location due to its topographic setting down a steep slope from the Antarctic Plateau. The wind is characterized by short period of calm and light wind followed by a period of high wind. Generally, high wind events correspond to passage of low pressure systems (Tyagi et al. Reference Tyagi, Singh and Mohapatra2011) at the observation site. High diurnal variation in wind speed during summer and transition periods corresponds to high diurnal variation in insolation. Insolation heats the glacier surface and destroys the surface temperature inversion which results in weakening of the katabatic forcing. Low wind speed in the afternoon during summer and transition periods corresponds to weakening of katabatic forcing, which may be due to break-up of surface inversion (Zhou et al. Reference Zhou, Zhang, Zhong, Lenschow, Hsu, Sun, Gao, Li, Bian and Yu2009).
Seasonal variability in SHW↓ is mainly associated with annual variation in mean solar zenith angle. Short-term variation is due to frequent passage of frontal systems and clouds (Van den Broeke et al. Reference Van den Broeke, Reijmer and van de Wal2004). Annual mean SHW↓ at the site (122 W m-2) was similar to the values of 121.3 W m-2 and 127.2 W m-2 at the coastal locations reported by Van den Broeke et al. (Reference Van den Broeke, Reijmer and van de Wal2004). In the diurnal cycle, SHW↓ was more than 120 W m-2 for 15 hours during summer, and 7 and 10 hours during transition 1 and transition 2 seasons respectively. These values can be generalized as average sunshine hours for these seasons. The diurnal variations in incoming shortwave radiation flux during the seasons were in good correspondence with the diurnal variation in solar zenith angle. The mean annual atmospheric transmissivity (0.659) at the observation location is comparable with the value of 0.666 at the AWS 5 location and 0.632 at the AWS 4 location in coastal Antarctica reported by Van den Broeke et al. (Reference Van den Broeke, Reijmer and van de Wal2004). Outgoing shortwave radiation flux mainly depends on SHW↓ and surface characteristics. Outgoing shortwave radiation flux at the study location was low, with an annual mean of 76 W m-2 compared to the values of 105.9 W m-2 and 106.5 W m-2 reported by Van den Broeke et al. (Reference Van den Broeke, Reijmer and van de Wal2004). This was due to low albedo at the study location compared to the coastal location reported by Van den Broeke et al. (Reference Van den Broeke, Reijmer and van de Wal2004) where mean annual albedo was 0.837. The albedo at the present study location was comparable with the albedo at Taylor Glacier, McMurdo Dry Valleys, reported by Bliss et al. (Reference Bliss, Cuffey and Kavanaugh2011). The present location is very close to the ice-free area of the Schirmacher Oasis and windblown dust or debris events may also contribute to low albedo values, as well as contributing to melting of the glacier surface (Gusain et al. Reference Gusain, Singh, Mishra, Srivastava and Ganju2009).
Surface energy fluxes
Net shortwave radiation flux for the summer months of 2007–08 was high compared to other years as, during this particular season, albedo values were exceptionally low. A rise in Ta up to 6.5°C in the first week of November 2007 started early melting of the ice sheet and triggered a positive feedback loop of albedo causing excessive melting during the season (Gusain et al. Reference Gusain, Singh, Mishra, Srivastava and Ganju2009). Net longwave radiation flux was high during the summer period compared to other seasons, due to high surface temperature of the glacier. High diurnal variation in LWnet during transition 2 and summer was due to high diurnal variations in the Ta and Ts during these periods. Net radiation flux line (Fig. 7a) changes from positive to negative twice a year during all four years. At these points Rnet is zero and SHWnet balances the LWnet. Above these points SHWnet dominates LWnet and glacier surface absorbs radiation. Absorbed radiation increases the glacier surface temperature and melting will start when the surface temperature reaches 0°C. Below these points LWnet dominates the SHWnet and the glacier surface loses energy, tending to decrease the surface temperature. The time when Rnet varied from negative to positive in a year is different for all the four years. High diurnal variations during the transition periods and summer in Rnet were due to high diurnal variations in SHWnet during these periods. The net radiative flux was the main heat source to the glacier during summer (46.8 W m-2) and heat sink during winter (-42.2 W m-2) and transition 1 (-21.2 W m-2) periods. Net shortwave radiation flux almost balances net longwave radiation flux during transition 2 period. Sensible heat flux was high during transition 2 period due to higher difference between Ts and Ta during this period. High diurnal variation in Ts and Ta during the transition 2 period also causes high diurnal variation in SHF. Comparatively low values of LHF during transition 2 period and winter season were due to low values of Ts during this period. High diurnal variation in LHF during summer may be as a result of high diurnal variation in surface temperature and wind speed. During summer season REF was positive for a few hours of the day and during these hours melt was observed, although mean monthly REF was negative. During transition 2, positive REF (Fig. 7c) was used to raise the Ts of the glacier as during this season very low Ts was observed.
Comparison with other Antarctic locations
Results of the present study were compared with other coastal locations and locations close to oases or dry valleys. Van den Broeke et al. (Reference Van den Broeke, Reijmer and van de Wal2004, Reference Van den Broeke, Reijmer, van As, van de Wal and Oerlemans2005) presented results from four AWSs installed in Dronning Maud Land. We have compared our results with AWS 5 as it was located just inland of the grounding line in the coastal katabatic wind zone of the ice sheet. Comparison of the annual meteorological variables and surface energy fluxes are shown in Table III. The present study location at Schirmacher Oasis has comparatively mild temperatures, low relative humidity and high wind speed. Higher net shortwave radiation flux at the present study location is because of low albedo values. Energy loss due to longwave radiation is also high at the present study location. Annual mean net longwave radiation flux at AWS 5 was reported as -36.3 W m-2 (Van den Broeke et al. Reference Van den Broeke, Reijmer and van de Wal2004), whereas, at the station presented in this paper, it is -49 W m-2. The difference of 12.7 W m-2 in the net longwave radiation flux may be as a result of a combination of factors, e.g. differences due to surface temperature, air temperature and atmospheric emissivities at both the locations may result in a difference of c. 4 W m-2 in net longwave radiation flux. This has been calculated using mean annual temperature and relative humidity conditions at the present study location and AWS 5 location. Cloud amount and type affects longwave radiation flux significantly and differences in cloud cover at both the locations will also contribute to differences of net longwave radiation flux. As data of cloud cover for AWS 5 location is not available for the data period presented in this paper, it is difficult to quantify the difference in net longwave radiation flux due to cloud amount and type. Parameterization schemes used for estimation of longwave radiation fluxes are also sources of error. Niemelä et al. (Reference Niemelä, Räisänen and Savijärvi2001) presented comparison of several longwave downwelling radiative flux parameterizations with hourly averaged pointwise surface-radiation observations. We have used Prata's (1996) scheme to estimate downwelling longwave radiation flux for clear sky days. Niemelä et al. (Reference Niemelä, Räisänen and Savijärvi2001) reported bias of -5 W m-2, standard deviation of 8.4 W m-2, and RMS difference of 9.8 W m-2 to Prata's scheme compared with surface observations during summer 1997 period at Sodankylyä, Finland. For cloudy sky conditions the uncertainty in the estimated longwave flux will be higher.
Mean annual comparison of the present study with coastal site location in western Dronning Maud Land (WDML) and Bunger Hills Oasis.
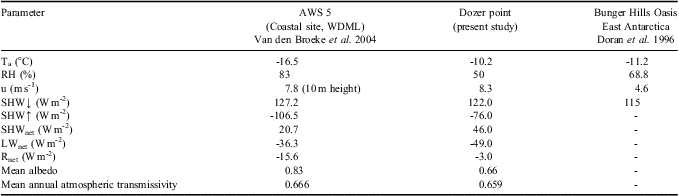
Ta = the absolute temperature measured at screen level height (c. 2 m) above surface, RH = relative humidity, u = wind speed, SHW↓ = incoming shortwave radiation flux, SHW↑ = outgoing shortwave radiation, SHWnet = net shortwave radiation flux, LWnet = net longwave radiation flux, Rnet = net radiative flux.
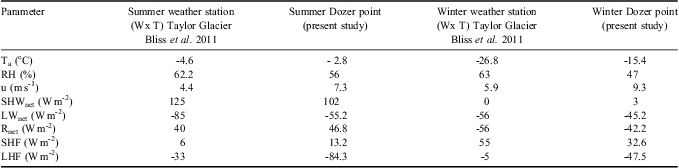
The meteorological parameters, mean annual air temperature, wind speed, relative humidity and incoming shortwave radiation flux were also compared with measurements from Bunger Hills oasis (Doran et al. 1996), a large ice-free expanse on the coast of East Antarctica (shown in Table III). Mean annual air temperature and incoming shortwave radiation flux are comparable with measurements at Bunger Hills oasis while relatively low relative humidity and high katabatic winds were observed at the present study location. The study was also compared for summer and winter season with Bliss et al. (Reference Bliss, Cuffey and Kavanaugh2011) at the Taylor Glacier, McMurdo Dry Valleys (Table IV). The present study location has comparatively high wind and low relative humidity during the summer and winter seasons. Both locations have high positive net radiation during summer and negative net radiation during winter. Sensible heat flux was positive for both locations during summer as well as winter indicating flow of heat from air to surface for most of the time. Higher sensible heat flux was observed at Taylor Glacier during winter indicating comparatively higher differences of surface and air temperature. Negative latent heat flux at both locations shows sublimation of ice and higher latent heat flux at the present study location indicates a higher rate of sublimation which may be as a result of higher wind speed and higher surface temperature.
Mean seasonal comparison of the present study with Taylor Glacier in McMurdo Dry Valleys.
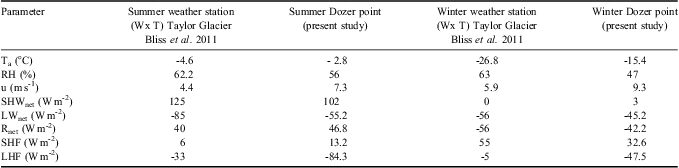
Ta = the absolute temperature measured at screen level height (c. 2 m) above surface, RH = relative humidity, u = wind speed, SHWnet = net shortwave radiation flux, LWnet = net downwelling longwave radiation flux, Rnet = net radiative flux, SHF = sensible heat flux, LHF = latent heat flux.
Conclusion
In this paper we have presented a four-year record of the meteorological parameters, radiative and turbulent energy fluxes of the ice sheet close to the Schirmacher Oasis in east Dronning Maud Land. The energy fluxes were analysed for summer season, winter season and transition periods. The meteorological conditions at the observation site are characterized by mild air temperature (annual mean -10.2°C), low relative humidity (annual mean 50%) and high katabatic winds (annual mean 8.3 m s-1). Incoming shortwave radiation flux during transition 2 period (seasonal mean 136 W m-2) was high compared to transition 1 period (62 W m-2) as mean solar zenith angle during transition 2 (81.7°) was low compared to transition 1 (85.5°). Net shortwave radiation flux was observed high during summer (seasonal mean 102 W m-2) followed by transition 2 period (seasonal mean 47 W m-2) and transition 1 period (seasonal 28 W m-2). At the present study site net shortwave radiation flux was high compared to other coastal sites of Dronning Maud Land and comparable with Taylor Glacier, McMurdo Dry Valleys. The mean annual atmospheric transmissivity was 0.659 for all weather days and 0.8 for clear sky days. Mean seasonal net longwave radiation flux varied from -45.2 W m-2 (winter) to -55.2 W m-2 (summer). Net longwave radiation flux was observed to be high compared to other coastal sites of Dronning Maud Land and low compared to Taylor Glacier. Net radiative flux was positive for summer season and negative for winter and transition 1 periods. During the transition 2 period, net shortwave radiation flux almost balances the net longwave radiation flux. Sensible heat flux was positive throughout the year and observed highest (66.4 W m-2) during transition 2 period and lowest during summer season (13.2 W m-2). Sensible heat flux was low during winter and high during summer compared to Taylor Glacier. Latent heat flux was observed highest during summer (-84.3 W m-2) and lowest during transition 2 period (-31.2 W m-2). Latent heat flux was observed high compared to the Taylor Glacier for summer as well as winter season. Mild temperature, low relative humidity and high katabatic wind compared to other Antarctic coastal locations cause high latent heat flux of the ice sheet close to Schirmacher Oasis equivalent to a monthly sublimation rate of 5.29 cm w.eq.
Acknowledgements
The authors are grateful to Shri Ashwagosha Ganju, Director of the Snow and Avalanche Study Establishment (SASE) for constant encouragement during the study. We also thank the Defence Research and Development Organization (DRDO) for funding the project. We express our sincere gratitude to NCAOR (National Centre for Antarctic and Ocean Research) for continuous logistic support for the study. We would also like to thank all the SASE members of the Indian Scientific Expedition to Antarctica for sincere efforts in data collection and maintenance of AWS. Dr M.R. Bhutiyani, Shri R.K. Garg, Shri R.K. Das, Shri Prem Datt, Shri Kamal Kant and Shri Avinash Negi are duly acknowledged for continuous support during the study. Comments by reviewers and the editorial team helped us immensely in improving the manuscript.