1 Introduction
The location and mechanism of laminar-to-turbulence transition in hypersonic boundary layers are sensitive to the flow environment. Linear theory provides criteria for the onset of exponential instability, and these primary waves subsequently undergo secondary instability and breakdown to turbulence. However, similar criteria for transition onset cannot be established theoretically because breakdown to turbulence is nonlinear. Nonlinear simulations can predict the evolution of any inflow perturbation, although starting with the linearly most unstable mode does not guarantee the earliest possible transition location. And when the inflow perturbation is composed of multiple waves, the choice of their relative amplitudes and phases can appreciably influence transition onset. These parameters are herein optimized using an ensemble-variational (EnVar) algorithm in order to determine the earliest possible transition Reynolds number in a zero-pressure-gradient (ZPG) high-speed boundary layer, for a specified level of energy of the inlet disturbance.
1.1 Transition in high-speed boundary layers
The precursors that ultimately lead to transition to turbulence in high-speed boundary layers can be traced upstream to the early amplification of small-amplitude acoustic, entropic or vortical fluctuations (Leyva Reference Leyva2017). When their amplitudes are infinitesimal, these waves and their growth rates are accurately modelled by linear stability theory (LST) (Mack Reference Mack1984). According to the LST, oblique first-mode instabilities, which are similar to the Tollmien–Schlichting waves at lower speeds, are most amplified in supersonic conditions. With increasing Mach number, however, two-dimensional acoustic instability waves, which are commonly referred to as Mack’s (second) modes (Mack Reference Mack1984), play an increasingly important role. Secondary instability theory was also developed (Herbert Reference Herbert1988) in order to examine how the state comprised of the mean-flow profile and the primary instability will itself become unstable to new perturbations. In order to account for non-parallel effects on the amplification of instability waves, the linear parabolized stability equations were introduced by Bertolotti, Herbert & Spalart (Reference Bertolotti, Herbert and Spalart1992). In addition, when the disturbance amplitudes become appreciable, the nonlinear parabolized stability equations (Bertolotti et al. Reference Bertolotti, Herbert and Spalart1992; Chang & Malik Reference Chang and Malik1994; Herbert Reference Herbert1997) can account for nonlinear modal interactions and the base-state distortion. The final stage of transition is marked by the appearance of localized turbulence patches, or spots, which spread as they are advected downstream. Intermittency, which is defined as the fraction of time that the flow at a given streamwise location is turbulent (Narasimha Reference Narasimha1985), thus rises from its initial value of zero in the laminar regime to unity where the spots merge to form a fully turbulent boundary layer. Recent numerical and experimental studies have focused on advancing our fundamental understanding of transition (see the reviews by Fedorov Reference Fedorov2011; Zhong & Wang Reference Zhong and Wang2012; Schneider Reference Schneider2015). A summary of select efforts is provided here, with the objective of highlighting transition mechanisms that are relevant to boundary layers at free-stream Mach numbers larger than four.
A key determining factor of the transition mechanism, be that in simulations or in experiments, is the spectral makeup of the upstream disturbance. For example, in numerical simulations, this inflow disturbance must be specified, and changes in the relative amplitudes and phases of inflow waves can lead to quantitative and qualitative changes in the transition process. Franko & Lele (Reference Franko and Lele2013, Reference Franko and Lele2014) performed direct numerical simulations of three transition mechanisms at Mach six, in ZPG and adverse-pressure-gradient (APG) boundary layers: first-mode oblique breakdown, second-mode oblique breakdown and second-mode fundamental resonance. In all cases, the disturbance frequencies and spanwise wavenumbers were chosen based on LST and the
 $e^{N}$
method. They concluded that, for all three mechanisms, APG increases the linear growth rates and promotes earlier breakdown to turbulence. Nonetheless, the nonlinear breakdown of each of the three mechanisms was qualitatively similar for ZPG and APG conditions. Sivasubramanian & Fasel (Reference Sivasubramanian and Fasel2015, Reference Sivasubramanian and Fasel2016) also performed direct numerical simulations of fundamental resonance and of oblique breakdown in a Mach 6 boundary layer on a sharp cone, with a half-vertex angle equal to
 $7^{\circ }$
. A series of low-resolution simulations, informed by LST, were used to identify the instability waves that promote early transition. These waves are then used to perform fully resolved simulations. They reported that both second-mode fundamental and oblique breakdown lead to strong nonlinear interactions, and are viable candidates to affect transition on the cone geometry. Novikov & Egorov (Reference Novikov and Egorov2016) performed a numerical study of laminar–turbulent transition over a flat plate at Mach 5.37. In that effort, perturbations were introduced into the boundary layer through a small round hole on the surface of the plate by forced pulsations of the vertical velocity component. The authors reported that the linear stages of transition are dominated by first-mode oblique waves, while second-mode plain waves become dominant in nonlinear regions. Most recently, Zhao et al. (Reference Zhao, Wen, Tian, Long and Yuan2018) studied the effect of local wall heating and cooling on the stability of a flat-plate boundary layer at Mach 6. Their results revealed that the location of thermal treatment relative to the synchronization point of the slow and the fast modes (Fedorov Reference Fedorov2011) significantly affects the stability of a second-mode instability. These studies highlight the variety of transition mechanisms that can be explored using nonlinear computations, and by varying the inflow condition.
In a Mach 6 wind tunnel, Zhang, Tang & Lee (Reference Zhang, Tang and Lee2013), Zhang et al. (Reference Zhang, Zhu, Chen, Yuan, Wu, Chen, Lee and Gad-el Hak2015) and Zhu et al. (Reference Zhu, Zhang, Chen, Yuan, Wu, Chen, Lee and Gad-el Hak2016, Reference Zhu, Chen, Wu, Chen, Lee and Gad-el Hak2018) investigated transition on a flared cone geometry using Rayleigh scattering visualization, fast-response pressure measurements and particle image velocimetry. They found that the second-mode instability is a key modulator of the transition process, through the formation of high-frequency vortical waves and triggering a fast breakdown to turbulence. They also reported that the second-mode waves, accompanied by high-frequency alternating fluid compression and expansion (dilatation), produce intense aerodynamic heating in a small region. Casper et al. (Reference Casper, Beresh, Henfling, Spillers, Pruett and Schneider2016) studied boundary-layer transition on a sharp seven-degree cone in hypersonic wind tunnels at Mach 5, 6, 8 and 14. At the lowest Mach number, transition was initiated by a combination of first- and second-mode instabilities, while at higher values the boundary layer was dominated by second-mode instabilities. Laurence, Wagner & Hannemann (Reference Laurence, Wagner and Hannemann2016) and Kennedy et al. (Reference Kennedy, Laurence, Smith and Marineau2018) also investigated transition on a slender cone at Mach
 $6$
–
 $7$
and Mach 14, respectively, using high-speed schlieren visualizations. They specifically focused on formation and evolution of second-mode instabilities, and reported that the wave packets form rope-like structures that become progressively more interwoven as transition develops. The experiments were performed for both low- and high-enthalpy conditions, and highlighted the difference in the wall-normal distribution of the disturbances in each condition. Despite laboratory experiments accounting for all stages of transition fully, starting from receptivity through the development of the turbulent boundary layer, they do not necessarily reproduce the environmental disturbances of high-altitude flight. As a result, flight experiments have been performed, and more than 20 such tests were surveyed by Schneider (Reference Schneider1999). The author noted the high cost of each experiment which often precludes repeating the tests. More recently, the Hypersonic International Flight Research Experimentation (HIFiRE) program performed a series of tests to study transition scenarios on a straight cone (HIFiRE-1; see e.g. Stanfield et al.
Reference Stanfield, Kimmel, Adamczak and Juliano2015) and on an elliptic cone (HIFiRE-5; see e.g. Juliano, Adamczak & Kimmel Reference Juliano, Adamczak and Kimmel2015; Kimmel et al.
Reference Kimmel, Adamczak, Hartley, Alesi, Frost, Pietsch, Shannon and Silvester2018) in hypersonic flights. The HIFiRE data show that, depending on the flow condition and angle of attack, second-mode-, cross-flow- and separation-induced transitions are all potential causes of turbulence on different parts of the vehicle. It is important to note that only a limited amount of flight data on transition are available and that in-flight environmental conditions are variable and uncertain.
1.2 The nonlinearly most dangerous disturbance
With a wealth of instability waves at hypersonic speeds, transition mechanisms in numerical simulations can vary quantitatively and qualitatively depending on the inflow disturbance spectrum. Existing approaches synthesize the inflow as a superposition of instability waves that are often selected based on their growth rates or appearance in experiments. The former approach does not guarantee that these waves are the most dangerous with respect to the onset of nonlinear breakdown, and relative modal amplitudes and phases are not prescribed in a manner that exposes the most dangerous transition scenario. When motivated by experimental observations, the choice of the computational inflow condition attempts to reproduce the instability waves that were experimentally measurable; precursor interactions that may have led to the generation of these modes may not be included. In addition, inflow conditions that are relevant to in-flight environments are often uncertain or unknown. These challenges motivate the present work and the question: how can we guarantee robust flow design in high-speed flows? The adopted approach is to determine, for a given level of disturbance energy, the nonlinearly most dangerous inflow condition that will cause transition at the lowest possible Reynolds number. No other inflow disturbance with the same energy can cause earlier breakdown to turbulence.
Compared to theory and nonlinear simulations of boundary-layer stability, studies of the nonlinearly most dangerous disturbances in transitional flows are relatively recent (Pringle & Kerswell Reference Pringle and Kerswell2010; Cherubini et al. Reference Cherubini, De Palma, Robinet and Bottaro2011; Rabin, Caulfield & Kerswell Reference Rabin, Caulfield and Kerswell2012). The limited number of previous efforts all focused on incompressible flows; the present study is the first to consider high-speed flow. Another common feature in earlier efforts is the use of adjoint-variational techniques, which are commonly adopted in flow control (Bewley, Moin & Temam Reference Bewley, Moin and Temam2001; Cherubini, Robinet & De Palma Reference Cherubini, Robinet and De Palma2013; Luchini & Bottaro Reference Luchini and Bottaro2014; Xiao & Papadakis Reference Xiao and Papadakis2017), in order to optimize a control vector that is either the initial or inflow disturbance – the optimal value is the nonlinearly most dangerous disturbance. The two main ingredients of the algorithm are a cost function whose optimality corresponds to the earliest transition location, and iterative numerical solution of the forward and adjoint equations to evaluate the local gradient of this cost function with respect to the control vector. One key advantage of adjoint methods is that a forward-adjoint loop directly yields the local sensitivity of the cost function to the control vector. However, the adjoint approach has a number of limitations that are relevant for the present purposes. Firstly, an accurate adjoint model is required and is not always available, for example in the case of nonlinear parabolized stability equations. Secondly, when the forward equations are nonlinear, the adjoint model depends on the time history of the forward state variables which must therefore be stored with full or high spatial and temporal resolution. Lastly, in chaotic systems it is very difficult to accurately satisfy the forward-adjoint duality relation over long time horizons and, as a result, forward-adjoint loops are not guaranteed to provide accurate or convergent gradients of the cost function. As a result, previous efforts have often been restricted to short optimization horizons (e.g. Xiao & Papadakis Reference Xiao and Papadakis2017).
In order to avoid some of the limitations of adjoint-variational methods, we developed an EnVar algorithm to evaluate the nonlinearly most dangerous inflow disturbance. This technique does not require an adjoint solver and is therefore applicable to any forward model, e.g. direct and large-eddy simulations, nonlinear parabolized stability equations, etc. In addition, without the requirement of an adjoint, the difficulties associated with storage requirements and the stability of the adjoint integration are no longer relevant. Applications of EnVar in fluid mechanics are recent, and are generally in the field of data assimilation (Colburn, Cessna & Bewley Reference Colburn, Cessna and Bewley2011; Suzuki Reference Suzuki2012; Kato et al. Reference Kato, Yoshizawa, Ueno and Obayashi2015; Yang et al. Reference Yang, Robinson, Heitz and Mémin2015; Mons et al. Reference Mons, Chassaing, Gomez and Sagaut2016; Gao et al. Reference Gao, Wang, Overton, Zupanski and Tu2017). The current effort is the first to develop EnVar methods for computing the nonlinearly most dangerous disturbance, and the first to examine these disturbances in hypersonic boundary layers.
In § 2, the governing equations and a detailed description of the EnVar algorithm are presented. Section 3 provides a summary of the parameters of the numerical simulations at the two levels of inflow energy. The nonlinearly most dangerous routes to turbulence are discussed in detail in § 4, and conclusions are provided in § 5.
2 Theoretical formulation
The high-speed flow of a compressible fluid satisfies the Navier–Stokes equations
 $$\begin{eqnarray}\displaystyle & \displaystyle {\displaystyle \frac{\unicode[STIX]{x2202}\unicode[STIX]{x1D70C}}{\unicode[STIX]{x2202}t}}+\unicode[STIX]{x1D735}\boldsymbol{\cdot }(\unicode[STIX]{x1D70C}\boldsymbol{u})=0, & \displaystyle\end{eqnarray}$$
 $$\begin{eqnarray}\displaystyle & \displaystyle {\displaystyle \frac{\unicode[STIX]{x2202}\unicode[STIX]{x1D70C}\boldsymbol{u}}{\unicode[STIX]{x2202}t}}+\unicode[STIX]{x1D735}\boldsymbol{\cdot }(\unicode[STIX]{x1D70C}\boldsymbol{u}\boldsymbol{u}+p\unicode[STIX]{x1D644}-\unicode[STIX]{x1D749})=0, & \displaystyle\end{eqnarray}$$
and
 $$\begin{eqnarray}\displaystyle {\displaystyle \frac{\unicode[STIX]{x2202}E}{\unicode[STIX]{x2202}t}}+\unicode[STIX]{x1D735}\boldsymbol{\cdot }(\boldsymbol{u}[E+p]+\unicode[STIX]{x1D73D}-\boldsymbol{u}\boldsymbol{\cdot }\unicode[STIX]{x1D749})=0, & & \displaystyle\end{eqnarray}$$
where
 $\unicode[STIX]{x1D70C}$
is the density,
 $\boldsymbol{u}$
is the velocity vector,
 $p$
is the pressure,
 $\unicode[STIX]{x1D644}$
is the unit tensor,
 $E=\unicode[STIX]{x1D70C}e+0.5\unicode[STIX]{x1D70C}\boldsymbol{u}\boldsymbol{\cdot }\boldsymbol{u}$
is the total energy,
 $e$
is the specific internal energy,
 $\unicode[STIX]{x1D749}$
is the viscous stress tensor and
 $\unicode[STIX]{x1D73D}$
is the heat flux vector. To close the system of equations, the calorically perfect gas relations are used
 $$\begin{eqnarray}\displaystyle p=(\unicode[STIX]{x1D6FE}-1)\unicode[STIX]{x1D70C}e, & & \displaystyle\end{eqnarray}$$
and
 $$\begin{eqnarray}\displaystyle T={\displaystyle \frac{\unicode[STIX]{x1D6FE}-1}{R}}e, & & \displaystyle\end{eqnarray}$$
where
 $T$
is the temperature,
 $\unicode[STIX]{x1D6FE}$
is the ratio of specific heats and
 $R$
is the gas constant. Furthermore, the viscous stress tensor and the heat flux are defined as
 $$\begin{eqnarray}\displaystyle \unicode[STIX]{x1D749}=\unicode[STIX]{x1D707}_{s}(\unicode[STIX]{x1D735}\boldsymbol{u}+(\unicode[STIX]{x1D735}\boldsymbol{u})^{\mathit{tr}})+\left(\unicode[STIX]{x1D707}_{b}-{\textstyle \frac{2}{3}}\unicode[STIX]{x1D707}_{s}\right)(\unicode[STIX]{x1D735}\boldsymbol{\cdot }\boldsymbol{u})\unicode[STIX]{x1D644}, & & \displaystyle\end{eqnarray}$$
and
 $$\begin{eqnarray}\displaystyle \unicode[STIX]{x1D73D}=-\unicode[STIX]{x1D705}\unicode[STIX]{x1D735}T, & & \displaystyle\end{eqnarray}$$
respectively, where
 $\unicode[STIX]{x1D707}_{s}$
is the dynamic shear viscosity, which is computed from the local temperature via Sutherland’s law (Sutherland Reference Sutherland1893),
 $\unicode[STIX]{x1D707}_{b}$
is the bulk viscosity and
 $\unicode[STIX]{x1D705}$
is the thermal conductivity. The viscosity variables are related via the Stokes hypothesis and the thermal conductivity is computed by assuming a constant Prandtl number and specific heat. We will refer to our Navier–Stokes solution algorithm, which is discussed later in § 3, in operator form as
 ${\mathcal{N}}$
.
Schematic of the computational domain for a ZPG transitional boundary layer over a flat plate.

The flow configuration is a ZPG boundary layer over a flat plate, and is shown schematically in figure 1. The computational domain starts downstream of the leading edge, and the inflow condition is a superposition of the compressible Blasius solution and perturbations:
 $$\begin{eqnarray}\displaystyle \unicode[STIX]{x1D731}=\unicode[STIX]{x1D731}_{B}+\unicode[STIX]{x1D753}^{\prime }, & & \displaystyle\end{eqnarray}$$
where
 $\unicode[STIX]{x1D731}=\left[\begin{array}{@{}ccccc@{}}\unicode[STIX]{x1D70C} & u & v & w & T\end{array}\right]^{\mathit{tr}}$
are the inflow variables, the subscript
 $B$
denotes the Blasius base state,
 $\unicode[STIX]{x1D753}^{\prime }=\left[\begin{array}{@{}ccccc@{}}\unicode[STIX]{x1D70C}^{\prime } & u^{\prime } & v^{\prime } & w^{\prime } & T^{\prime }\end{array}\right]^{\mathit{tr}}$
are the perturbations with respect to this base state and the superscript
 $\mathit{tr}$
denotes the transpose. In the present work, the unknown is the most unstable disturbance vector,
 $\unicode[STIX]{x1D753}^{\prime }$
, for a given level of initial energy.
2.1 Problem definition
The nonlinearly most dangerous disturbance is defined as the inflow perturbation (i) with a prescribed amount of total energy; (ii) that satisfies the Navier–Stokes equations; and (iii) that undergoes the fastest breakdown to turbulence (i.e. shortest streamwise distance to establishing a fully turbulent boundary layer). The first two elements of the definition are the constraints while the third is the objective. This problem can be cast as a constrained optimization: find the control vector
 $\unicode[STIX]{x1D753}^{\prime }$
that optimizes the cost function
 $$\begin{eqnarray}\displaystyle {\mathcal{J}}(\unicode[STIX]{x1D753}^{\prime })={\textstyle \frac{1}{2}}\Vert {\mathcal{G}}(\boldsymbol{q})\Vert ^{2}, & & \displaystyle\end{eqnarray}$$
while satisfying the constraints
 $$\begin{eqnarray}\displaystyle \boldsymbol{q}={\mathcal{N}}(\unicode[STIX]{x1D753}^{\prime }), & & \displaystyle\end{eqnarray}$$
and
 $$\begin{eqnarray}\displaystyle {\mathcal{E}}(\unicode[STIX]{x1D753}^{\prime })=E_{0}, & & \displaystyle\end{eqnarray}$$
where
 $\boldsymbol{q}=\left[\begin{array}{@{}ccc@{}}\unicode[STIX]{x1D70C} & \unicode[STIX]{x1D70C}\boldsymbol{u} & E\end{array}\right]^{\mathit{tr}}$
is the state vector,
 ${\mathcal{G}}(\boldsymbol{q})$
is the observation vector that quantifies the breakdown to turbulence,
 ${\mathcal{N}}$
represents the Navier–Stokes solver,
 ${\mathcal{E}}$
is the energy operator and
 $E_{0}$
is the constrained energy. Choices of
 ${\mathcal{G}}(\boldsymbol{q})$
can be formulated based on the skin friction, wall temperature, heat flux or perturbation energy. In the present work, the observation vector is proportional to the skin-friction coefficient,
 ${\mathcal{G}}(\boldsymbol{q})=C_{f}(\text{d}x/L_{x})^{1/2}$
. In addition, the total energy of the perturbations, used in constraint (2.6c
), is defined as
 $$\begin{eqnarray}\displaystyle {\mathcal{E}}(\unicode[STIX]{x1D753}^{\prime })=\frac{1}{2}\int _{0}^{L_{y}}\left(\overline{\unicode[STIX]{x1D70C}}[\overline{u^{\prime 2}}+\overline{v^{\prime 2}}+\overline{w^{\prime 2}}]+{\displaystyle \frac{R}{\unicode[STIX]{x1D6FE}-1}}\left[{\displaystyle \frac{\overline{T}}{\overline{\unicode[STIX]{x1D70C}}}}\overline{\unicode[STIX]{x1D70C}^{\prime 2}}+{\displaystyle \frac{\overline{\unicode[STIX]{x1D70C}}}{\overline{T}}}\overline{T^{\prime 2}}\right]\right)\text{d}y. & & \displaystyle\end{eqnarray}$$
In the above equation and throughout, the overbar denotes the mean which is evaluated from averaging in time and in the homogeneous spanwise direction.
The control vector is the inflow disturbance, which is expressed as a superposition of instability waves
 $$\begin{eqnarray}\displaystyle \unicode[STIX]{x1D753}^{\prime }=\mathop{\sum }_{n,m}\text{Real}\left\{c_{n,m}\hat{\unicode[STIX]{x1D753}}_{n,m}(x_{0},y)\text{e}^{\text{i}(\unicode[STIX]{x1D6FD}_{m}z-\unicode[STIX]{x1D714}_{n}t-\unicode[STIX]{x1D703}_{n,m})}\right\}, & & \displaystyle\end{eqnarray}$$
where
 $\unicode[STIX]{x1D714}_{n}$
and
 $\unicode[STIX]{x1D6FD}_{m}$
are the frequency and spanwise wavenumber of each instability mode and
 $\hat{\unicode[STIX]{x1D753}}_{n,m}=\left[\begin{array}{@{}ccccc@{}}\hat{\unicode[STIX]{x1D70C}}_{n,m} & \hat{u}_{n,m} & \hat{v}_{n,m} & \hat{w}_{n,m} & \hat{T}_{n,m}\end{array}\right]^{\mathit{tr}}$
are the complex wall-normal mode shapes which are obtained from solution of the Orr–Sommerfeld–Squire eigenvalue problem. At each
 $(n,m)$
pair, only the most unstable mode will be included at the inflow, which in the present study will be the slow mode (Fedorov Reference Fedorov2011). Since eigenmodes of the Orr–Sommerfeld–Squire problem can have arbitrary amplitudes, they must be appropriately normalized; here we enforce that each mode
 $\hat{\unicode[STIX]{x1D753}}_{n,m}$
has unit energy
 $$\begin{eqnarray}\displaystyle \frac{1}{2}\int _{0}^{L_{y}}\left(\overline{\unicode[STIX]{x1D70C}}[\hat{u} ^{\ast }\hat{u} +\hat{v}^{\ast }\hat{v}+{\hat{w}}^{\ast }{\hat{w}}]+{\displaystyle \frac{R}{\unicode[STIX]{x1D6FE}-1}}\left[{\displaystyle \frac{\overline{T}}{\overline{\unicode[STIX]{x1D70C}}}}\hat{\unicode[STIX]{x1D70C}}^{\ast }\hat{\unicode[STIX]{x1D70C}}+{\displaystyle \frac{\overline{\unicode[STIX]{x1D70C}}}{\overline{T}}}\hat{T}^{\ast }\hat{T}\right]\right)_{n,m}\,\text{d}y=1, & & \displaystyle\end{eqnarray}$$
where star denotes the complex conjugate. It should be emphasized that (2.9) is simply a normalization of the eigenmodes, whose amplitudes in (2.8) are prescribed using the positive real-valued
 $c_{n,m}$
and their relative phases are
 $\unicode[STIX]{x1D703}_{n,m}$
. Therefore, assuming knowledge of the relevant range of frequencies and spanwise wavenumbers, the only unknowns are
 $c_{n,m}$
and
 $\unicode[STIX]{x1D703}_{n,m}$
that lead to the most upstream transition location. The control vector can then be redefined in terms of those two parameters
 $$\begin{eqnarray}\displaystyle \boldsymbol{c}=\left[\begin{array}{@{}cccc@{}}c_{n,m} & \ldots & \unicode[STIX]{x1D703}_{n,m} & \ldots \end{array}\right]^{\mathit{tr}}, & & \displaystyle\end{eqnarray}$$
and its size is
 $2M$
, or twice the total number of instability modes. In terms of the new control vector, the perturbation energy (2.7) can be expressed as
 $$\begin{eqnarray}\displaystyle {\mathcal{E}}(\unicode[STIX]{x1D753}^{\prime })={\textstyle \frac{1}{2}}\boldsymbol{c}^{\mathit{tr}}\unicode[STIX]{x1D63C}_{1}\boldsymbol{c}, & & \displaystyle\end{eqnarray}$$
where
 $$\begin{eqnarray}\displaystyle \unicode[STIX]{x1D63C}_{1}=\left[\begin{array}{@{}cc@{}}\unicode[STIX]{x1D644} & \unicode[STIX]{x1D64A}\\ \unicode[STIX]{x1D64A} & \unicode[STIX]{x1D64A}\end{array}\right]_{2M\times 2M}, & & \displaystyle\end{eqnarray}$$
and
 $\unicode[STIX]{x1D64A}$
and
 $\unicode[STIX]{x1D644}$
are zero and identity matrices of size
 $M\times M$
, respectively.
Now the constrained optimization problem (2.6) can be rewritten as identifying
 $\boldsymbol{c}$
that optimizes the cost function
 $$\begin{eqnarray}\displaystyle {\mathcal{J}}(\boldsymbol{c})={\textstyle \frac{1}{2}}\Vert {\mathcal{G}}(\boldsymbol{q})\Vert ^{2}, & & \displaystyle\end{eqnarray}$$
while satisfying the constraints
 $$\begin{eqnarray}\displaystyle & \displaystyle \boldsymbol{q}={\mathcal{N}}(\boldsymbol{c}), & \displaystyle\end{eqnarray}$$
 $$\begin{eqnarray}\displaystyle & \displaystyle {\textstyle \frac{1}{2}}\boldsymbol{c}^{\mathit{tr}}\unicode[STIX]{x1D63C}_{1}\boldsymbol{c}=E_{0}, & \displaystyle\end{eqnarray}$$
and
 $$\begin{eqnarray}\displaystyle \unicode[STIX]{x1D63C}_{1}\boldsymbol{c}\geqslant 0. & & \displaystyle\end{eqnarray}$$
The constraint (2.13d
) is introduced because
 $c_{n,m}$
in (2.8) are real positive values. An EnVar approach is adopted to solve the optimization problem (2.13).
2.2 Ensemble-variational optimization
The optimization problem (2.13) starts with an estimate, or guess, of the solution
 $\boldsymbol{c}^{(e)}$
. An ensemble of
 $N_{en}$
variants,
 $\boldsymbol{c}^{(r)}$
, where
 $r=1,\ldots ,N_{en}$
, is also constructed whose mean is equal to
 $\boldsymbol{c}^{(e)}$
. The optimal control vector is then expressed as the weighted sum
 $$\begin{eqnarray}\displaystyle \boldsymbol{c}=\boldsymbol{c}^{(e)}+\unicode[STIX]{x1D640}^{\prime }\boldsymbol{a}, & & \displaystyle\end{eqnarray}$$
where
 $\unicode[STIX]{x1D640}^{\prime }$
is the deviation of the ensemble members from their mean,
 $$\begin{eqnarray}\displaystyle \unicode[STIX]{x1D640}^{\prime }=\left[\begin{array}{@{}ccccc@{}}\boldsymbol{c}^{(1)}-\boldsymbol{c}^{(e)} & \ldots & c^{(r)}-\boldsymbol{c}^{(e)} & \ldots & \boldsymbol{c}^{(N_{en})}-\boldsymbol{c}^{(e)}\end{array}\right]_{2M\times N_{en}}, & & \displaystyle\end{eqnarray}$$
and
 $\boldsymbol{a}$
is the weight vector,
 $$\begin{eqnarray}\displaystyle \boldsymbol{a}=\left[\begin{array}{@{}ccccc@{}}a^{(1)} & \ldots & a^{(r)} & \ldots & a^{(N_{en})}\end{array}\right]^{\mathit{tr}}. & & \displaystyle\end{eqnarray}$$
Since the mean
 $\boldsymbol{c}^{(e)}$
and members
 $\boldsymbol{c}^{(r)}$
of the ensemble are known, the control vector becomes the optimal weights
 $\boldsymbol{a}$
.
The optimization problem can be rewritten in terms of the new control vector. Using (2.14), the energy constraint (2.13c ) becomes
 $$\begin{eqnarray}\displaystyle {\textstyle \frac{1}{2}}\boldsymbol{c}^{(e)\mathit{tr}}\unicode[STIX]{x1D63C}_{1}\boldsymbol{c}^{(e)}+\boldsymbol{c}^{(e)\mathit{tr}}\unicode[STIX]{x1D63C}_{1}\unicode[STIX]{x1D640}^{\prime }\boldsymbol{a}+{\textstyle \frac{1}{2}}\boldsymbol{a}^{\mathit{tr}}\unicode[STIX]{x1D640}^{\prime \mathit{tr}}\unicode[STIX]{x1D63C}_{1}\unicode[STIX]{x1D640}^{\prime }\boldsymbol{a}=E_{0}. & & \displaystyle\end{eqnarray}$$
Similarly, the inequality constraint (2.13d ) is recast as
 $$\begin{eqnarray}\displaystyle \unicode[STIX]{x1D63C}_{1}\boldsymbol{c}^{(e)}+\unicode[STIX]{x1D63C}_{1}\unicode[STIX]{x1D640}^{\prime }\boldsymbol{a}\geqslant 0. & & \displaystyle\end{eqnarray}$$
The details of constructing the ensemble members
 $\boldsymbol{c}^{(r)}$
are provided in appendix A. The procedure ensures the following three properties: (i) the mean of the ensemble members is
 $\boldsymbol{c}^{(e)}$
; (ii) each member and the mean satisfy the energy constraint,
 $\frac{1}{2}\boldsymbol{c}^{(r)tr}\unicode[STIX]{x1D63C}_{1}\boldsymbol{c}^{(r)}=E_{0}$
for
 $r=1,\ldots ,N_{en}$
and
 $\frac{1}{2}\boldsymbol{c}^{(e)\mathit{tr}}\unicode[STIX]{x1D63C}_{1}\boldsymbol{c}^{(e)}=E_{0}$
; and (iii) the deviations of the members from the mean are controlled using a covariance matrix. It is important to note that the arithmetic mean cannot satisfy (i) and (ii) simultaneously. Instead, the modal amplitudes and phases of the ensemble members and the mean control vector are related by, respectively,
 $$\begin{eqnarray}\displaystyle \unicode[STIX]{x1D63C}_{1}\boldsymbol{c}^{(e)}\circ \unicode[STIX]{x1D63C}_{1}\boldsymbol{c}^{(e)}={\displaystyle \frac{1}{N_{en}}}\mathop{\sum }_{r=1}^{N_{en}}\unicode[STIX]{x1D63C}_{1}\boldsymbol{c}^{(r)}\circ \unicode[STIX]{x1D63C}_{1}\boldsymbol{c}^{(r)}, & & \displaystyle\end{eqnarray}$$
and
 $$\begin{eqnarray}\displaystyle \unicode[STIX]{x1D63C}_{2}\boldsymbol{c}^{(e)}={\displaystyle \frac{1}{N_{en}}}\mathop{\sum }_{r=1}^{N_{en}}\unicode[STIX]{x1D63C}_{2}\boldsymbol{c}^{(r)}, & & \displaystyle\end{eqnarray}$$
where
 $\circ$
is element-wise product of two vectors and
 $$\begin{eqnarray}\displaystyle \unicode[STIX]{x1D63C}_{2}=\left[\begin{array}{@{}cc@{}}\unicode[STIX]{x1D64A} & \unicode[STIX]{x1D64A}\\ \unicode[STIX]{x1D64A} & \unicode[STIX]{x1D644}\end{array}\right]_{2M\times 2M}. & & \displaystyle\end{eqnarray}$$
The optimization procedure requires computation of the gradient of the cost function with respect to the control variable, and therefore
 ${\mathcal{J}}$
must be expressed as a differentiable function of
 $\boldsymbol{a}$
. First, the governing Navier–Stokes equations (2.13b
) are written in terms of the new control vector
 $$\begin{eqnarray}\displaystyle \boldsymbol{q}={\mathcal{N}}(\boldsymbol{c}^{(e)}+\unicode[STIX]{x1D640}^{\prime }\boldsymbol{a}). & & \displaystyle\end{eqnarray}$$
The equation is expanded around the mean vector using Taylor series
 $$\begin{eqnarray}\displaystyle \boldsymbol{q}=\boldsymbol{q}^{(e)}+\left.{\displaystyle \frac{\unicode[STIX]{x2202}{\mathcal{N}}}{\unicode[STIX]{x2202}\boldsymbol{c}}}\right|_{\boldsymbol{c}^{(e)}}\unicode[STIX]{x1D640}^{\prime }\boldsymbol{a}+\frac{1}{2!}\left.{\displaystyle \frac{\unicode[STIX]{x2202}^{2}{\mathcal{N}}}{\unicode[STIX]{x2202}\boldsymbol{c}^{2}}}\right|_{\boldsymbol{c}^{(e)}}\left(\unicode[STIX]{x1D640}^{\prime }\boldsymbol{a}\circ \unicode[STIX]{x1D640}^{\prime }\boldsymbol{a}\right)+\cdots \,, & & \displaystyle\end{eqnarray}$$
where
 $\boldsymbol{q}^{(e)}={\mathcal{N}}(\boldsymbol{c}^{(e)})$
. By assuming the members of the ensemble are close to the mean, or
 $\unicode[STIX]{x1D640}^{\prime }\boldsymbol{a}$
is small, the high-order terms in (2.22) can be ignored as follows:
 $$\begin{eqnarray}\displaystyle \boldsymbol{q}\approx \boldsymbol{q}^{(e)}+\left.{\displaystyle \frac{\unicode[STIX]{x2202}{\mathcal{N}}}{\unicode[STIX]{x2202}\boldsymbol{c}}}\right|_{\boldsymbol{c}^{(e)}}\unicode[STIX]{x1D640}^{\prime }\boldsymbol{a}. & & \displaystyle\end{eqnarray}$$
Substituting (2.23) into (2.13a ) and using Taylor series expansion, the cost function is approximated as
 $$\begin{eqnarray}\displaystyle {\mathcal{J}}(\boldsymbol{a})\approx \frac{1}{2}\left\Vert {\mathcal{G}}\left(\boldsymbol{q}^{(e)}+\left.\frac{\unicode[STIX]{x2202}{\mathcal{N}}}{\unicode[STIX]{x2202}\boldsymbol{c}}\right|_{\boldsymbol{c}^{(e)}}\unicode[STIX]{x1D640}^{\prime }\boldsymbol{a}\right)\right\Vert ^{2}\approx \frac{1}{2}\left\Vert {\mathcal{G}}(\boldsymbol{q}^{(e)})+\left.{\displaystyle \frac{\unicode[STIX]{x2202}{\mathcal{G}}}{\unicode[STIX]{x2202}\boldsymbol{q}}}\right|_{\boldsymbol{q}^{(e)}}\left.{\displaystyle \frac{\unicode[STIX]{x2202}{\mathcal{N}}}{\unicode[STIX]{x2202}\boldsymbol{c}}}\right|_{\boldsymbol{c}^{(e)}}\unicode[STIX]{x1D640}^{\prime }\boldsymbol{a}\right\Vert ^{2}. & & \displaystyle\end{eqnarray}$$
As long as the linear approximations in (2.23) and (2.24) are valid, constraint (2.13b
) is satisfied and the observation matrix
 $\unicode[STIX]{x1D643}\equiv (\unicode[STIX]{x2202}{\mathcal{G}}/\unicode[STIX]{x2202}\boldsymbol{q})|_{\boldsymbol{q}^{(e)}}(\unicode[STIX]{x2202}{\mathcal{N}}/\unicode[STIX]{x2202}\boldsymbol{c})|_{\boldsymbol{c}^{(e)}}\unicode[STIX]{x1D640}^{\prime }$
can be evaluated as
 $$\begin{eqnarray}\displaystyle \unicode[STIX]{x1D643}\approx \left[\begin{array}{@{}ccc@{}}{\mathcal{G}}\left(\boldsymbol{q}^{(1)}\right)-{\mathcal{G}}\left(\boldsymbol{q}^{(e)}\right) & \ldots \, & {\mathcal{G}}\left(\boldsymbol{q}^{(N_{en})}\right)-{\mathcal{G}}\left(\boldsymbol{q}^{(e)}\right)\end{array}\right]_{N_{{\mathcal{G}}}\times N_{en}}, & & \displaystyle\end{eqnarray}$$
where
 $N_{{\mathcal{G}}}$
is the size of observation vector. Note that the validity of (2.23) to (2.25) is predicated on
 $\unicode[STIX]{x1D640}^{\prime }\boldsymbol{a}$
being small – a condition that is ensured during the generation of the ensemble members (appendix A). Assembling matrix
 $\unicode[STIX]{x1D643}$
is the most expensive part of the algorithm since it requires
 $N_{en}+1$
solutions of the governing equations. While in the current study direct numerical simulations are used to evaluate
 $\unicode[STIX]{x1D643}$
, the derivation of (2.25) did not invoke any assumptions regarding the choice of the numerical approach to computing
 ${\mathcal{G}}(\boldsymbol{q}^{(r)})$
. As a result, other approaches such as large-eddy simulations and the nonlinear parabolized stability equations can potentially be adopted.
In summary, the constrained optimization (2.13) can be recast as seeking the weight vector
 $\boldsymbol{a}$
that optimizes the cost function
 $$\begin{eqnarray}\displaystyle {\mathcal{J}}(\boldsymbol{a})\approx {\textstyle \frac{1}{2}}\Vert {\mathcal{G}}(\boldsymbol{q}^{(e)})+\unicode[STIX]{x1D643}\boldsymbol{a}\Vert ^{2}, & & \displaystyle\end{eqnarray}$$
while satisfying the constraints
 $$\begin{eqnarray}\displaystyle {\textstyle \frac{1}{2}}\boldsymbol{c}^{(e)\mathit{tr}}\unicode[STIX]{x1D63C}_{1}\boldsymbol{c}^{(e)}+\boldsymbol{c}^{(e)\mathit{tr}}\unicode[STIX]{x1D63C}_{1}\unicode[STIX]{x1D640}^{\prime }\boldsymbol{a}+{\textstyle \frac{1}{2}}\boldsymbol{a}^{\mathit{tr}}\unicode[STIX]{x1D640}^{\prime \mathit{tr}}\unicode[STIX]{x1D63C}_{1}\unicode[STIX]{x1D640}^{\prime }\boldsymbol{a}-E_{0}=0, & & \displaystyle\end{eqnarray}$$
and
 $$\begin{eqnarray}\displaystyle -\unicode[STIX]{x1D63C}_{2}\unicode[STIX]{x1D640}^{\prime }\boldsymbol{a}\leqslant \unicode[STIX]{x1D63C}_{2}\boldsymbol{c}^{(e)}. & & \displaystyle\end{eqnarray}$$
Interior-point method (Nocedal & Wright Reference Nocedal and Wright2006; Wächter & Biegler Reference Wächter and Biegler2006) is used to solve (2.26) by generating iterates that satisfy the inequality bounds, strictly. The full procedure to solve the optimization problem, and hence identify the nonlinearly most dangerous disturbance, is shown in algorithm 1.

3 Computational aspects
During the search for the nonlinearly most dangerous inflow disturbance, the optimization algorithm involves the solution of the Navier–Stokes equations for every ensemble member and observation of the wall friction. The simulations are performed using code Hybrid (Johnsen et al. Reference Johnsen, Larsson, Bhagatwala, Cabot, Moin, Olson, Rawat, Shankar, Sjögreen and Yee2010), which solves the compressible Navier–Stokes equations (2.1) on a structured grid and is designed for accurate simulations of high-speed transitional and fully turbulent flows. It is nominally free of numerical dissipation, which is important for accurate prediction of the evolution of instability waves and transition onset. The time advancement is fourth-order accurate using the Runge–Kutta scheme, and the spatial discretization in the absence of shocks is sixth-order central with a split form which improves nonlinear stability, and a fifth-order weighted essentially non-oscillatory scheme with Roe flux splitting is used near shocks. Code Hybrid was described and adopted in a number of previous studies (see e.g. Larsson & Lele Reference Larsson and Lele2009; Johnsen et al. Reference Johnsen, Larsson, Bhagatwala, Cabot, Moin, Olson, Rawat, Shankar, Sjögreen and Yee2010; Kawai & Larsson Reference Kawai and Larsson2012).
Physical and computational parameters for the cases of the present study.

A schematic of the simulated domain is shown in figure 1. Two cases are considered to highlight the effect of the energy level on the nonlinearly most dangerous inflow perturbations. Table 1 summarizes the computational and physical parameters of each case, which are identical except for the inflow disturbance energy. The free-stream values are adopted as reference scales for normalization of velocity, temperature, density, viscosity, specific heat and conductivity. The reference length is the Blasius length scale,
 $(\tilde{\unicode[STIX]{x1D707}}_{\infty }\tilde{x}_{0}/\tilde{\unicode[STIX]{x1D70C}}_{\infty }\tilde{U} _{\infty })^{1/2}$
, at the inlet location, where the
 $\tilde{.}$
represents dimensional quantities and
 $\tilde{x}_{0}$
is the start location of the simulation relative to the virtual boundary-layer origin.
The boundary conditions are periodic in the spanwise
 $(z)$
direction, while characteristic conditions are adopted on the remaining four boundaries in the streamwise (
 $x$
) and wall-normal (
 $y$
) directions. The marked sponge regions in figure 1 along the outflow boundaries minimize reflections of outgoing disturbances. Within these layers, a relaxation term,
 $\unicode[STIX]{x1D70E}d^{2}(\boldsymbol{q}_{ref}-\boldsymbol{q})$
, is introduced in the governing equations to force the solution towards the spanwise-averaged
 $\boldsymbol{q}_{ref}$
at each time step. In this expression,
 $d\in [0,1]$
is the normalized distance within the sponge region. In the streamwise direction the width of the sponge is 250 units and
 $\unicode[STIX]{x1D70E}=0.7$
, while in the wall-normal direction the sponge height is
 $30$
units and
 $\unicode[STIX]{x1D70E}=0.85$
. These values were verified to effectively damp outgoing vortical, acoustic and entropic waves, without causing reflections.
The free-stream Mach number in all simulations is
 $Ma_{\infty }=4.5$
, the operating gas is air (
 $Pr=0.72$
and
 $\unicode[STIX]{x1D6FE}=1.4$
) and the free-stream temperature used in Sutherland’s law is 65.15 K. The Reynolds number based on inlet is
 $Re_{x_{0}}$
and the streamwise position of the inflow plane is
 $x_{0}=\sqrt{Re_{x_{0}}}=1800$
, which was selected based on the transition Reynolds numbers in high-altitude flight tests being
 $\sqrt{Re_{x,tr}}>2000$
for
 $Ma_{\infty }>4$
(Harvey Reference Harvey1978; Schneider Reference Schneider1999). Starting the simulations from smaller Reynolds numbers requires a much longer domain size, which poses prohibitively high computational requirements. The lengths of the computational domain in the
 $x$
,
 $y$
and
 $z$
directions are
 $L_{x}$
,
 $L_{y}$
and
 $L_{z}$
, which are discretized with
 $N_{x}$
,
 $N_{y}$
and
 $N_{z}$
grid points, respectively (see table 1). The computational grid is uniform in the
 $x$
and
 $z$
directions, and a hyperbolic tangent stretching is used in the
 $y$
direction. Our choice of computational parameters was informed by preliminary simulations with nonlinear instability amplitudes that cause transition at different streamwise locations. We have also validated our algorithm by simulating the evolution of very small-amplitude instability waves, which are very sensitive to numerical accuracy, and comparing to the parabolized stability equations.
The two cases, E1 and E2, are distinguished by the total disturbance energy at the inflow plane,
 $E_{0}$
, which is prescribed as a constraint in the optimization problem (constraint (2.26b
)). Comparison of E1 and E2 highlights the effect of the energy constraint on the spectral makeup of the nonlinearly most dangerous inflow perturbation, and the associated transition mechanism. The amount of energy for case E1 is chosen to be of the same order as the turbulence kinetic energy (TKE) in stratospheric layers, measured during a recent experimental campaign by Haack, Gerding & Lübken (Reference Haack, Gerding and Lübken2014) with the balloon-borne instrument Leibniz Institute Turbulence Observations in the Stratosphere (LITOS).
The normalized frequencies of the disturbance (2.8) are assumed to range from
 $F_{l}$
to
 $F_{u}$
with an increment
 $\unicode[STIX]{x0394}F=F_{l}=10$
, where
 $$\begin{eqnarray}\displaystyle F=\frac{\unicode[STIX]{x1D714}_{n}}{\sqrt{Re_{x_{0}}}}\times 10^{6}=nF_{l}\quad \text{for }n=1,2,\ldots ,{\displaystyle \frac{F_{u}}{F_{l}}}. & & \displaystyle\end{eqnarray}$$
Similarly,
 $k_{z,l}$
and
 $k_{z,u}$
in table 1 are the lower and upper bounds of the integer spanwise wavenumbers of the inflow disturbance, where
 $$\begin{eqnarray}\displaystyle k_{z}={\displaystyle \frac{\unicode[STIX]{x1D6FD}_{m}L_{z}}{2\unicode[STIX]{x03C0}}}=m\quad \text{for}~m=k_{z,l},\ldots ,k_{z,u}. & & \displaystyle\end{eqnarray}$$
For the three-dimensional modes at the inlet,
 $k_{z}>0$
, the modal energy is divided equally between the positive and negative spanwise wavenumbers,
 $\pm \unicode[STIX]{x1D6FD}_{m}$
, with the same phase
 $\unicode[STIX]{x1D703}_{n,m}$
in (2.8). Therefore, hereafter only
 $k_{z}>0$
will be reported since they are representative of the pairs of oblique modes. The total number of frequencies (3.1) and spanwise wavenumbers (3.2) at the inlet is
 $M=400$
. And since both the amplitude and phase of each instability wave must be optimized, the size of the control vector is equal to
 $2M$
. The number of unknowns is directly proportional to the computational cost that is required to solve the optimization problem, which places a practical constraint on
 $M$
. Based on the present size of the control vector, and guided by some preliminary tests, the size of the ensemble that is adopted in the EnVar algorithm 1 was
 $N_{en}=20$
.
Neutral curves of a ZPG boundary layer at
 $Ma_{\infty }=4.5$
. The values marked on the curves correspond to the normalized spanwise wavenumber,
 $b=(\unicode[STIX]{x1D6FD}/\sqrt{Re_{x}})\times 10^{3}$
. The marked rectangular region corresponds to the streamwise extent of the simulation domain and the range of inflow frequencies.

Figure 2 shows the neutral curves from linear spatial stability analysis of a ZPG boundary layer at
 $Ma_{\infty }=4.5$
. The lower unstable regions in the figure are commonly referred to as (Mack’s) first-mode instability regions, whereas the upper unstable regions are called (Mack’s) second-mode disturbances (Mack Reference Mack1984). The ranges of
 $F$
and
 $k_{z}$
in table 1 are appropriately selected such that they include all the relevant frequencies and spanwise wavenumbers at the inlet location. For every pair of frequency and spanwise wavenumber, the most unstable discrete mode in the Orr–Sommerfeld and Squire spectra is included; these instabilities correspond to slow modes (Fedorov Reference Fedorov2011). For the
 $400$
inlet instability waves, the spatial resolutions reported in table 1 correspond to a minimum of nine and a maximum of 225 grid points within one streamwise wavelength, and a minimum of seven and a maximum of 108 grid points in one spanwise wavelength. In the wall-normal direction, 40 grid points are within the boundary layer at the inlet plane.
4 Results and discussion
4.1 Nonlinearly most dangerous inflow spectra
The optimization algorithm 1 seeks the nonlinearly most dangerous disturbance by maximizing the cost function
 ${\mathcal{J}}=\frac{1}{2}\Vert {\mathcal{G}}(\boldsymbol{q})\Vert ^{2}=\frac{1}{2L_{x}}\int _{x_{0}}^{x_{f}}C_{f}^{2}\,\text{d}x$
, where
 $$\begin{eqnarray}\displaystyle C_{f}={\displaystyle \frac{\unicode[STIX]{x1D70F}_{wall}}{\frac{1}{2}\unicode[STIX]{x1D70C}_{\infty }U_{\infty }^{2}}}. & & \displaystyle\end{eqnarray}$$
The initial guess of the disturbance spectra was equipartition of the energy among all instability waves and randomly assigned phases. In addition to the mean, 20 ensemble members were used in each iteration. The stopping criterion of the optimization was
 $({\mathcal{J}}_{i}-{\mathcal{J}}_{i-1})/{\mathcal{J}}_{i}<10^{-3}$
, where
 $i$
is the iteration number. It should be noted that the optimization was not repeated for any other initial guesses. As such, similar to other gradient-based methods, the reported results are only guaranteed to be local optima for a given choice of the initial guess.
(a,b) Skin friction and (c,d) normalized cost function and transition Reynolds number for cases (a,c) E1 and (b,d) E2. In the
 $C_{f}$
plots, the dashed green profiles correspond to the initial guess, and thin to thick (also light to dark coloured) solid lines represent the result for the mean control vector after consecutive iterations. The dashed-dotted blue curves correspond to the nonlinearly most dangerous inflow spectra for each case (see table 2).

For each iteration,
 $C_{f}$
,
 ${\mathcal{J}}/{\mathcal{J}}_{0}$
and
 $\sqrt{Re_{x,tr}}$
associated with the mean control vectors
 $\boldsymbol{c}^{(e)}$
are plotted in figure 3; the transition Reynolds number
 $\sqrt{Re_{x,tr}}$
is defined as the location of minimum
 $C_{f}$
. For case E1, the flow remains laminar throughout the computational domain for the initial guess and first iteration. As a result, the
 $C_{f}$
curves of these two inflow perturbations nearly coincide and, while
 $({\mathcal{J}}_{1}-{\mathcal{J}}_{0})/{\mathcal{J}}_{1}\approx 9.99\times 10^{-4}<10^{-3}$
, further iterations are performed. The convergence rate of the optimization algorithm is highly dependent on the observation matrix, defined in (2.25). Figure 3(a,c) shows that the convergence rate of the algorithm for case E1 is slow during the first two iterations. This behaviour is the outcome of the observation matrix, formed by the skin-friction profiles, being nearly singular for these two iterations. Transition to turbulence generally advances upstream (i.e. smaller
 $\sqrt{Re_{x,tr}}$
) with successive iterations, with convergence observed for both E1 and E2. For E1, transition location is nearly unchanged from the tenth to the eleventh iteration, and for case E2 a similar behaviour is observed from the seventh to the eighth iteration. Quantitatively, the change in transition Reynolds number during the last two iterations is approximately 0.2 % and 0.03 % for cases E1 and E2, respectively. Each iteration of the optimization procedure required approximately 50 000 CPU hours, and therefore the total computational cost was half a million CPU hours per inflow energy level.
The choice of the cost function in algorithm 1 is not unique. Depending on the application of interest, measures based on the total energy of the perturbations within the domain or the wall temperature could have been adopted. Every new cost function, however, requires repeating the entire optimization procedure, which is not performed here. Instead, for each iterate of the optimization where the cost function was proportional to skin friction, the average integrated energy and the average wall temperature were recorded and are plotted in figures 4 and 5. Note that in figure 4, the energy
 ${\mathcal{E}}$
is computed from (2.7) with fluctuations evaluated relative to a laminar solution over the entire plate. As a result, a base-state distortion term with frequency and spanwise wavenumber
 $\langle 0,0\rangle$
contributes to the perturbation energy.
(a,b) Curves of
 ${\mathcal{E}}$
versus downstream Reynolds number and (c,d) the ratio
 ${\mathcal{M}}_{{\mathcal{E}}}/{\mathcal{M}}_{{\mathcal{E}},0}$
, for cases (a,c) E1 and (b,d) E2. In the
 ${\mathcal{E}}$
plots, the dashed green profiles correspond to the initial guess (iteration no. 0 in algorithm 1), thin to thick (also light to dark coloured) solid lines represent the optimal solutions after consecutive iterations and the dashed-dotted blue profiles correspond to the nonlinearly most dangerous inflow spectra for each case (the spectra in table 2).

The streamwise integrals of the energy,
 ${\mathcal{M}}_{{\mathcal{E}}}=(1/L_{x})\int _{x_{0}}^{x_{f}}{\mathcal{E}}\,\text{d}x$
, and of the wall temperature,
 ${\mathcal{M}}_{\overline{T}_{wall}}=(1/L_{x})\int _{x_{0}}^{x_{f}}\overline{T}_{wall}\,\text{d}x$
, are also plotted in figures 4 and 5, normalized by their values from the initial guess. Note, however, that these norms were not used in an optimization procedure. The ratio
 ${\mathcal{M}}_{{\mathcal{E}}}/{\mathcal{M}}_{{\mathcal{E}},0}$
increases with every iteration for both inflow perturbation levels.
Comparison of figures 4 and 3 highlights the rationale for choosing
 $C_{f}$
for the definition of the cost function. The increase in the perturbation energy takes place throughout the domain, initially through the amplification of primary instabilities, subsequent secondary instabilities and ultimately breakdown to turbulence if it takes place within the domain. For case E1, the initial guess yields an increasing perturbation energy even though the flow is laminar throughout the computational domain; the second iterate too yields a laminar solution, even though its energy integral is higher. Therefore, using
 ${\mathcal{E}}$
as the observation vector may not in theory guarantee the fastest breakdown to turbulence, although in practice it is effective (Pringle & Kerswell Reference Pringle and Kerswell2010). In contrast, the skin-friction curve reproduces the laminar behaviour throughout the pre-transitional region and only increases towards the turbulent correlation when intermittency is finite, where intermittency is the fraction of time that the flow is turbulent. As a result, a cost function based on
 $C_{f}$
only shows appreciable increase in case E1 when the flow undergoes transition to turbulence. In addition, increasing the cost function based on
 $C_{f}$
is directly tied to generation of turbulence early upstream, unlike a cost function based on the perturbation energy that includes contributions from the amplification of instability waves in the laminar region of the flow.
(a,b) Curves of
 $\overline{T}_{wall}$
versus downstream Reynolds number and (c,d) the ratio
 ${\mathcal{M}}_{\overline{T}_{wall}}/{\mathcal{M}}_{\overline{T}_{wall,0}}$
, for cases (a,c) E1 and (b,d) E2. In the
 $\overline{T}_{wall}$
plots, the dashed green profiles correspond to the initial guess (iteration no. 0 in algorithm 1), thin to thick (also light to dark coloured) solid lines represent the optimal solutions after consecutive iterations and the dashed-dotted blue profiles correspond to the nonlinearly most dangerous inflow spectra for each case (the spectra in table 2).

The mean wall temperature is plotted versus downstream Reynolds number in figure 5, along with
 ${\mathcal{M}}_{\overline{T}_{wall}}/{\mathcal{M}}_{\overline{T}_{wall,0}}$
at each iteration and for both levels of the inflow perturbation energy. The figure shows that, while a cost function based on skin friction promotes early breakdown to turbulence, it does not guarantee that
 ${\mathcal{M}}_{\overline{T}_{wall}}/{\mathcal{M}}_{\overline{T}_{wall,0}}$
is highest. In addition, based on the temperature profiles, while a cost function based on skin friction promotes early breakdown to turbulence, it does not guarantee that the peak temperature in the transition zone is largest. These results demonstrate that optimizing for minimum viscous losses or thermal loading in hypersonic applications would not necessarily lead to the same outcome; an appropriate cost function must be adopted for each choice and the results must be compared.
The focus is hereafter placed on the results from the optimization algorithm, where the cost function is defined using the wall friction. Figure 6 shows the energy spectra of the optimal inflow disturbances
 $$\begin{eqnarray}\displaystyle {\mathcal{E}}_{\langle F,k_{z}\rangle }=\frac{1}{2}\int _{0}^{L_{y}}\hat{\unicode[STIX]{x1D74D}}_{\langle F,k_{z}\rangle }^{\ast }\text{diag}(\unicode[STIX]{x1D743})\hat{\unicode[STIX]{x1D74D}}_{\langle F,k_{z}\rangle }\,\text{d}y, & & \displaystyle\end{eqnarray}$$
where
 $\hat{\unicode[STIX]{x1D74D}}_{\langle F,k_{z}\rangle }$
are the two-dimensional Fourier coefficients of the perturbation vector
 $\unicode[STIX]{x1D74D}^{\prime }\equiv \left[\begin{array}{@{}ccccc@{}}\unicode[STIX]{x1D70C}^{\prime } & u^{\prime } & v^{\prime } & w^{\prime } & T^{\prime }\end{array}\right]^{\mathit{tr}}$
, the subscripts correspond to the frequency
 $F\equiv 10^{6}\,\unicode[STIX]{x1D714}/\sqrt{Re_{x_{0}}}$
and integer spanwise wavenumber
 $k_{z}\equiv \unicode[STIX]{x1D6FD}/(2\unicode[STIX]{x03C0}/L_{z})$
and
 $\hat{\unicode[STIX]{x1D74D}}^{\ast }$
is the complex-conjugate transpose. In (4.2), the term
 $\unicode[STIX]{x1D743}=\left[\begin{array}{@{}ccccc@{}}(R/\unicode[STIX]{x1D6FE}-1)(\overline{T}/\overline{\unicode[STIX]{x1D70C}}) & \overline{\unicode[STIX]{x1D70C}} & \overline{\unicode[STIX]{x1D70C}} & \overline{\unicode[STIX]{x1D70C}} & (R/\unicode[STIX]{x1D6FE}-1)(\overline{\unicode[STIX]{x1D70C}}/\overline{T})\end{array}\right]^{\mathit{tr}}$
ensures that the kinetic and internal energies are appropriately weighted; note that overline in
 $\unicode[STIX]{x1D743}$
denotes the laminar state.
The energy distribution amongst the instability modes at the inflow corresponding to the optimal solutions after the final iteration for cases (a) E1 and (b) E2.

For case E1 (figure 6
a), most of the available energy is allocated to modes
 $\langle 40,3\rangle$
,
 $\langle 100,0\rangle$
and
 $\langle 110,0\rangle$
. The energy ratio among these modes is
 $(1.66:1.18:1)$
. The downstream development of the spectra for all 400 instability waves that comprise the optimal perturbation was evaluated from the direct numerical simulation data (figure 1a in the supplementary material is available at https://doi.org/10.1017/jfm.2019.527), and confirmed that the three identified modes are indeed the most important instability waves at the inlet of the computational domain. Collectively they are responsible for the earliest transition to turbulence for case E1. In order to verify this assertion, a few test cases were performed with variations to the inflow spectrum, which were motivated by figure 6(a) and also by analysis of the downstream development of the instability waves. All tests confirmed that a disturbance comprised of mode
 $\langle 40,3\rangle$
with 43 % of total energy, mode
 $\langle 100,0\rangle$
with 31 % of total energy and mode
 $\langle 110,0\rangle$
with 26 % of total energy is the most potent inflow spectra for case E1. This reduced form of the disturbance is reported in table 2, and will be referred to as E1N, and is examined in detail in § 4.2. The associated skin-friction coefficient is reported in figure 3(a) (dashed blue line).
Cases E1N and E2N are the nonlinearly most dangerous inflow spectra for the low and high energy levels. Cases E1L1, E1L2, E1L3 and E2L are the linearly most unstable inflow spectra.

The spectrum of case E2 after convergence of the optimization algorithm is reported in figure 6(b): most of the available energy is in modes
 $\langle 50,6\rangle$
and
 $\langle 110,1\rangle$
. The ratio of their energy content is
 $(1:2.17)$
. Similar to E1, the downstream development of the spectra for E2 was computed from direct numerical simulation data, for all the 400 wavenumber pairs at the inflow and which can potentially be excited downstream (figure 1b in the supplementary material). Careful assessment of the spectra indicated that modes
 $\langle 50,6\rangle$
and
 $\langle 110,1\rangle$
are the most important elements of the inflow spectra, and are responsible for the earliest transition to turbulence for case E2. This conclusion was verified using several additional simulations where the inflow spectrum was modified and the transition location was compared to the optimal. In one of the tests, the spanwise size of the domain was doubled and the energy of mode
 $\langle 110,1\rangle$
was reassigned to mode
 $\langle 110,\frac{1}{2}\rangle$
in order to ensure that the width of the domain did not influence the outcome of the optimization procedure. All tests confirmed that an inflow disturbance spectrum composed of modes
 $\langle 50,6\rangle$
and
 $\langle 110,1\rangle$
with 32 % and 68 % of total energy, respectively, is the most potent inflow condition for case E2. The skin-friction coefficient associated with this disturbance is reported in figure 3(b) as the dashed blue line. It is designated E2N in table 2, and a detailed description of its transition mechanism is discussed in § 4.2.
The mode shapes of the instability waves of case E1N at the inlet,
 $\sqrt{Re_{x}}=1800$
. (a) Mode
 $\langle 110,0\rangle$
, (b) mode
 $\langle 100,0\rangle$
and (c) mode
 $\langle 40,3\rangle$
. The solid, dashed-dotted and dotted lines are the magnitude, real part and imaginary part of the mode shapes, respectively.

The mode shapes of the instability waves of case E2N at the inlet,
 $\sqrt{Re_{x}}=1800$
. (a) Mode
 $\langle 110,1\rangle$
and (b) mode
 $\langle 50,6\rangle$
. The solid, dashed-dotted and dotted lines are the magnitude, real part and imaginary part of the mode shapes, respectively.

The mode shapes that play an important role in cases E1N and E2N are plotted in figures 7 and 8, respectively. As the
 $\hat{p}$
profiles in figures 7 and 8 indicate, modes
 $\langle 110,0\rangle$
,
 $\langle 100,0\rangle$
and
 $\langle 110,1\rangle$
with one zero crossing of
 $\text{real}(\hat{p})$
in the wall-normal direction are the so-called second-mode instabilities (Mack Reference Mack1984). These are acoustic waves that reflect back and forth between the wall and the sonic line of the relative flow. Modes
 $\langle 40,3\rangle$
and
 $\langle 50,6\rangle$
are first-mode instabilities which, for
 $Ma_{\infty }<5$
, are vorticity waves that can cause strong inflectional instability.
Depending on the wavelength of the modes and the local boundary-layer thickness, the growth rate of the acoustic waves can be much larger than the typical vorticity modes. It is also evident in figures 7 and 8 that, while the second-mode instabilities are large across the boundary layer, the first-mode instabilities have appreciable magnitude only close to its edge. These observations have important implications for the mechanism of transition to turbulence in cases E1N and E2N. For instance, a commonly observed feature in hypersonic and supersonic boundary-layer transition is the generation of elongated streaks from the nonlinear interaction of oblique instability waves (Thumm, Wolz & Fasel Reference Thumm, Wolz and Fasel1990; Jiang et al.
Reference Jiang, Choudhari, Chang and Liu2006; Mayer, Von Terzi & Fasel Reference Mayer, Von Terzi and Fasel2011; Franko & Lele Reference Franko and Lele2013; Sivasubramanian & Fasel Reference Sivasubramanian and Fasel2016). Since streaks are the boundary-layer response to vortical forcing by three-dimensional modes, they are anticipated in case E2N in response to mode
 $\langle 110,1\rangle$
. Also note that mode
 $\langle 110,1\rangle$
has strong wall-normal perturbation which is essential for the lift-up process that leads to the streak response (Zaki & Durbin Reference Zaki and Durbin2005, Reference Zaki and Durbin2006).
4.2 Transition mechanisms
In this section we discuss the two transition mechanisms due to the nonlinearly most dangerous inflow spectra for cases E1N and E2N (table 2), respectively. In the former case, the inflow is comprised of a pair of two-dimensional second-mode disturbances and an oblique first-mode instability wave. We will demonstrate that the resulting breakdown to turbulence cannot be categorized as fundamental and/or oblique, and is hence a new mechanism. Focus will therefore be placed on this case, followed by a relatively brief discussion of the higher energy level where transition takes place via a second-mode oblique breakdown.
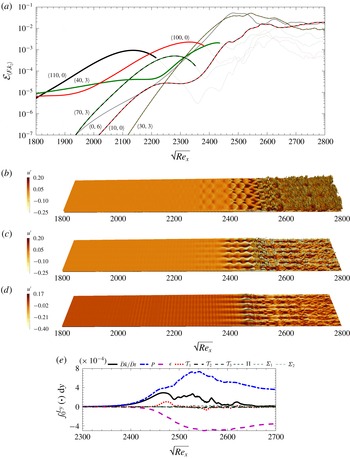
Results corresponding to case E1N. (a) Fluctuation energy content for selected instability modes,
 ${\mathcal{E}}_{\langle F,k_{z}\rangle }$
, versus the streamwise coordinate. Frequency
 $F$
is the normalized frequency and
 $k_{z}$
is the integer spanwise wavenumber, defined in (3.1) and (3.2). (b–d) Instantaneous iso-surfaces of streamwise velocity component, (b)
 $u=0.9$
, (c)
 $u=0.6$
and (d)
 $u=0.3$
, coloured by the streamwise velocity fluctuations
 $u^{\prime }$
. (e) The TKE transport terms integrated in the wall-normal direction along the transition zone.

The downstream development of
 ${\mathcal{E}}_{\langle F,k_{z}\rangle }$
of modes that play a principal role in transition was evaluated using (4.2) and is plotted in figures 9 and 11. For clarity, the curves become thin and faintly coloured beyond the location where their interactions are discussed. Figures 9 and 11 also include instantaneous iso-surfaces of streamwise velocity
 $u$
coloured by its fluctuation
 $u^{\prime }$
. Figures 9(e) and 11(e) feature the downstream development of integrated terms of the TKE equation
 $$\begin{eqnarray}\displaystyle \underbrace{\frac{1}{2}{\displaystyle \frac{\unicode[STIX]{x2202}\overline{\unicode[STIX]{x1D70C}u_{i}^{\prime \prime }u_{i}^{\prime \prime }}}{\unicode[STIX]{x2202}t}}+\frac{1}{2}{\displaystyle \frac{\unicode[STIX]{x2202}\overline{u_{j}}^{f}\overline{\unicode[STIX]{x1D70C}u_{i}^{\prime \prime }u_{i}^{\prime \prime }}}{\unicode[STIX]{x2202}x_{j}}}}_{\bar{D}k/\bar{D}t} & = & \displaystyle \underbrace{-\overline{\unicode[STIX]{x1D70C}u_{i}^{\prime \prime }u_{j}^{\prime \prime }}{\displaystyle \frac{\unicode[STIX]{x2202}\overline{u_{i}}^{f}}{\unicode[STIX]{x2202}x_{j}}}}_{P}\underbrace{-\overline{\unicode[STIX]{x1D70F}_{ij}^{\prime }{\displaystyle \frac{\unicode[STIX]{x2202}u_{i}^{\prime \prime }}{\unicode[STIX]{x2202}x_{j}}}}}_{\unicode[STIX]{x1D716}}\underbrace{-{\displaystyle \frac{1}{2}}\frac{\unicode[STIX]{x2202}\overline{\unicode[STIX]{x1D70C}u_{i}^{\prime \prime }u_{i}^{\prime \prime }u_{j}^{\prime \prime }}}{\unicode[STIX]{x2202}x_{j}}}_{{\mathcal{T}}_{1}}\nonumber\\ \displaystyle & & \displaystyle \underbrace{-{\displaystyle \frac{\unicode[STIX]{x2202}\overline{p^{\prime }u_{i}^{\prime }\unicode[STIX]{x1D6FF}_{ij}}}{\unicode[STIX]{x2202}x_{j}}}}_{{\mathcal{T}}_{2}}+\underbrace{{\displaystyle \frac{\unicode[STIX]{x2202}\overline{\unicode[STIX]{x1D70F}_{ij}^{\prime }u_{i}^{\prime \prime }}}{\unicode[STIX]{x2202}x_{j}}}}_{{\mathcal{T}}_{3}}+\underbrace{\overline{p^{\prime }{\displaystyle \frac{\unicode[STIX]{x2202}u_{i}^{\prime \prime }}{\unicode[STIX]{x2202}x_{i}}}}}_{\unicode[STIX]{x1D6F1}}+\underbrace{\overline{u_{i}^{\prime \prime }}{\displaystyle \frac{\unicode[STIX]{x2202}\overline{\unicode[STIX]{x1D70F}_{ij}}}{\unicode[STIX]{x2202}x_{j}}}}_{\unicode[STIX]{x1D6F4}_{1}}\underbrace{-\overline{u_{i}^{\prime \prime }}{\displaystyle \frac{\unicode[STIX]{x2202}\overline{p}}{\unicode[STIX]{x2202}x_{i}}}}_{\unicode[STIX]{x1D6F4}_{2}}.\end{eqnarray}$$
For an arbitrary quantity
 ${\mathcal{X}}$
, the Reynolds average is denoted by
 $\overline{{\mathcal{X}}}$
, the Favre (density-weighted) average is identified by
 $\overline{{\mathcal{X}}}^{f}$
and fluctuations with respect to the Reynolds and Favre averages are represented as
 ${\mathcal{X}}^{\prime }$
and
 ${\mathcal{X}}^{\prime \prime }$
, respectively. The terms on the right-hand side of (4.3) correspond to production rate
 $P$
, dissipation rate
 $\unicode[STIX]{x1D716}$
, transport by velocity fluctuations
 ${\mathcal{T}}_{1}$
, transport by pressure fluctuation
 ${\mathcal{T}}_{2}$
, transport by viscous diffusion
 ${\mathcal{T}}_{3}$
, pressure dilatation (pressure–strain)
 $\unicode[STIX]{x1D6F1}$
, viscous mass flux coupling
 $\unicode[STIX]{x1D6F4}_{1}$
and pressure mass flux coupling
 $\unicode[STIX]{x1D6F4}_{2}$
.
In case E1N, transition involves a series of instability waves that are activated at various downstream locations (figure 9
a): the inflow modes amplify first and, downstream, spur other instabilities which were not prominently featured in the inlet condition. Specifically, the inlet pair
 $\langle 100,0\rangle$
and
 $\langle 110,0\rangle$
activate mode
 $\langle 10,0\rangle$
– an interaction that we will denote
 ${\mathcal{I}}^{(1)}$
. The resulting mode
 $\langle 10,0\rangle$
is manifest as a low-frequency modulation of the near-wall waves in figure 9(d). In a subsequent interaction
 ${\mathcal{I}}^{(2)}$
, the pair
 $\langle 40,3\rangle$
and
 $\langle 110,0\rangle$
give rise to mode
 $\langle 70,3\rangle$
, which is visible in figure 9(b) near
 $\sqrt{Re_{x}}=2300$
. The next interaction
 ${\mathcal{I}}^{(3)}$
involves the newly formed three-dimensional mode and the inflow wave
 $\langle 100,0\rangle$
. It spurs the instability
 $\langle 30,3\rangle$
which grows at the highest rate, as evident in figure 9(b) in the range
 $2400<\sqrt{Re_{x}}<2550$
, and is the seat of breakdown to turbulence (also see supplementary movie 1). Note that a triad
 ${\mathcal{I}}^{(4)}$
is established between the first two nonlinearly generated waves,
 $\langle 10,0\rangle$
and
 $\langle 40,3\rangle$
, and the fastest amplifying instability
 $\langle 30,3\rangle$
. Flow structures resembling interweaving rope-shaped waves evolve far from the wall prior to breakdown to turbulence in supplementary movie 1, and bear resemblance to those observed experimentally in second-mode transition at Mach 5–8 (Casper et al.
Reference Casper, Beresh, Henfling, Spillers, Pruett and Schneider2016; Laurence et al.
Reference Laurence, Wagner and Hannemann2016).
Streaks feature in the instantaneous field (figures 9
c,d). In the spectra, they correspond to mode
 $\langle 0,6\rangle$
, which can be generated by the nonlinear interaction of modes
 $\langle \pm F,3\rangle$
; their spanwise size is approximately equal to the thickness of the boundary layer at
 $\sqrt{Re_{x}}\approx 2600$
. The energy of the streaks, or mode
 $\langle 0,6\rangle$
, shadows that of mode
 $\langle 30,3\rangle$
which was discussed in connection with the outer
 $\unicode[STIX]{x1D6EC}$
-shaped structure and breakdown to turbulence. The breakdown of the streaks follows almost immediately after that of the outer
 $\unicode[STIX]{x1D6EC}$
shapes.
The interactions
 ${\mathcal{I}}$
described above can only be hypothesized based on the spectra. For example, whether the streaks
 $\langle 0,6\rangle$
are due to the self interactions of
 $\langle \pm 30,3\rangle$
,
 $\langle \pm 40,3\rangle$
or
 $\langle \pm 70,3\rangle$
cannot be conclusively determined; the similarity between
 $\langle \pm 30,3\rangle$
and
 $\langle \pm 0,6\rangle$
suggests a connection but does not guarantee it. In order to quantify the nonlinear interactions, we compute the energy transfer terms among wavenumber triads. Starting from
 ${\mathcal{T}}_{1}$
in (4.3), the following expression for
 ${\mathcal{I}}$
can be derived (see appendix B for details):
 $$\begin{eqnarray}\displaystyle {\mathcal{I}}_{\langle F,k_{z}\rangle }=\mathop{\sum }_{\pm F,\pm k_{z}}\int _{0}^{L_{y}}|\hat{\boldsymbol{{\mathcal{A}}}}_{\langle F_{1},k_{z,1}\rangle }^{\ast }\hat{\boldsymbol{{\mathcal{B}}}}_{\langle F_{2},k_{z,2}\rangle }+\hat{\boldsymbol{{\mathcal{A}}}}_{\langle -F_{2},-k_{z,2}\rangle }^{\ast }\hat{\boldsymbol{{\mathcal{B}}}}_{\langle -F_{1},-k_{z,1}\rangle }|\,\text{d}y, & & \displaystyle\end{eqnarray}$$
where
 $F=F_{2}-F_{1}$
and
 $k_{z}=k_{z,2}-k_{z,1}$
. In equation (4.4),
 $\hat{\boldsymbol{{\mathcal{A}}}}$
and
 $\hat{\boldsymbol{{\mathcal{B}}}}$
are vector quantities containing the Fourier coefficients of
 $\boldsymbol{{\mathcal{A}}}=\left[\begin{array}{@{}ccc@{}}\unicode[STIX]{x1D70C}u^{\prime \prime }u^{\prime \prime } & \unicode[STIX]{x1D70C}u^{\prime \prime }v^{\prime \prime } & \unicode[STIX]{x1D70C}u^{\prime \prime }w^{\prime \prime }\end{array}\right]^{\mathit{tr}}$
and of
 $\boldsymbol{{\mathcal{B}}}=\left[\begin{array}{@{}ccc@{}}u^{\prime \prime } & v^{\prime \prime } & w^{\prime \prime }\end{array}\right]^{\mathit{tr}}.$
The quantity
 ${\mathcal{I}}_{\langle F,k_{z}\rangle }$
thus represents the nonlinear energy transfer among modes
 $\langle F,k_{z}\rangle$
,
 $\langle F_{1},k_{z,1}\rangle$
and
 $\langle F_{2},k_{z,2}\rangle$
(Cheung & Zaki Reference Cheung and Zaki2010). Since
 ${\mathcal{I}}_{\langle F,k_{z}\rangle }$
is independent of the ordering of modes within the triad, it only measures the energy transfer among the three modes but not the direction of the transfer.
In case E1N, nonlinear interactions feature prominently and, therefore,
 ${\mathcal{I}}_{\langle F,k_{z}\rangle }$
for the seven most important interactions is plotted in figure 10. Note that the designation
 $\langle F_{1},k_{z,1}\rangle +\langle F_{2},k_{z,2}\rangle \Rightarrow \langle F,k_{z}\rangle$
in the figure is only intended to identify the triad, and bears no physical significance. However, together with the energy spectra,
 ${\mathcal{I}}_{\langle F,k_{z}\rangle }$
can provide a clearer view of the nonlinear interactions that spur new instability waves. The interaction
 ${\mathcal{I}}^{(1)}$
takes place between inflow modes
 $\langle 100,0\rangle$
and
 $\langle 110,0\rangle$
and generates
 $\langle 10,0\rangle$
. Similarly,
 ${\mathcal{I}}^{(2)}$
takes place between inlet modes
 $\langle 40,3\rangle$
and
 $\langle 110,0\rangle$
and gives rise to
 $\langle 70,3\rangle$
. This emergent mode has a strong interaction
 ${\mathcal{I}}^{(3)}$
with
 $\langle 100,0\rangle$
and leads to
 $\langle 30,3\rangle$
which amplifies at the highest rate. Note also that near
 $\sqrt{Re_{x}}\approx 2300$
, this interaction is overtaken by another triad,
 ${\mathcal{I}}^{(4)}$
, that involves
 $\langle 30,3\rangle$
. The source of the streaks
 $\langle 0,6\rangle$
is not a single interaction, but rather three,
 ${\mathcal{I}}^{(5,6,7)}$
, and each of them is dominant over a different region in the streamwise direction:
 ${\mathcal{I}}^{(5)}$
initiates the streaks in the region
 $\sqrt{Re_{x}}<2150$
;
 ${\mathcal{I}}^{(6)}$
takes over in the range
 $2150<\sqrt{Re_{x}}<2270$
; and finally the interaction
 ${\mathcal{I}}^{(7)}$
is dominant beyond
 $\sqrt{Re_{x}}\approx 2270$
, where the streaks become visible in the instantaneous visualizations (figure 9
c,d), and where mode
 $\langle 0,6\rangle$
shadows
 $\langle 30,3\rangle$
in the spectra.
The role of every interaction, including those that precede the amplification of
 $\langle 30,3\rangle$
, cannot be discounted. We performed exhaustive tests that involved assigning a significant portion of the inflow energy to mode
 $\langle 30,3\rangle$
but transition was delayed. Thus, all the events, including nonlinear interactions and base-flow distortion, that precede the formation of this mode must take place for transition to set in as upstream as recorded in our simulations.
The modal nonlinear energy transfer coefficient, defined in (4.4), computed for the most important modal interactions corresponding to transition scenario of case E1N.

Terms in the TKE equation are shown versus downstream Reynolds number in figure 9(e). Three regions can be distinguished, based on the behaviour of the rate of production
 $P$
, which represents the energy exchange between the base state and the instability waves. (i) In the range
 $2400<\sqrt{Re_{x}}<2500$
, the production increases faster than dissipation; in this region, the instability wave
 $\langle 30,3\rangle$
dominates the spectra and reaches saturation. (ii) In the region
 $2500<\sqrt{Re_{x}}<2550$
, the rate of production increases as the secondary instability sets in and leads to the formation of the
 $\unicode[STIX]{x1D6EC}$
-structures and their local breakdown. (iii) Finally, in the range
 $2550<\sqrt{Re_{x}}<2650$
, the flow starts to approach the statistical state of a self-similar turbulent boundary layer.
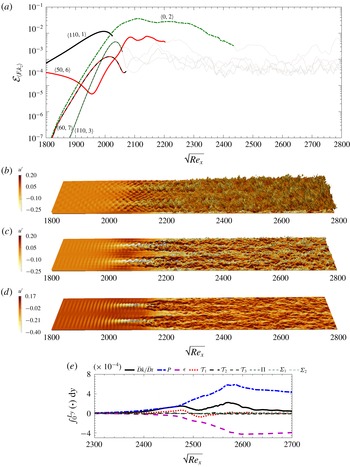
Results corresponding to case E2N. (a) Fluctuation energy content for selected instability modes,
 ${\mathcal{E}}_{\langle F,k_{z}\rangle }$
, versus the streamwise coordinate. Frequency
 $F$
is the normalized frequency and
 $k_{z}$
is the integer spanwise wavenumber, defined in (3.1) and (3.2). (b–d) Instantaneous iso-surfaces of streamwise velocity component, (b)
 $u=0.9$
, (c)
 $u=0.6$
and (d)
 $u=0.3$
, coloured by the streamwise velocity fluctuations
 $u^{\prime }$
. (e) The TKE transport terms integrated in the wall-normal direction along the transition zone.

The transition scenario for case E2N is of different ilk. Figure 11(a) captures the fast emergence and amplification of a streamwise elongated streak mode
 $\langle 0,2\rangle$
. This wave becomes the seat of secondary instability and onset of turbulence. Its instantaneous form is evident in the visualization of the streamwise velocity iso-surfaces (figure 11
b–d). The spanwise size of the structure is nearly three times the boundary-layer thickness at
 $\sqrt{Re_{x}}\approx 2250$
, which is the approximate location where the flow has reached a self-similar turbulent state. Streaks with commensurate sizes were reported in transition at
 $Ma_{\infty }=3$
(Mayer et al.
Reference Mayer, Von Terzi and Fasel2011) and also at
 $Ma_{\infty }=6$
(Franko & Lele Reference Franko and Lele2013).
The streak
 $\langle 0,2\rangle$
is generated by modes
 $\langle \pm 110,1\rangle$
, which initially amplify linearly and peak near
 $\sqrt{Re_{x}}\approx 2000$
(cf. figure 11
a) – the location where the skin-friction coefficient starts to rise (cf. figure 3
b). At this stage, the mode
 $\langle 50,6\rangle$
starts to amplify, and reaches its highest energy level at
 $\sqrt{Re_{x}}\approx 2100$
. In the instantaneous realization, it appears to affect the secondary instability of the streak mode
 $\langle 0,2\rangle$
, which meanders and breaks down to turbulence (figure 11
b–d and supplementary movie 2). This interpretation was verified by examining the spectra and nonlinear energy transfer terms (not shown here); we have also performed numerous linear parabolized stability equation studies of the evolution of instability waves atop the Blasius similarity profile and also the mean-flow profile from case E2N.
Despite describing case E2N as a second-mode oblique transition, it is not without differences from the typical configuration where nearly all the disturbance energy is assigned to the oblique mode and a very small amount is included in broadband noise. For E2N, high levels of energy are included in both modes
 $\langle 110,1\rangle$
and
 $\langle 50,6\rangle$
at the inlet. As a result, their nonlinear interaction is active early upstream and generates mode
 $\langle 60,7\rangle$
(figure 11
a). This and other spurred oblique waves, e.g.
 $\langle 110,3\rangle$
, promote breakdown of the streaky boundary layer to turbulence.
The upstream stages of transition in supplementary movie 2 exhibit alternation of light and dark regions within the bulk of the boundary layer. These regions amplify downstream and ultimately break down into turbulence. While rope-like structures appear near the boundary-layer edge close to transition onset, they do not undergo the spatial growth observed in case E1N. The qualitative change in transition at different levels of disturbance energy is important. A parallel, although not a one-to-one correspondence, can be drawn to the qualitative changes observed in the recent experiments of transition on a slender
 $7^{\circ }$
half-angle cone at Mach 6–7, conducted at low- and high-enthalpy conditions (Laurence et al.
Reference Laurence, Wagner and Hannemann2016).
We can further examine the transition zone of case E2N by considering the evolution of terms in the TKE equation in various subregions (figure 11
e). In a similar manner to the discussion of case E1N, three regions can be identified. (i) In the range
 $2000<\sqrt{Re_{x}}<2100$
, the increase in the rate of production,
 $P$
, is moderate but
 $P$
itself exceeds the integrated
 $\unicode[STIX]{x1D716}$
. The energy of the streaks overtakes all other modes at the start of this region, and their secondary instability is amplifying. (ii) In the region
 $2100<\sqrt{Re_{x}}<2200$
, the secondary instability
 $\langle 50,6\rangle$
is nearly saturated (cf. figure 11
a), and localized patches of turbulence emerge; here the increases in the rate of production and dissipation become steeper, the latter enhanced by the emergence of small turbulent scales. Within the localized patches of turbulence, production exceeds the levels of fully turbulent boundary layers (Marxen & Zaki Reference Marxen and Zaki2019). (iii) In the region
 $2200<\sqrt{Re_{x}}<2300$
, the turbulence spread and fills the domain, and terms in the TKE equation start to relax towards their equilibrium values for self-similar turbulent boundary layers.
Wall-normal profiles of time- and spanwise-averaged streamwise velocity
 $\bar{u}$
(a,b) and temperature
 $\overline{T}$
(c,d) at different locations along the transition zone. (a,c) The profiles of case E1N correspond to
 $2400\leqslant \sqrt{Re_{x}}\leqslant 2700$
with increment of
 $50$
from light to dark colours (also thin to thick lines). (b,d) The profiles of case E2N correspond to
 $2000\leqslant \sqrt{Re_{x}}\leqslant 2300$
with increment of
 $50$
from light to dark colours (also thin to thick lines).

Iso-surfaces of
 $Q=1\times 10^{-4}$
coloured by
 $u^{\prime }$
(a,b) and
 $v^{\prime }$
(c,d) corresponding to cases (a,c) E1N and (b,d) E2N.

The transition processes in cases E1N and E2N are contrasted in figures 12 and 13. The former figure shows wall-normal profiles of the mean streamwise velocity and temperature, evaluated at different streamwise positions within the transition zone. And the latter figure shows three-dimensional views of the vortical structures, visualized using the
 $Q$
-criterion, within the transition regions of both cases. Transition in case E1N takes place via the formation and breakdown of
 $\unicode[STIX]{x1D6EC}$
-shaped vortices. This process takes place over a relatively short streamwise distance as shown qualitatively in figure 13 and demonstrated by the skin-friction coefficient along the plate (figure 3). The relatively abrupt transition is accompanied by a distortion of the mean streamwise velocity profile in the near-wall region, followed by a subsequent relaxation of the outer part of the profile towards the fully turbulent curve. The same trend is captured in the mean temperature profile. In case E2N, transition is due to the secondary instability of streamwise-elongated streaks. While the streaks themselves are not captured in the visualization of the
 $Q$
-criterion, their secondary instability is seen in figure 13(b,d). The transition length is longer in this case, and therefore the mean velocity and temperature profiles gradually approach the turbulent curve.
For case E1N, figure 13(a,c) shows that the
 $\unicode[STIX]{x1D6EC}$
-structures, which are generated as a result of the amplification of mode
 $\langle 30,3\rangle$
, are located close to the edge of the boundary layer. They lie above the near-wall streaks shown in figure 9(d), and successive rows of
 $\unicode[STIX]{x1D6EC}$
-structures are staggered in the spanwise direction. Typical of hairpin structures in wall-bounded flows (see e.g. Adrian Reference Adrian2007; Farano et al.
Reference Farano, Cherubini, Robinet and De Palma2015), their legs lead to ejections in the plane of symmetry while the head generates a strong sweep motion. The wall-normal and streamwise velocity fluctuations therefore have opposite signs in those regions. Ejections due to positive wall-normal velocity fluctuations are accompanied by transport of low streamwise momentum upward and a negative streamwise fluctuation; sweep due to negative
 $v^{\prime }$
leads to downward transport of high-momentum fluid and a positive
 $u^{\prime }$
perturbation. The late stages in the evolution of these
 $\unicode[STIX]{x1D6EC}$
-structures resemble natural transition to turbulence, where trains of hairpin vortices are formed and break down over a short streamwise distance. Since the structures are staggered in the span, a fully turbulent flow is established quickly downstream thus leading to a short transition length.
Figure 13(b,d) for case E2N shows that
 $\unicode[STIX]{x1D6EC}$
-structures form in this case as well, and successive rows are similarly staggered in the spanwise direction. However, breakdown to turbulence does not commence at the tips of individual structures; instead it is initiated due to the instability of the underlying steady streaks. These streaks are clearly captured in figure 11(d), and at the same locations the breakdown pattern is clear in figure 13(b,d). In this region, the streaks are elevated low-speed structures (negative
 $u^{\prime }$
) straddled by
 $\unicode[STIX]{x1D6EC}$
-structures that induce their ejection (positive
 $v^{\prime }$
). Since breakdown takes place on the low-speed streaks, it directly impacts every other row of the
 $\unicode[STIX]{x1D6EC}$
-structures and subsequently spreads to fill the domain; the transition length is therefore longer in this case relative to E1N.
4.3 Prediction from linear stability theory
In order to highlight the importance of the present nonlinear approach in determining the inflow disturbance spectrum, we examine other possible inflow conditions that are selected based on linear theory alone. The starting point is to evaluate the linear evolution of all the Orr–Sommerfeld and Squire instability waves that are part of the inlet condition, using the linear parabolized instability equations (Park & Zaki Reference Park and Zaki2019). The
 $N$
-factor associated with every
 $\langle F,k_{z}\rangle$
wave was obtained as follows:
 $$\begin{eqnarray}\displaystyle N\text{-factor}=\frac{1}{2}\ln \left({\displaystyle \frac{{\mathcal{E}}_{\langle F,k_{z}\rangle }}{{\mathcal{E}}_{0}}}\right), & & \displaystyle\end{eqnarray}$$
where
 ${\mathcal{E}}_{0}$
is the energy of the mode at the inlet. The results are shown for three downstream locations in figure 14(a). Depending on the point at which the growth rates are computed, different instability waves attain the highest
 $N$
-factor value. Figure 14(b) shows the change of
 $N$
-factor versus streamwise location for the four instability waves that are each most amplified within a subregion of the computational domain: mode
 $\langle 110,0\rangle$
for
 $\sqrt{Re_{x}}<2190$
, mode
 $\langle 100,0\rangle$
along
 $2190<\sqrt{Re_{x}}<2470$
, mode
 $\langle 90,0\rangle$
along
 $2470<\sqrt{Re_{x}}<2650$
and mode
 $\langle 20,2\rangle$
for
 $\sqrt{Re_{x}}>2650$
. In order to make use of these results in selecting the inflow condition, prior knowledge of the transition location is needed; linear theory does not provide this information.
(a) Contours of
 $N$
-factor computed from (4.5) from left to right for
 $\sqrt{Re_{x_{f}}}=2100$
,
 $2500$
and
 $2900$
, respectively. (b) The
 $N$
-factor of the important modes versus streamwise location. (c) Skin friction curves corresponding to the nonlinearly most dangerous cases (E1N and E2N) and the linearly most unstable cases (E1L1, E1L2, E1L3 and E2L) presented in table 2.

We examined four inflow conditions that were selected based on the linear results, and computed their evolution using direct numerical simulations in order to compare the outcome to the nonlinearly most dangerous disturbance. These new cases are designated E1L1, E1L2, E1L3 and E2L, and their parameters are reported in table 2. The first three are at the lower inflow energy level and, since transition is expected in the second half of the domain, 99 % of the inflow energy is allocated to modes
 $\langle 100,0\rangle$
,
 $\langle 90,0\rangle$
and
 $\langle 20,2\rangle$
, respectively. The fourth case, E2L, is at the higher inflow energy level and, therefore, 99 % of the inflow energy is assigned to mode
 $\langle 110,0\rangle$
. For all four cases, the remaining 1 % of the inflow energy was in the form of broadband forcing, in order to enable possible nonlinear interactions and secondary instabilities. The outcome of these simulations is contrasted to the nonlinearly most dangerous cases in figure 14(c), where
 $C_{f}$
is plotted versus downstream distance. Note that, for some of these simulations, the domain was extended in the streamwise direction in order to capture the delayed transition to turbulence, in particular in E1L1 and E1L2.
The transition scenarios in the new simulations are very different from those due to the nonlinearly optimal inflow conditions. The streamwise development of the energy of associated key modes is reported in figure 2 of the supplementary material. Cases E1L1 and E1L2 are akin to classical two-dimensional second-mode transition, with a region of oblique secondary instability prior to breakdown. Case E1L3 is a typical first-mode oblique breakdown, in which the primary three-dimensional wave develops oblique instabilities,
 $\unicode[STIX]{x1D6EC}$
-structures and ultimately hairpin vortices that become the seat for the onset of turbulence. Transition in case E2L is a typical second-mode fundamental scenario, where the oblique secondary instability has the same frequency as the primary two-dimensional wave.
In all four cases, the inflow primary instability is the key determinant of the path to turbulence. And while the linearly most unstable waves guarantee fastest exponential growth based on linear theory, they do not necessarily guarantee largest energy in the nonlinear regime or earliest secondary instability and transition. In contrast, when the nonlinearly most dangerous inflow condition was adopted, the resulting transition mechanism was not due to any one particular inflow wave; instead, the nonlinear interactions of the inflow instabilities led to the generation of new waves, the distortion of the base flow and the earliest possible transition location.
5 Summary and conclusions
An EnVar algorithm is introduced to evaluate the nonlinearly most dangerous inflow disturbance that results in the earliest location of laminar-to-turbulence transition in a high-speed boundary layer. This disturbance (i) has a prescribed amount of total energy, (ii) satisfies the full Navier–Stokes equations and (iii) undergoes the fastest breakdown to turbulence. The first two elements are constraints, and the third is the objective of the optimization procedure and was modelled using a cost function that is proportional to the integral of the skin friction along the plate. The EnVar algorithm starts from an estimate of the optimal inflow condition, which in the present work is initialized to be a broadband disturbance. An ensemble of possible solutions is then constructed around the current estimate, and all members are advanced using the Navier–Stokes equations. The associated outcomes are used to evaluate the gradient of the cost function which, in turn, is used to update the estimate of the optimal inflow condition. A new ensemble is then formed around the estimated solution, and the process is repeated until convergence.
The algorithm was applied in the case of ZPG boundary-layer flow at free-stream Mach number
 $M_{\infty }=4.5$
, and for two levels of the inflow disturbance energy. The level of energy of the first case is of the same order as the kinetic energy of stratospheric turbulent layers, measured during a recent experimental campaign in an attempt to replicate the environmental conditions of high-altitude flight tests. The second case had energy 50 times larger, in order to highlight the effect of this parameter on the outcome of the algorithm. The laminar-to-turbulence transition scenarios due to the nonlinearly most dangerous disturbances from each case were examined in detail. While at the higher energy level, transition displays symptoms of second-mode oblique breakdown, the lower energy case cannot be ascribed to any classical route. Instead, transition is initiated due to nonlinear interactions of a couple of normal acoustic second modes and an oblique vortical first mode. The interactions spur new instabilities and distort the mean flow, ultimately leading to very rapid growth of three-dimensional disturbances that form
 $\unicode[STIX]{x1D6EC}$
-structures and break down to turbulence.
A number of other inflow conditions, all selected based on the amplification rates from linear theory, were also examined using direct numerical simulations. These efforts invariably led to classical breakdown scenarios and, for the same level of inflow energy, delayed transition onset relative to the nonlinearly most dangerous disturbance. The results thus highlight that a nonlinear approach to the design of the inflow condition is required in order to obtain the minimum transition Reynolds number. We expressed the inflow disturbance as a superposition of instability waves, and optimized their amplitudes and relative phases using the full Navier–Stokes equations. This approach bridges the gap between LST which excludes the nonlinear terms and transition which must involve nonlinearity in order to effect the energy cascade that sustains turbulence.
The EnVar approach is applicable with other choices of the cost function, for example based on the downstream development of the disturbance energy or wall temperature. The behaviours of these two quantities were examined when the cost function was based on skin friction. The results demonstrated that the optimal inflow disturbance is likely to differ, in particular if the cost function is based on wall temperature. Despite the present use of direct numerical simulations, the EnVar approach is compatible with any forward model of the Navier–Stokes equations (e.g. nonlinear parabolized stability equations, large-eddy simulations). It is therefore attractive to adopt EnVar with a lower fidelity method, in order to reduce the computational cost and to explore new directions, e.g. search for global optima, the dependence of transition Reynolds number on the energy of the inflow disturbance and the impact of the cost function.
The nonlinearly most dangerous disturbance provides an objective measure for evaluating design performance, in particular when environmental disturbances are uncertain. If a design is modified, for instance for the purpose of delaying transition, the spectral content of what constitutes the most dangerous disturbance will, however, change and must be re-evaluated. If transition is delayed in the new configuration, design surety is guaranteed.
Acknowledgements
This work was supported in part by the US Air Force Office of Scientific Research (grant no. FA9550-16-1-0103) and by the Office of Naval Research (grant no. N00014-17-1-2339). Computational resources were provided by the Maryland Advanced Research Computing Center (MARCC). The authors are grateful to Professor J. Larsson for sharing the Hybrid code.
Supplementary data
Supplementary data are available at https://doi.org/10.1017/jfm.2019.527.
Appendix A. Ensemble generation algorithm
In this appendix, the algorithm for constructing the ensemble members that are used in the optimization procedure (2.26) is described. The starting point is the mean control vector,
 $\boldsymbol{c}^{(e)}$
, which is either the initial guess or the outcome of the optimization at the end of the previous iteration, and satisfies the energy constraint. The objective is to generate an ensemble of control vectors,
 $\boldsymbol{c}^{(r)}$
for
 $r=1$
to
 $N_{en}$
, around this mean; the relationship between
 $\boldsymbol{c}^{(e)}$
and
 $\boldsymbol{c}^{(r)}$
is given by (2.19), and therefore
 $\boldsymbol{c}^{(e)}$
is not the arithmetic average of the members. The latter must not deviate appreciably from the mean, in a sense that will be quantified using the variance of the ensemble, and must each satisfy the energy constraint as well. Another important consideration is that, for a particular ensemble size
 $N_{en}$
, the members must span the control vector subspace as best as possible and be well-conditioned. The ensemble generation algorithm has two main steps: first, a very large random ensemble is formed that satisfies specific criteria; second, a smaller ensemble is determined from the larger one, and whose members are better conditioned. A detailed description of the first step is presented here, while for the second step we only quote the procedure and refer the reader to Evensen (Reference Evensen2009, chap. 11) for its theoretical foundation and proof of concept.
In the first step of the algorithm, our concern is to enforce the constraints that the ensemble members should satisfy rather than how well the ensemble is conditioned. Therefore, in order to ensure that the members span the control-vector subspace, we generate a very large ensemble. Since the members will be randomly generated, and assuming a very large size of the ensemble, it is very likely that any possible control vector can be expressed as a linear superposition of the ensemble members. There are three constraints that must be satisfied, related to the mean, covariance and energy. As discussed in § 2.2, satisfying the energy constraint by the mean and ensemble members is not possible if the arithmetic average is adopted. In order to address this challenge, we performed two change of variables during the algorithm, referred to as
 $\boldsymbol{e}$
and
 $\hat{\boldsymbol{e}}$
later in this appendix. And the covariance constraint is to ensure that the members of the ensemble are close to their mean, which is an essential condition of the EnVar optimization procedure.
We start by constructing the very large ensemble of size
 $\unicode[STIX]{x1D6F6}\times N_{en}$
. In analogy to (2.19), the ensemble members are related to the mean by
 $$\begin{eqnarray}\displaystyle \unicode[STIX]{x1D63C}_{1}\boldsymbol{c}^{(e)}\circ \unicode[STIX]{x1D63C}_{1}\boldsymbol{c}^{(e)}={\displaystyle \frac{1}{\unicode[STIX]{x1D6F6}N_{en}}}\mathop{\sum }_{r=1}^{\unicode[STIX]{x1D6F6}N_{en}}\unicode[STIX]{x1D63C}_{1}\boldsymbol{c}^{(r)}\circ \unicode[STIX]{x1D63C}_{1}\boldsymbol{c}^{(r)}, & & \displaystyle\end{eqnarray}$$
and
 $$\begin{eqnarray}\displaystyle \unicode[STIX]{x1D63C}_{2}\boldsymbol{c}^{(e)}=\frac{1}{\unicode[STIX]{x1D6F6}N_{en}}\mathop{\sum }_{r=1}^{\unicode[STIX]{x1D6F6}N_{en}}\unicode[STIX]{x1D63C}_{2}\boldsymbol{c}^{(r)}, & & \displaystyle\end{eqnarray}$$
where
 $\unicode[STIX]{x1D63C}_{1}$
and
 $\unicode[STIX]{x1D63C}_{2}$
are defined in equations (2.12) and (2.20), respectively.
The above two equalities can be encoded into one expression by defining
 $\boldsymbol{e}^{(r)}\in \mathbb{R}^{2M\times 1}$
:
 $$\begin{eqnarray}\displaystyle \boldsymbol{e}^{(r)}\equiv \unicode[STIX]{x1D63C}_{1}\boldsymbol{c}^{(r)}\circ \unicode[STIX]{x1D63C}_{1}\boldsymbol{c}^{(r)}+\unicode[STIX]{x1D63C}_{2}\boldsymbol{c}^{(r)}, & & \displaystyle\end{eqnarray}$$
whose arithmetic average is
 $\boldsymbol{e}^{(e)}$
. A further change of variables is introduced in order to simplify the algorithm
 $$\begin{eqnarray}\displaystyle \hat{\boldsymbol{e}}^{(r)}\equiv \unicode[STIX]{x1D64E}^{-1}(\boldsymbol{e}^{(r)}-\boldsymbol{e}^{(e)}), & & \displaystyle\end{eqnarray}$$
where the diagonal matrix
 $\unicode[STIX]{x1D64E}$
is equal to
 $\mathbf{diag}(\unicode[STIX]{x1D748})$
and
 $\unicode[STIX]{x1D748}$
is a vector containing the desired standard deviations of the original ensemble members from their mean. By construction,
 $\hat{\boldsymbol{e}}^{(r)}$
has a zero mean and unit variance. Furthermore, as long as the members of the original ensemble and their mean,
 $\boldsymbol{e}^{(r)}$
and
 $\boldsymbol{e}^{(e)}$
, satisfy the energy constraint, the energy of
 $\hat{\boldsymbol{e}}^{(r)}$
is zero. Thus the ensemble that we are seeking satisfies the following conditions:
 $$\begin{eqnarray}\displaystyle & \displaystyle \hat{\unicode[STIX]{x1D64B}}\boldsymbol{b}_{1}=0, & \displaystyle\end{eqnarray}$$
 $$\begin{eqnarray}\displaystyle & \displaystyle \hat{\unicode[STIX]{x1D64B}}\hat{\unicode[STIX]{x1D64B}}^{\mathit{tr}}=(\unicode[STIX]{x1D6F6}N_{en}-1)\hat{\unicode[STIX]{x1D63E}}, & \displaystyle\end{eqnarray}$$
and
 $$\begin{eqnarray}\displaystyle \boldsymbol{b}_{1}^{\mathit{tr}}\unicode[STIX]{x1D63C}_{1}\hat{\unicode[STIX]{x1D64B}}=0, & & \displaystyle\end{eqnarray}$$
where
 $$\begin{eqnarray}\displaystyle & \displaystyle \hat{\unicode[STIX]{x1D64B}}=\left[\begin{array}{@{}cccc@{}}\hat{\boldsymbol{e}}^{(1)} & \hat{\boldsymbol{e}}^{(2)} & \ldots & \hat{\boldsymbol{e}}^{(\unicode[STIX]{x1D6F6}N_{en})}\end{array}\right]_{2M\times \unicode[STIX]{x1D6F6}N_{en}}, & \displaystyle\end{eqnarray}$$
 $$\begin{eqnarray}\displaystyle & \displaystyle \hat{\unicode[STIX]{x1D63E}}=\left[\begin{array}{@{}cc@{}}\left[\begin{array}{@{}c@{}}{\mathcal{C}}_{ij}\end{array}\right]_{M\times M} & \unicode[STIX]{x1D64A}_{M\times M}\\ \unicode[STIX]{x1D64A}_{M\times M} & \unicode[STIX]{x1D644}_{M\times M}\end{array}\right]_{2M\times 2M}, & \displaystyle\end{eqnarray}$$
 $$\begin{eqnarray}\displaystyle & \displaystyle \boldsymbol{b}_{1}=\left[\begin{array}{@{}cccc@{}}1 & 1 & \ldots \, & 1\end{array}\right]_{1\times 2M}^{\mathit{tr}}. & \displaystyle\end{eqnarray}$$
In the above,
 ${\mathcal{C}}_{ij}={\mathcal{C}}_{ji}$
are the correlation coefficients and
 ${\mathcal{C}}_{ii}=1$
,
 $\unicode[STIX]{x1D644}$
is the identity matrix,
 $\unicode[STIX]{x1D64A}$
is a zero matrix and
 $\unicode[STIX]{x1D63C}_{1}$
is defined in (2.12). Equation (A 4a
) ensures that the mean of the ensemble is zero, equation (A 4b
) is the covariance constraint and (A 4c
) enforces the energy constraint on all members of the ensemble. Note that the condition
 ${\mathcal{C}}_{ii}=1$
is a consequence of the normalization in (A 3).
The problem can be simplified further by combing the covariance and the energy constraints. From (A 4b
) and (A 4c
), we obtain
 $\boldsymbol{b}_{1}^{\mathit{tr}}\unicode[STIX]{x1D63C}_{1}\hat{\unicode[STIX]{x1D63E}}=0$
, and therefore the energy constraint is equivalent to
 $\sum _{j=1}^{M}{\mathcal{C}}_{ij}=0$
. Thus, we can redefine the problem as evaluating a set of
 $\hat{\boldsymbol{e}}$
whose arithmetic average is zero, and that are correlated with one another such that the components of their covariance matrix satisfy
 $\sum _{j=1}^{M}{\mathcal{C}}_{ij}=0$
. The former condition is satisfied by randomly generating uncorrelated control vectors,
 $\boldsymbol{y}^{(r)}$
, that have a zero mean; and the latter condition is enforced by performing Cholesky factorization of the covariance matrix and setting
 $\hat{\boldsymbol{e}}^{(r)}=\unicode[STIX]{x1D647}\boldsymbol{y}^{(r)}$
, where
 $\unicode[STIX]{x1D647}$
is the lower triangular matrix of the factorization. By definition,
 $\hat{\boldsymbol{e}}^{(r)}$
satisfy both conditions. Using the symmetry of
 $\hat{\unicode[STIX]{x1D63E}}$
, we can obtain
 $\hat{\unicode[STIX]{x1D63E}}\unicode[STIX]{x1D63C}_{1}\boldsymbol{b}_{1}=0$
. Hence, zero is an eigenvalue of
 $\hat{\unicode[STIX]{x1D63E}}$
and
 $\unicode[STIX]{x1D63C}_{1}\boldsymbol{b}_{1}$
is an eigenvector; the dimension of the eigenspace corresponding to this eigenvalue is unity, and the rank of
 $\hat{\unicode[STIX]{x1D63E}}$
is equal to
 $2M-1$
. A new covariance matrix is defined whose rank is equal to
 $2M$
as
 $$\begin{eqnarray}\displaystyle \hat{\hat{\unicode[STIX]{x1D63E}}}=\left[\begin{array}{@{}cc@{}}1 & \boldsymbol{o}^{\mathit{tr}}\\ \boldsymbol{ o} & \hat{\unicode[STIX]{x1D63E}}\end{array}\right]_{(2M+1)\times (2M+1)}, & & \displaystyle\end{eqnarray}$$
where
 $\boldsymbol{o}\in \mathbb{R}^{2M\times 1}$
is a vector of all zeros. Note that zero is still an eigenvalue of
 $\hat{\hat{\unicode[STIX]{x1D63E}}}$
. Therefore, a reconstruction from its non-zero singular values and associated singular vectors is used in the Cholesky factorization, in order to obtain the lower triangular matrix
 $\unicode[STIX]{x1D647}\in \mathbb{R}^{2M\times 2M}$
.

The above procedure completes the first step of the ensemble generation, and provides a set of
 $\hat{\boldsymbol{e}}^{(r)}\in \mathbb{R}^{2M\times 1}$
which satisfy (A 4). The second step of the algorithm is to identify, from this large set of members, the best possible ensemble with size
 $N_{en}$
. This task involves singular-value decomposition of the large ensemble and choosing the
 $N_{en}$
dominant singular vectors and values as the new ensemble. In the limit of
 $\unicode[STIX]{x1D6F6}N_{en}\rightarrow \infty$
, the singular vectors and values of the large ensemble will converge to eigenvectors and eigenvalues of the full-rank ensemble realizations (an ensemble that represents the physical problem exactly). Using the singular-value decomposition of the larger-sized ensemble to approximate its smaller-sized representation, therefore, ensures that for a given size the new ensemble provides the best possible rendition. The complete procedure for the ensemble generation is summarized in algorithm 2.
Appendix B. Nonlinear energy transfer
In this appendix, the derivation of the nonlinear energy transfer term
 ${\mathcal{I}}_{\langle F,k_{z}\rangle }$
is presented, where
 $$\begin{eqnarray}\displaystyle {\mathcal{I}}_{\langle F,k_{z}\rangle }=\mathop{\sum }_{\pm F,\pm k_{z}}\int _{0}^{L_{y}}\left|\hat{\boldsymbol{{\mathcal{A}}}}_{\langle F_{1},k_{z,1}\rangle }^{\ast }\hat{\boldsymbol{{\mathcal{B}}}}_{\langle F_{2},k_{z,2}\rangle }+\hat{\boldsymbol{{\mathcal{A}}}}_{\langle -F_{2},-k_{z,2}\rangle }^{\ast }\hat{\boldsymbol{{\mathcal{B}}}}_{\langle -F_{1},-k_{z,1}\rangle }\right|\text{d}y. & & \displaystyle\end{eqnarray}$$
Superscript
 $\ast$
denotes complex-conjugate transpose and
 $|.|$
is the absolute value. The starting point is the transport term
 ${\mathcal{T}}_{1}$
in the TKE equation (4.3), which is a nonlinear redistribution of energy between different perturbations. While all the other contributions in the energy equation originate from linear terms of the momentum balance,
 ${\mathcal{T}}_{1}$
arises from the nonlinear advection term.
By integrating
 ${\mathcal{T}}_{1}$
in the wall-normal direction, we obtain
 $$\begin{eqnarray}\displaystyle \int _{y}{\mathcal{T}}_{1}\,\text{d}y=-\frac{1}{2}\overline{{\displaystyle \frac{\unicode[STIX]{x2202}}{\unicode[STIX]{x2202}x}}\left(\underbrace{\int _{0}^{L_{y}}\left(\boldsymbol{{\mathcal{A}}}\boldsymbol{\cdot }\boldsymbol{{\mathcal{B}}}\right)\,\text{d}y}_{{\mathcal{I}}}\right)}=-\frac{1}{2}\overline{{\displaystyle \frac{\unicode[STIX]{x2202}}{\unicode[STIX]{x2202}x}}\left(\underbrace{\int _{0}^{L_{y}}\left(\boldsymbol{{\mathcal{A}}}^{\ast }\boldsymbol{{\mathcal{B}}}\right)\,\text{d}y}_{{\mathcal{I}}}\right)}, & & \displaystyle\end{eqnarray}$$
where the vector quantities are defined as
 ${\mathcal{A}}_{i}=\unicode[STIX]{x1D70C}(u_{j}^{\prime \prime }\unicode[STIX]{x1D6FF}_{1j})u_{i}^{\prime \prime }$
and
 ${\mathcal{B}}_{i}=u_{i}^{\prime \prime }$
, and the variable
 ${\mathcal{I}}$
represents the nonlinear interaction. In the above expression, it was assumed that the fluctuations vanish at the top and bottom boundaries of the domain and, as such, only the streamwise advection is retained. Using the two-dimensional Fourier representations of the vectors
 $\boldsymbol{{\mathcal{A}}}$
and
 $\boldsymbol{{\mathcal{B}}}$
in temporal frequency and spanwise wavenumber,
 ${\mathcal{I}}$
can be rewritten as
 $$\begin{eqnarray}\displaystyle {\mathcal{I}}=\int _{0}^{L_{y}}\!\!\left(\mathop{\sum }_{a,p}\mathop{\sum }_{b,q}\left(\hat{\boldsymbol{{\mathcal{A}}}}_{\langle F_{a},k_{z,p}\rangle }^{\ast }\hat{\boldsymbol{{\mathcal{B}}}}_{\langle F_{b},k_{z,q}\rangle }\right)\text{e}^{-\text{i}\left({\displaystyle \frac{2\unicode[STIX]{x03C0}(-k_{z,p}+k_{z,q})}{L_{z}}}z+{\displaystyle \frac{\sqrt{Re_{x_{0}}}(-F_{a}+F_{b})}{10^{6}}}t\right)}\!\!\right)\text{d}y. & & \displaystyle \nonumber\\ \displaystyle & & \displaystyle\end{eqnarray}$$
A new variable is defined as
 $\hat{{\mathcal{I}}}_{\langle F,k_{z}\rangle }=\sum _{a,p}\sum _{b,q}\hat{\boldsymbol{{\mathcal{A}}}}_{\langle F_{a},k_{z,p}\rangle }^{\ast }\hat{\boldsymbol{{\mathcal{B}}}}_{\langle F_{b},k_{z,q}\rangle }$
, where the summation is performed over all
 $\langle F_{a},k_{z,p}\rangle$
and
 $\langle F_{b},k_{z,q}\rangle$
that satisfy
 $F=F_{b}-F_{a}$
and
 $k_{z}=k_{z,q}-k_{z,p}$
. In terms of
 $\hat{{\mathcal{I}}}_{\langle F,k_{z}\rangle }$
, equation (B 3) becomes
 $$\begin{eqnarray}\displaystyle {\mathcal{I}}=\mathop{\sum }_{F,k_{z}}\left(\int _{0}^{L_{y}}\hat{{\mathcal{I}}}_{\langle F,k_{z}\rangle }\,\text{d}y\right)\text{e}^{-\text{i}\left({\displaystyle \frac{2\unicode[STIX]{x03C0}k_{z}}{L_{z}}}z+{\displaystyle \frac{\sqrt{Re_{x_{0}}}F}{10^{6}}}t\right)}. & & \displaystyle\end{eqnarray}$$
Therefore the quantity
 $\hat{{\mathcal{I}}}_{\langle F,k_{z}\rangle }$
represents the total amount of energy transferred into mode
 $\langle F,k_{z}\rangle$
due to the interaction of all relevant modal pairs (Cheung & Zaki Reference Cheung and Zaki2010). We here focus our attention on the energy transferred into
 $\langle +F,+k_{z}\rangle$
due to the specific pair
 $\langle F_{1},k_{z,1}\rangle$
and
 $\langle F_{2},k_{z,2}\rangle$
; the associated nonlinear modal energy transfer coefficient can be defined as
 $$\begin{eqnarray}\displaystyle {\mathcal{I}}_{\langle +F,+k_{z}\rangle }=\int _{0}^{L_{y}}\left|\hat{\boldsymbol{{\mathcal{A}}}}_{\langle F_{1},k_{z,1}\rangle }^{\ast }\hat{\boldsymbol{{\mathcal{B}}}}_{\langle F_{2},k_{z,2}\rangle }+\hat{\boldsymbol{{\mathcal{A}}}}_{\langle -F_{2},-k_{z,2}\rangle }^{\ast }\hat{\boldsymbol{{\mathcal{B}}}}_{\langle -F_{1},-k_{z,1}\rangle }\right|\,\text{d}y. & & \displaystyle\end{eqnarray}$$
Ultimately, we add the contributions from all four quadrants, and adopt the shorthand
 $$\begin{eqnarray}{\mathcal{I}}_{\langle F,k_{z}\rangle }=\sum {\mathcal{I}}_{\langle \pm F,\pm k_{z}\rangle }=\mathop{\sum }_{\pm F,\pm k_{z}}\int _{0}^{L_{y}}\left|\hat{\boldsymbol{{\mathcal{A}}}}_{\langle F_{1},k_{z,1}\rangle }^{\ast }\hat{\boldsymbol{{\mathcal{B}}}}_{\langle F_{2},k_{z,2}\rangle }+\hat{\boldsymbol{{\mathcal{A}}}}_{\langle -F_{2},-k_{z,2}\rangle }^{\ast }\hat{\boldsymbol{{\mathcal{B}}}}_{\langle -F_{1},-k_{z,1}\rangle }\right|\text{d}y.\end{eqnarray}$$