Introduction
Surgical correction of conductive hearing loss in cases of otosclerosis is one of the most successful procedures in otology. Early reports on large series of stapedectomies demonstrated excellent results, with air–bone gap (ABG) closure of 10 dB or more in greater than 90 per cent of patients.Reference Shea, Sanabria and Smyth1–Reference Sheehy, Nelson and House3 Since the introduction of stapedectomy by Shea in 1956, the procedure has been significantly refined. In addition to evolution of the surgical technique, the criteria for reporting the outcome of stapes surgery have been revised.
Closure of the ABG was initially considered to be the main measure of success for stapes surgery. Historically, ABG closure was calculated by comparing post-operative pure tone average (PTA) thresholds for air conduction with pre-operative bone conduction thresholds at only three frequencies (0.5, 1 and 2 kHz). This method has a number of flaws, in that post-operative deterioration in bone conduction at 0.5–2 kHz was missed, as was sensorineural hearing loss at high frequencies; it could also result in an artificially improved post-operative ABG by inclusion of overclosure in the calculation. In order to overcome these limitations, in 1995 the American Academy of Otolaryngology, Head and Neck Surgery committee on hearing and equilibrium recommended inclusion of the higher frequency of 3 kHz in the calculation of PTAs, and the use of post-operative bone conduction thresholds when calculating the post-operative ABG.4 However, despite committee recommendations to report the change in bone conduction at 3 kHz for each case, this parameter remains under-reported. The new guidelines also recommended reporting raw data along with summary data whenever possible. While most of the literature on stapes surgery has been concerned with reporting summary statistics of surgical results, a few publications have provided detailed, raw data representing individual cases.Reference Tange, De Bruijn, Dreschler, Rosowski and Merchant5, Reference Tange, Grolman and Dreschler6
In 2001, De Bruijn et al. Reference De Bruijn, Tange and Dreschler7 proposed a way of reporting results from individual cases – the Amsterdam hearing evaluation plots method. This innovation aimed to present results for each operated ear separately, with regard to pre- and post-operative bone conduction thresholds and the relationships between pre-operative ABG and gain in post-operative air conduction thresholds. Browning et al. Reference Browning, Gatehouse and Swan8 also introduced the Glasgow benefit plot for evaluation of bilateral hearing function in each individual case of middle-ear surgery. To the best of our knowledge, no large series of stapedotomies evaluated by these methods have been reported in the indexed, English language medical literature.
The objective of this study was to analyse the outcomes of 1145 stapedotomies, according to the current guidelines of the American Academy of Otolaryngology, Head and Neck Surgery committee on hearing and equilibrium for the evaluation of conductive hearing loss treatment, and simultaneously to evaluate these results using Amsterdam hearing evaluation plots. Results for the analysis of binaural hearing function by Glasgow benefit plots have been reported in a separate paper. A detailed analysis of hearing thresholds at 4 kHz has been performed in order to evaluate surgical trauma to the cochlea, since bone conduction thresholds at this frequency have been found to be the most sensitive indicator of inner-ear damage.Reference Smyth9
Materials and methods
The charts for 1369 consecutive stapedotomy cases performed by one surgeon (JHH, the senior author) from 1991 to 2006 were reviewed. Of these 1369 cases, 89 were revision stapedotomies and 48 were performed for congenital stapes fixation. Eighty-seven cases were excluded from the study due to incomplete data. The audiometric results of 1145 primary stapedotomies for otosclerosis were included for evaluation. Six hundred and ninety-five patients (61 per cent) were women and 450 (39 per cent) were men. The mean age was 45 years (standard deviation (SD) 12 years), with a range of 16 to 84 years. The mean follow up was 16.4 months (SD 19.2 months), with a range of 0.25 to 117 months.
Stapedotomy was performed using the reverse order techniqueReference Smyth10, Reference Fish11 via a per meatal approach. A modified Cawthorne (0.3 mm diameter) prosthesis was used until 2002, in 756 cases. Thereafter, a modified Causse (0.4 mm diameter) prosthesis was used, in 376 procedures. A 0.4 mm (for Cawthorne prostheses) or 0.5 mm (for Causse prostheses) fenestra was made in the footplate using Halik graduated perforators. Adjunctive use of an Argon beam laser (wavelength 512 nm), delivered via an EndoOtoprobe™ (Lumenis, inc. Salt-Lake City, UT, USA), was introduced in 2000. The laser-assisted procedures were performed on 516 patients. A modification of the reverse order technique was made in conjunction with introduction of the laser: the Argon laser was used to vaporise the stapedial tendon and posterior crus of the stapes, prior to footplate fenestration. The laser was also used to begin the footplate fenestration by providing a ‘set-hole’ for the perforators. Fenestration was completed with graduated perforators. The laser also proved useful in dealing with adhesions.
Hearing outcomes were analysed according to the 1995 American Academy of Otolaryngology, Head and Neck Surgery committee on hearing and equilibrium guidelines.4 Air conduction thresholds at 0.5, 1, 2, 3, 4, 6, 8 and 12 kHz and bone conduction thresholds at 0.5, 1, 2, 3 and 4 kHz, for operated and non-operated ears, were tabulated in a computer database. Mean pre-operative values for air and bone conduction pure tone averages and for ABG, at 0.5, 1, 2 and 3 kHz, were compared with corresponding post-operative values. The beginning of this study period pre-dated the 1995 American Academy of Otolaryngology, Head and Neck Surgery guidelines, and therefore 3 kHz results were not available for all patients. In such cases, 3 kHz air and bone conduction values were estimated by averaging results for 2 and 4 kHz. Post-operative bone conduction values were used to calculate the post-operative ABG. Post-operative ABGs were also calculated for the frequencies 0.5, 1 and 2 kHz and the frequencies 0.5, 1, 2 and 4 kHz, in order to evaluate the effects of these different audiometric parameters on the success rate. Mean pre- and post-operative air and bone conduction thresholds at 4 kHz were also assessed separately, in order to evaluate the impact of stapedotomy on hearing at high frequencies. Pre- and post-operative speech reception thresholds were also evaluated. The mean pre-operative hearing level, calculated as a PTA at the frequencies 0.5, 1, 2 and 3 kHz, was 54 dB (SD 15 dB), and the mean pre-operative ABG was 28 dB (SD 9 dB). One hundred and forty-four (13 per cent) patients were treated for severe or profound hearing loss (pre-operative hearing levels ≥71 dB).
In addition to reporting averaged results prepared from the mean values of several audiometric parameters, we also utilised Amsterdam hearing evaluation plotsReference De Bruijn, Tange and Dreschler7 to produce a visual presentation of the operative course of each individually operated ear. Pre-operative bone conduction PTAs were plotted against corresponding post-operative bone conduction PTAs, and pre-operative ABG values were plotted against air conduction gains, for each individual case, allowing data for individual patients to be recognised as plot points on a graph.
Data were analysed with the statistical software program Statistica 6.0 (StatSoft, Tulsa, Oklahoma, USA). Statistical analysis was carried out for comparisons between pre- and post-operative values, using the paired t-test for the evaluation of air and bone conduction pure tone averages, speech reception thresholds and ABGs. The criterion selected for statistical significance was p < 0.05.
Results and analysis
Pure tone thresholds
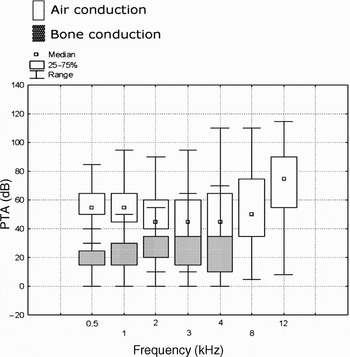
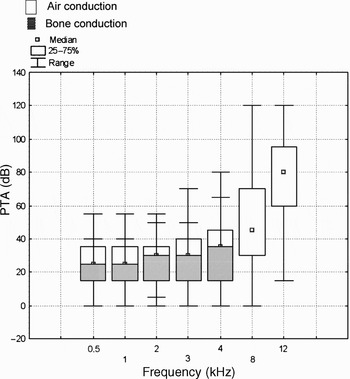
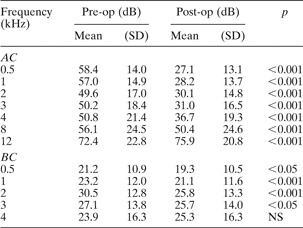
A frequency-specific analysis of pre- and post-operative air and bone conduction levels demonstrated statistically significant improvement at all frequencies, except for bone conduction thresholds at 4 kHz and air conduction thresholds at 12 kHz (Table I). Figures 1 and 2 demonstrate pre- and post-operative audiograms reconstructed as box and whisker plots showing mean air and bone conduction values. This method allowed graphical presentation of a large amount of raw data, without hiding unsuccessful cases.
Reconstruction of pre-operative audiogram using mean air and bone conduction thresholds at 0.5, 1, 2 and 3 kHz.

Reconstruction of post-operative audiogram using mean air and bone conduction thresholds at 0.5, 1, 2 and 3 kHz.

Pre- and post-operative air and bone conduction by frequency

Pre-op = pre-operative; post-op = post-operative; SD = standard deviation; AC = air conduction; BC = bone conduction; NS = not significant
Air and bone conduction, air–bone gap and speech reception thresholds
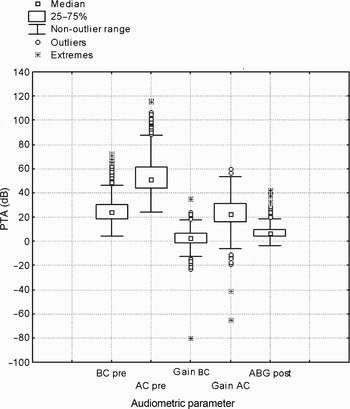
Figure 3 summarises the pre- and post-operative air and bone conduction thresholds and ABGs as box and whisker plots. Govartes et al. Reference Govartes, Somers and Offeciers12 have proposed combining, in one graph, box and whisker plots of several variables in order to enable detailed representation of a large amount of audiometric data. The median value is depicted as a central dot, the dispersion as a box and the range as whiskers. Outliers are depicted by separate dots beyond the whiskers. The post-operative, four-frequency average ABG was 7 dB (SD 6 dB), compared with 28 dB (SD 9 dB) pre-operatively (p < 0.0001). The mean post-operative speech reception threshold was 27 dB (SD 12 dB), compared with 51 dB (SD 14 dB) pre-operatively (p < 0.0001). The mean post-operative bone conduction threshold was 25 dB (SD 11 dB), compared with 24 dB (SD 11 dB) pre-operatively (p < 0.0001).
Main audiometric parameters presented as box and whisker plot. BC = bone conduction; AC = air conduction; ABG = air–bone gap

Air and bone conduction at 4 kHz
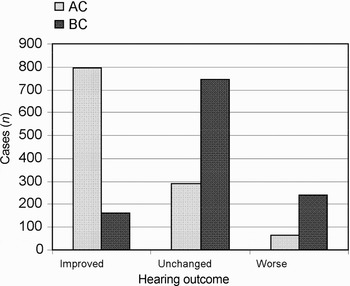
Detailed analysis of hearing results at 4 kHz is shown in Figure 4. Air conduction thresholds improved in 793 (68 per cent) patients, remained unchanged in 288 (26 per cent) and worsened in 64 (6 per cent). Bone conduction thresholds improved in 160 (14 per cent) patients, remained unchanged in 744 (65 per cent) and worsened in 241 (21 per cent).
Hearing results at 4 kHz. Improved = >10 dB; unchanged = ≤10 dB; worse = >10 dB; AC = air conduction; BC = bone conduction

Air–bone gap at 0.5–2, 0.5–3 and 0.5–4 kHz
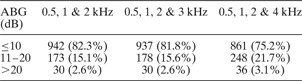
Inclusion of higher frequencies in the calculation of post-operative ABG did not influence ABG closure within 20 dB (Table II). Air–bone gap closure within 20 dB was achieved in about 97 per cent of cases, for any frequency combination. When 4 kHz was included in the ABG calculation, the success rate of closure to less than 10 dB fell from 82 to 75 per cent. Calculation of ABG at 0.5–2 kHz resulted in only a marginal increase in closure to less than 10 dB, rising to 83 per cent.
Post-operative air–bone gap for the three common frequency combinations

Data represent number of patients. ABG = air–bone gap
Hearing results assessment with Amsterdam hearing evaluation plots
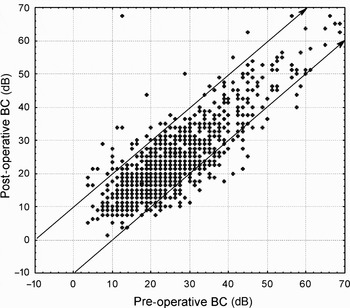
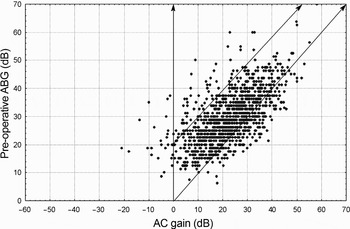
Plotting the pre- versus post-operative bone conduction thresholds, calculated according to the American Academy of Otolaryngology, Head and Neck Surgery guidelines as a four-frequency average at 0.5, 1, 2 and 3 kHz, enabled visualisation of each individual case at a glance (Figures 5 and 6). In Figure 5, every point below the lower diagonal line represents one of the 57 (5 per cent) patients who demonstrated a post-operative bone conduction threshold improvement of 10 dB or greater. Every point above the upper diagonal line represents one of the 35 (3 per cent) patients who demonstrated a post-operative bone conduction thresholds worsening of 10 dB or greater. In Figure 6, pre-operative ABG values are plotted against post-operative air conduction gain. Points below the lower diagonal line represent the 132 successful results with overclosure. Points above the upper diagonal line represent the 56 cases with unsuccessful outcomes caused by negative changes in air conduction thresholds or ABG ≥ 20 dB.
Amsterdam hearing evaluation plot. Preoperative BC plotted against postoperative BC. BC = bone conduction

Amsterdam hearing evaluation plot. Postoperative gain in AC plotted against the preoperative ABG. AC = air conduction; ABG = air–bone gap

Discussion
In the current era of evidence-based medicine, standardisation in reporting the outcomes of surgical intervention has become especially relevant. Adequate comparison of post-operative results requires uniform criteria of success.Reference Jackler13 Since the first reports of stapes surgery results, both the surgical technique and the audiometric criteria of success have undergone significant modification.Reference Monsell14, Reference Jahnke and Jahnke15
In an attempt to avoid erroneous conclusions based on comparisons of different audiological parameters, two levels of guidelines were recommended by the American Academy of Otolaryngology, Head and Neck Surgery committee on hearing and equilibrium in 1995: summary statistics and raw data.4 The recommendation to report summary statistics in terms of mean, SD and range was based on the assumption that these parameters are normally distributed. Audiometric data, however, are often not normally distributed.Reference Govartes, Somers and Offeciers12 Reporting the raw data along with the summary statistics, therefore, aims to avoid errors in the interpretation of the effects of intervention and to allow more detailed presentation of individual cases.Reference De Bruijn, Tange and Dreschler7 The parameters considered as summary statistics include the post-operative ABG and the number of decibels of ABG closure (both considered measures of technical success), as well as the post-operative air conduction thresholds (which correlate better with clinical success). In order to standardise reporting of the post-operative ABG, the use of post-operative rather than pre-operative bone conduction thresholds has been recommended. In the past, the ABG was calculated by subtraction of pre-operative bone conduction thresholds from post-operative air conduction thresholds. This practice resulted in an underestimation of the post-operative ABG because of the phenomenon of overclosure.Reference Sakai16, Reference Rosowski and Merchant17 Another weakness of this method is the inability to recognise post-operative changes in bone conduction; therefore, worsening in bone conduction thresholds caused by surgical trauma was underreported.Reference Moscillo, Imperiali, Carra, Catapano and Motta18, Reference Monsell19
Post-operative improvement in bone conduction thresholds in patients with otosclerosis was first described by Carhart.Reference Carhart20 The cause of this phenomenon was hypothesised to be a reduction of ossicular chain inertia as a result of stapes fixation. The range of the ‘Carhart effect’ has been estimated by different authors as 5–10 dB at 0.5 kHz, 10–20 dB at 1 kHz, 15–30 dB at 2 kHz and 5–20 dB at 4 kHz.Reference Austin21, Reference Vartianen and Karjalainen22 Blayney et al., Reference Blayney, Williams and Rice23 in their dynamic model of stapedectomy, demonstrated a maximal response to sound stimuli of between 1.7 and 2.5 kHz. StenfeltReference Stenfelt24 recently investigated middle-ear ossicular motion with air and bone conduction stimulation, and also found that the inertia of the ossicular chain contributes to the perception of bone-conducted sound mostly between 1.5 and 3.5 kHz.
Bone conduction at 4 kHz seems to be less influenced by the inertia of the ossicular chain, and represents the highest frequency reliably measured by current audiometric equipment. These findings of middle-ear acoustic transfer provide the experimental basis for the frequencies chosen when reporting the results of stapes surgery. Improvement of bone conduction thresholds at 0.5, 1 and 2 kHz may be presumed to be influenced by the Carhart effect, and unchanged bone conduction at 4 kHz can be considered as primarily reflecting the effect of restored ossicular chain mobility, while worsening of bone conduction thresholds indicates sequelae of surgical trauma to the inner ear. Smyth and Hassard,Reference Smyth and Hassard25 in their analysis of 18 years' experience in stapedectomy, found that success in ABG closure was highly frequency-dependent, being most prominent at low frequencies and disappearing at 4 kHz. In our series, bone conduction thresholds improved statistically significantly at 0.5, 1, 2 and 3 kHz, and worsened slightly (but statistically insignificantly) at 4 kHz. These results are in agreement with those of other recently published, large series.Reference De Bruijn, Tange and Dreschler26, Reference Berliner, Doyle and Goldenberg27 Other reports also found worsening of bone conduction thresholds following stapes surgery at 4 kHz.Reference Perez-Lazaro, Urquiza, Cabrera, Guerrero and Navarro28, Reference Vincent, Sperling, Oates and Jindal29 Therefore, reporting changes in bone conduction at 4 kHz allows inter-series comparison of the degree of surgical trauma sustained.
Bone conduction thresholds based on averages might bias interpretation of surgical outcomes. In our study, detailed analysis of hearing results at 4 kHz demonstrated substantial differences between improvement rates for air conduction and bone conduction (Figure 3). Similar changes in pre- and post-operative bone conduction at 4 kHz were also reported by Coker et al. Reference Coker, Duncan, Wright, Jenkins and Alford30 Although the inclusion of 4 kHz data when calculating the PTA has been demonstrated to negatively affect success rates,Reference Berliner, Doyle and Goldenberg27 our results suggest that inclusion of high frequencies in PTA calculation, and reporting peri-operative changes in both air and bone conduction at all frequencies from 0.5 to 4 kHz, enables more accurate comparison of success rates and interpretation of reported outcomes.
The choice of frequencies for the calculation of PTA and ABG has been extensively debated. Historically, only the lower frequencies of 0.5, 1 and 2 kHz were used, because: (1) the ABG found in otosclerosis is most prominent at these frequencies; (2) these frequencies were considered the most important speech frequencies; and (3) the audiometer had technical limitations in achieving bone masking.Reference Hannley31, Reference Smith, Sullivan and McAskile32 Recognition of the importance of the higher frequencies for speech comprehension resulted in the American Academy of Otolaryngology, Head and Neck Surgery committee on hearing and equilibrium recommending, in 1995, the inclusion of 3 kHz for the calculation of air conduction and bone conduction PTAs.
This committee recognised the method of direct comparison between PTAs calculated using three (0.5, 1 and 2 kHz) or four (0.5, 1, 2 and 4 kHz) frequencies and PTAs calculated using 0.5, 1, 2 and 3 kHz, based on the findings of Goldenberg and Berliner.Reference Goldenberg and Berliner33 Monsell,Reference Monsell14 referring to the same publication, also concluded that the difference between averages of the three frequencies versus averages of the four frequencies would not significantly alter the results. It is important to mention that Goldenberg and Berliner's study assessed the results of ossicular reconstructions and paediatric tympanoplasties, while audiometric data on bone conduction were available at all frequencies for only 228 patients. The difference between pre- and post-operative bone conduction thresholds in these authors' series was not statistically significant. Accordingly, the authors concluded that the definition of criteria for success had the greatest effect on the success rates of surgery, compared with the choice of frequency combinations. In a study which evaluated audiological data from 240 cases of stapes surgery, Berliner et al. Reference Berliner, Doyle and Goldenberg27 found the differences between pre- and post-operative bone conduction thresholds to be statistically significant at all frequencies, with the exception of 4 kHz. Inclusion of 4 kHz instead of 3 kHz in the ABG calculation resulted in lower rates of success (defined as an ABG closure within 10 dB). The difference between tympanoplasty and stapes surgery which involved inner-ear opening was suggested as an explanation for these contrasting findings. Similar results are demonstrated in our study in a larger group of patients: ABG closure was achieved in 937 (82 per cent) patients using a PTA calculated at 0.5–2 kHz, and in 861 (75 per cent) patients using a PTA calculated at 0.5–4 kHz. Therefore, comparisons of data sets using 0.5, 1 and 2 kHz or 0.5, 1, 2 and 3 kHz with data sets using 0.5, 1, 2 and 4 kHz appears to be more appropriate for evaluation of the results of tympanoplasty rather than stapes surgery.
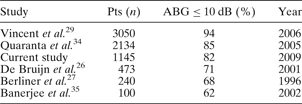
The percentage of patients who demonstrate post-operative ABG closure to within 10 dB is most commonly used for reporting the technical success of stapes surgery. A review of recent studies that included higher frequencies for ABG calculation demonstrated that ABG closure to within 10 dB was achieved in 62 to 94 per cent of patients (Table III).Reference De Bruijn, Tange and Dreschler7, Reference Vincent, Sperling, Oates and Jindal29, Reference Quaranta, Besozzi, Fallacara and Quaranta34, Reference Banerjee, Hawthorne, Flood and Martin35
Results for ABG closure to within 10 dB in recent, comparable studies

ABG = air–bone gap; pts = patients
It appears that the number of cases in any series affects the success rate. Several studies have demonstrated the existence of a learning curve for stapes surgery.Reference Backous, Coker and Jenkins36–Reference Mathews, Rasgon and Byl38 Independent reports by HughesReference Hughes39 and Yung et al. Reference Yung, Oates and Vowler40 found that 50 to 80 cases were required in order to achieve an ABG of 10 dB or better in 90 per cent of patients, and that rates of inner-ear damage appeared proportionally higher in their first 50 cases. A higher success rate reported in a larger series supports these findings. Therefore, ensuring that study numbers are appropriately large contributes to adequate interpretation of surgical outcomes, providing that the results were calculated for sequential data with no exclusion of unfavourable cases.
When summary statistics are presented in terms of means, the individual cases with poor outcomes have less influence on overall results.Reference Conrad41 Presentation of audiometric results using Amsterdam hearing evaluation plots enables the display of each individual stapedotomy outcome in a large series, with visual identification of successful and unsuccessful results. Schematically, every point below the upper diagonal line represents a successful outcome, and every point above this line represents an unfavourable result. As shown in Figure 6, the majority of the points are below the upper diagonal line representing 1052 (97.4 per cent) patients with a post-operative ABG within 20 dB. An improvement in post-operative bone conduction of more than 10 dB occurred in 57 of these cases (5 per cent) and is shown below the lower diagonal line. These results are similar to those reported by Vincent et al.,Reference Coker, Duncan, Wright, Jenkins and Alford30 who found overclosure in 98 out of 1672 (4 per cent) patients. The poor hearing outcomes indicated by either a post-operative bone conduction worsened by more than 10 dB (seen in 35 (3 per cent) patients), (figure 5) or a post-operative ABG of 20 dB or more (figure 6) (seen in 30 (2.6 per cent) patients), or both, are represented by points above the upper diagonal line. Different indicators of unfavourable outcomes, such as deterioration of bone conduction thresholds, negative changes in air conduction thresholds or an ABG of 20 dB or more, can be recognised by the specific area on the plot, enabling more detailed communication of hearing results.
• This study reports the largest series of primary stapedotomies evaluated with Amsterdam hearing evaluation plots
• The study demonstrates successful hearing results with a low rate of complications. These results are comparable to those of studies using the same audiometric criteria
• When reporting pre- and post-operative air and bone conduction thresholds, the inclusion of higher frequencies is important to enable adequate evaluation of hearing results and surgical trauma
The technical limitation of Amsterdam hearing evaluation plots appears to be the resolution of the figure while presenting large series. In the Amsterdam hearing evaluation plots presented in De Bruijn and colleagues' study,Reference De Bruijn, Tange and Dreschler7 audiometric data from 451 stapedotomies can be clearly visualised. In our series of 1145 cases, overlapping of points inevitably occurred due to the large number of cases involved.
Conclusion
This study reports the largest series of primary stapedotomies evaluated with Amsterdam hearing evaluation plots to date. It demonstrates successful hearing results with a low rate of complications. These results are comparable to those of other reports which applied the same audiometric criteria. When reporting pre- and post-operative thresholds, the inclusion of higher frequencies for air and bone conduction measurement is important in order to enable adequate evaluation of hearing results and surgical trauma. The use of Amsterdam hearing evaluation plots to display otological data allows visual presentation of unfavourable outcomes and therefore enhanced recognition of such data, compared with presentation as summary statistics alone. Amsterdam hearing evaluation plots represent a valuable adjunct to standard methods of evaluation of hearing outcomes following middle-ear surgery.