

Introduction
Total laryngectomy is generally performed for patients with either advanced laryngeal cancer or recurrent cancer following radiation therapy. After total laryngectomy, patients lose normal vocal function and must live with a permanent tracheostoma, which limits quality of life. Supracricoid laryngectomy with cricohyoidoepiglottopexy is a type of laryngeal preservation surgery indicated for patients with tumour stage two or selected advanced laryngeal cancers. Post-operatively, patients are able to resume breathing through the natural airway, without the need for a tracheostoma.
After supracricoid laryngectomy with cricohyoidoepiglottopexy, patients' voice quality is reported to be rough, but most patients are able to resume work or enjoy social activities as before.Reference Bron, Pasche, Brossard, Monnier and Schweizer1 Previous authors have evaluated patients' voices following supracricoid laryngectomy, using acoustic and perceptual measurements.Reference Crevier-Buchman, Laccourreye, Weinstein, Garcia, Jouffre and Brasnu2–Reference Vincentiis, Minni, Gallo and Nardo4 In patients treated with supracricoid laryngectomy with cricohyoidoepiglottopexy, the sound source has been assumed to derive from the interaction between the remaining arytenoids and the epiglottis, based on laryngostroboscopic observation.Reference Weinstein, Laccourreye, Ruiz, Dooley, Chalian and Mirza5 However, due to the relatively variable and unstable vibration patterns of the neoglottis formed by supracricoid laryngectomy with cricohyoidoepiglottopexy, laryngostroboscopic analysis of vibration patterns is considered to have limitations.Reference Makeieff, Giovanni and Guerrier6
High-speed digital imaging is a reliable method of observing glottal kinetics regardless of vibration pattern variability. We employed this system to examine two patients who had undergone supracricoid laryngectomy with cricohyoidoepiglottopexy, in order to analyse their vocal features and to investigate the nature of the neoglottal sound source.
We also used additional assessment methods, including laryngotopography and multiline kymography. Laryngotopography is a method of analysing the precise nature of glottal vibration recorded by high-speed digital imaging during phonation.Reference Kiritani, Hirose and Imagawa7–Reference Imagawa, Sakakibara, Kimura and Tayama9 Multiline kymography is a method of concatenating digital images to a digital kymogram by applying multiple scan lines perpendicularly over the principal axis of the vibrating portion at the neoglottis.Reference Svec and Schutte10
Patients
Case one
A 70-year-old man was referred to us with tumour–node–metastasis (TNM) stage T3 N0 M0 glottal cancer.
The patient underwent supracricoid laryngectomy with cricohyoidoepiglottopexy in November 2003. The main tumour was removed together with the thyroid cartilage. The anterior two-thirds of the left arytenoid was resected, but the entire right arytenoid was preserved. The right arytenoid and the remaining portion of the left arytenoid, including the corniculate cartilage, were retracted forward to form the neoglottis. The supracricoid laryngectomy with cricohyoidoepiglottopexy procedure was performed according to the standard technique, using a three-suture pexis.
The patient acquired communicative voice and satisfactory swallowing function within one month of surgery.
Case two
A 66-year-old woman with recurrent T2 N0 M0 glottal cancer was referred to us for supracricoid laryngectomy with cricohyoidoepiglottopexy. Four years before referral, she had received 66 Gy of radiation for her initial T1b N0 M0 lesion.
Supracricoid laryngectomy with cricohyoidoepiglottopexy was performed in June 2005. The main tumour was removed together with the thyroid cartilage. The anterior half of the left arytenoid was resected, but the entire right arytenoid was preserved. Both arytenoids were retracted forward and a neoglottis constructed according to the standard technique, using a three-suture pexis.
The patient acquired communicative voice and satisfactory swallowing function within two months of surgery.
Methods
Evaluation of vocal function
Following supracricoid laryngectomy with cricohyoidoepiglottopexy, acoustic and aerodynamic analyses and perceptual vocal assessment were performed at 48 and 32 months post-operatively in cases one and two, respectively. Maximum phonation time was also assessed. Perceptual vocal assessment was undertaken by one of the authors (an experienced speech pathologist) using the grade–roughness–breathiness–asthenia–strain scale proposed by the Japan Society of Logopedics and Phoniatrics.Reference Hirano11
Laryngostroboscopy
Laryngostroboscopic examination was performed at 48 and 32 months post-operatively in cases one and two, respectively, using an LS-3A laryngostroboscope (Nagashima Medical Instruments, Tokyo, Japan).
High-speed digital imaging of the neoglottis
Neoglottal images were obtained using a 70° rigid endoscope (Wolf, Knittlingen, Germany) coupled to a high-speed camera and recording system. A prototype camera was used for case one (Fastcam-ultima UV; Photron, Tokyo, Japan) and a new type of camera for case two (Fastcam-1024PCI; Photron). The patients were instructed to produce the vowel /e/ at a comfortable pitch. Recording was performed at 4500 frames per second; resolution was 256 × 256 pixels (Fastcam-ultima) or 400 × 512 pixels (Fastcam-1024PCI). Recording was performed at 48 and 32 months post-operatively for cases one and two, respectively.
Offline analyses
The obtained images were analysed in association with simultaneously recorded acoustic signals, using laryngotopography and multiline kymography. A waveform of the estimated laryngeal flow was then compared with the multiline kymogram images.Reference Svec and Schutte10
Results
Evaluation of vocal function
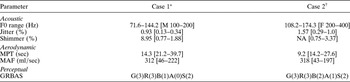
Voice evaluation data from cases one and two are shown in Table I.
Results of vocal function evaluation

Square parentheses indicate normal ranges.12 *Male (M), 48 months post-operative; †female (F), 32 months post-operative. F0 = fundamental frequency; NA = not available; MPT = maximum phonation time; MAF = mean air flow rate; GRBAS = grade–roughness–breathiness–asthenia–strain scale
Laryngostroboscopy
In case one, irregular mucosal vibration at the interface between the two remaining arytenoids and the epiglottis was observed, but there were no quasiperiodic vibration patterns.
In case two, among irregular mucosal vibrations, a pattern of quasiperiodic vibration was detected at the anterior surface of the right arytenoid region, where it abutted the epiglottis.
Laryngotopography
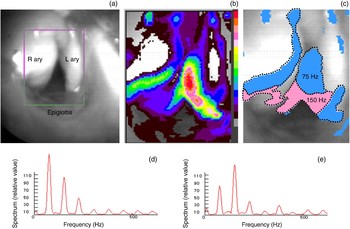
In case one, mucosal vibrations were located by high-speed digital imaging at the interface between the adducted right arytenoid and the remaining left arytenoid, during phonation. Figure 1 shows output images obtained by laryngotopography for case one: a magnified view of a selected high-speed digital imaging frame of the neoglottis; topographs of Fourier-transformed amplitude and frequency; and amplitude spectra of the light intensity at selected pixels in the vibrating areas (blue areas represent the fundamental frequency (75 Hz), while pink areas represent the secondary frequency (150 Hz)). In Figure 1c, the blue areas surrounded by a dotted line appear to correspond to the fundamental frequency (75 Hz), while the pink areas surrounded by a dotted line appear to correspond to the secondary frequency (150 Hz). The interaction between these two areas was considered to be the probable sound source in patient one.
Laryngotopography output images for case one: (a) high-speed digital image of neoglottis (b) topograph of amplitude, (c) topograph of frequency, and (d) and (e), amplitude spectra of the light intensity at selected pixels in the blue and pink areas, respectively. R = right; L = left; ary = arytenoid

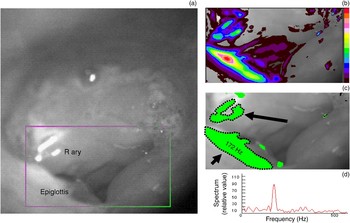
In case two, high-speed digital imaging located mucosal vibrations at the interface between the right arytenoid and the right edge of the epiglottis (Figure 2). Figure 2 shows laryngotopographic output images for case two: a magnified view of a selected high-speed digital image frame of the neoglottis; topographs of Fourier-transformed amplitude and frequency; and the amplitude spectrum of the light intensity at a selected pixel in the vibrating area. In Figure 2c, green areas surrounded by dotted lines represent the fundamental frequency (172 Hz). There was no vibrating area corresponding to a secondary frequency. The interaction between the right arytenoid and the right epiglottal edge was considered to be the probable sound source in patient two.
Laryngotopography output images for case two: (a) high-speed digital image of neoglottis, (b) topograph of amplitude, (c) topograph of frequency, and (d) amplitude spectrum of the light intensity at a selected pixel in the green area. Long arrow = mucosal vibration site at right arytenoid; short arrow = vibration site at right edge of epiglottis; R ary = right arytenoid

Multiline kymography and estimated neoglottal volume flow
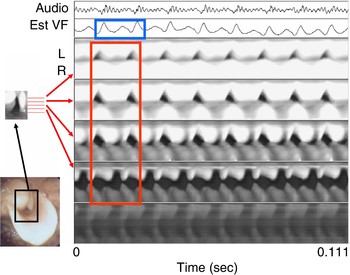
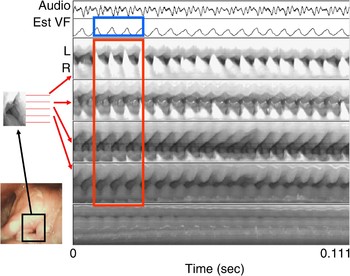
In case one, the waveform of the estimated laryngeal flow, obtained by inverse filtering analysis, appeared to contain two vibratory frequencies: 75 Hz (the fundamental frequency) and 148 Hz (the maximum peak frequency) (see Figure 3). This result corresponded well with the vibratory frequencies identified by laryngotopography. In the kymogram, the vibratory pattern of the neoglottal edges in four of the five scan lines applied perpendicularly over the principal axis of the vibrating neoglottis appeared to correspond well to the wave form of estimated volume flow at the neoglottis (Figure 3).
Case one: comparison of the wave form of the estimated volume flow (est VF) at the neoglottis, and the acoustic signals detected on multiline kymography. The kymogram traces obtained for four of the five scan lines applied perpendicularly over the principal axis of the vibrating neoglottis (red rectangle) were well matched to the wave form of the estimated volume flow (blue rectangle). L = left; R = right

In case two, the wave form of the estimated laryngeal flow showed only a single fundamental frequency (176 Hz), as seen in Figure 4, which compares the wave form of estimated volume flow at the neoglottis to the multiline kymography recording. The result corresponded well with the vibratory frequencies identified by laryngotopography. As in case one, the vibratory pattern of the neoglottal edges on four of the five kymography scan lines appeared to correspond well to the wave form of estimated volume flow at the neoglottis (Figure 4).
Case two: comparison of the wave form of the estimated volume flow (est VF) at the neoglottis, and the acoustic signals detected on multiline kymography. The kymogram traces obtained for four of the five scan lines applied perpendicularly over the principal axis of the vibrating neoglottis (red rectangle) were well matched to the wave form of the estimated volume flow (blue rectangle). L = left; R = right

Discussion
Following initial surgical training in France, our unit performed its first supracricoid laryngectomy with cricohyoidoepiglottopexy procedure in 1997. At 10-year review, the functional and oncological results of supracricoid laryngectomy showed certain advantages compared with total laryngectomy.Reference Nakayama, Okamoto, Miyamoto, Yokobori, Takeda and Masaki13 In order to further improve clinical outcomes, it has become crucial to elucidate the physiological factors that sustain function following supracricoid laryngectomy with cricohyoidoepiglottopexy.
On vocal function evaluation of cases one and two, both patients were judged to have rough and slightly to moderately breathy voices, using the grade–roughness–breathiness–asthenia–strain scale. These findings were supported by both acoustic and aerodynamic measurements. Incomplete closure and unstable vibratory patterns at the neoglottis have been reported to be responsible for roughness of voice.Reference Vincentiis, Minni, Gallo and Nardo4 Despite the evident alteration of voice after supracricoid laryngectomy with cricohyoidoepiglottopexy, patients are generally satisfied with their vocal communication, as observed in our two cases.Reference Luna-Ortiz, Nunez-Valencia, Tamez-Velarde and Granados-Garcia14
Following supracricoid laryngectomy with cricohyoidoepiglottopexy, the glottal sound source has been reported to be the interface between the arytenoid mucosa and the epiglottis, based on laryngostroboscopic evaluation.Reference Weinstein, Laccourreye, Ruiz, Dooley, Chalian and Mirza5 In our first case, quasiperiodic vibrations could not be identified, while in our second case quasiperiodic vibrations were observed at the anterior surface of the right arytenoid where it abutted the epiglottis. One study reported that, due to the relatively irregular vibration pattern of the neoglottis following supracricoid laryngectomy with cricohyoidoepiglottopexy, quasiperiodic mucosal vibrations could only be detected in 52 per cent of patients.Reference Makeieff, Giovanni and Guerrier6 It remains unclear why quasiperiodic vibrations were not recorded in our first case. The neoglottal vibratory pattern in case one may perhaps have been more unstable compared with that in case two.
High-speed digital imaging is a reliable modality for the observation of glottal kinetics, regardless of variability in vibration patterns. It has been reported to be superior to laryngostroboscopy for assessing irregular mucosal vibration, particularly in cases showing moderate-to-severe aperiodicity.Reference Kendall15, Reference Patel, Dailey and Bless16 The application of Fourier analysis to high-speed digital images enables various offline quantitative evaluations.Reference Kiritani, Hirose and Imagawa7, Reference Imagawa, Sakakibara, Kimura and Tayama9, Reference Granqvist and Lindestad17
In our first case, mucosal vibrations at the interface between the adducted right arytenoid and the remaining left arytenoid were detected only by laryngotopography. In this case, the fundamental frequency and secondary frequency were consistent with the fundamental frequency range (71.6–144.2 Hz) detected on acoustic measurement. Despite the existence of two different vibration frequencies, the first patient's speaking voice did not sound diplophonic. Correlation between the fundamental and secondary frequencies to produce an exact overtone would probably result in the absence of vocal diplophonia.
• Supracricoid laryngectomy with cricohyoidoepiglottopexy is a type of laryngeal preservation surgery indicated for patients with tumour stage two and selected advanced laryngeal cancers
• This study analysed neoglottal kinetics in two patients following supracricoid laryngectomy with cricohyoidoepiglottopexy; laryngotopography, inverse filtering analysis and multiline kymography were also used
• The waveform of the estimated volume flow at the neoglottis (obtained by inverse filtering analysis) corresponded well to the neoglottal vibration patterns derived by multiline kymography
In our second case, mucosal vibrations at the right edge of the epiglottis were detected only by laryngotopography. The interaction at the very edges of the anterior surface of the right arytenoid and the right edge of the epiglottis, which matched the fundamental frequency (172 Hz), was considered the sound source in this case. This patient's fundamental frequency, obtained by laryngotopography, matched well with the fundamental frequency range (108.2–174.3 Hz) obtained by acoustic measurement.
In both cases, the waveform of the estimated volume flow at the neoglottis corresponded well to the vibratory frequencies identified on laryngotopography, and to the multiline kymography results. These results confirmed that, in both cases, the specific neoglottal sites identified were the sound source.
Conclusion
This study used high-speed digital imaging to investigate the nature of neoglottal kinetics in two patients who had undergone supracricoid laryngectomy with cricohyoidoepiglottopexy. High-speed digital imaging was effective in locating the specific neoglottal sites considered responsible for voice production.
This is the first study to use high-speed digital imaging to identify the neoglottal sound source in patients undergoing supracricoid laryngectomy with cricohyoidoepiglottopexy.
Acknowledgement
This study was supported by a Grant-in-Aid for Scientific Research (C) from the Ministry of Education, Culture, Sports, Science, and Technology of Japan (grant number 20592028: 2008-2011).