In China, public policy has stressed equality between ethnic groups. China's 55 officially recognized national minorities (minzu 民族) are unevenly distributed across the country. Integral to China's ethnic policies is the system of regional autonomy which consists of intersecting territories. Tibet, Xinjiang, Guangxi, Ningxia and Inner Mongolia make up the five largest autonomous regions (zizhi qu 自治区) in this system. Ethnic regional autonomy has several dimensions. For example, the cultural element allows the official use of the minority language, the social dimension includes promoting ethnic minorities to become cadres and participate in policymaking and policy implementation, and the economic dimension involves the provision of special funding to the autonomous areas.
Each autonomous region is home to both minority persons as well as members of the Han 汉 majority, although the proportions vary across regions. In Tibet and Xinjiang, minorities constitute the majority of the population, while they are in the minority in the other three regions. Clearly, it should be of great interest to know if, and to what extent, there are ethnic income and poverty disparities within the autonomous regions. Are the minorities masters in their home regions, or are they at a disadvantage compared to the Han majority also living there? The existence of an income gap can foster social tensions. However, there seems to be no study investigating the question, which provides one motivation for this paper.
This article focuses on the rural part of Ningxia Hui Autonomous Region 宁夏回族自治区 and compares the Hui 回 minority with the Han majority, with an emphasis on household income and poverty. Ningxia Hui Autonomous Region, located in north-west China, has a population of slightly more than six million, approximately one-third of whom are Hui and two-thirds belong to the Han majority. Although the Hui and the Han share a common language and physical traits, they differ as the Hui are Muslims and have their own identity historically. Differences between the Hui and Han are visible in religious practices, diet, dress, and often names. As we will show using a unique sample survey for circumstances in 2006, the two populations are rather separated from each other when it comes to marriage and, to a somewhat lesser extent, in friendship.
Muslim minorities of considerable size are found in other countries as well. For example, owing to recent migration, rich countries in northern Europe are now home to large populations of Muslims. Worryingly, results from recent research indicates that such Muslim minorities are economically disadvantaged compared to the majority population of the country where they live. This has been shown to be the case in BritainFootnote 1 as well as in Germany.Footnote 2 In India, too, the Muslim minority is at an economic disadvantage in many aspects compared to the Hindu majority.Footnote 3 Therefore, the results from this study comparing the Hui and Han in rural Ningxia should not only be of importance for those interested in Chinese circumstances. We are actually addressing the following question: to what extent are there gaps in income and poverty in a location where Muslims have lived for many generations? This is the second motivation for our study.
This study shows that the Hui are disadvantaged both in terms of length of education and household wealth within the region in which they are supposed to have a special position. However, a central result is that there is no divide between Hui and Han in rural Ningxia regarding average household income and poverty when the latter is estimated using poverty lines applied by the National Bureau of Statistics (NBS) for the same year. This paradox can be explained by the Hui earning more income off the farm. In particular, young Hui males from poor villages have a remarkably high likelihood of migrating, and therefore are likely to bring back extra income to their households. We are not aware of any previous study on an ethnic minority in China in which such a mechanism has been shown.
The rest of this article is laid out as follows. The following section surveys the literature on ethnic disparities in household income and poverty in China. We then present some facts on the Ningxia Autonomous Region and the Hui ethnic group, and introduce the survey used. Some key facts on the two ethnic groups, including length of education and household wealth, are then presented. The article goes on to compare household income and poverty for the two ethnic groups and also investigates the factors that determine household income and rural migration in order to understand better the lack of difference in mean household income and the extent of poverty across the two ethnic groups. Finally, we sum up the findings in the concluding section.
Ethnic Income Disparities in Rural China According to Previous Research
As the result of a historical process, the People's Republic of China (PRC) now officially defines ethnic minority people as those who belong to one of 55 recognized ethnic minority groups and not the Han majority. A person's ethnic status is registered on the identity card carried by all citizens of the PRC. Under PRC policy, minorities enjoy certain privileges. For example, minorities are given preferential treatment regarding entry to higher education, and many minority groups are exempted from the one-child policy.Footnote 4
When analysing the ethnic differences in income and poverty in China, it is important to note that its minority population is unevenly distributed spatially. More ethnic minority groups live in rural areas than the majority population, and most are concentrated in the less-developed western part of the country. Even within province-level units, ethnic minorities can be concentrated in regions that are less developed.Footnote 5 Furthermore, at the village level the population is often segmented, meaning that people belonging to one ethnicity dominate in number.Footnote 6
A household's income and poverty is influenced both by the possession of household wealth and by the household members' level of education. While very little has been written on ethnic gaps in household wealth in China, more has been written on ethnic differences in educational attainment. Evidence surveyed by Hannum et al.Footnote 7 and Hannum and WangFootnote 8 indicate that although minority persons belonging to later birth cohorts are much better educated than older cohorts, most minority groups are at a disadvantage compared to majority persons belonging to the same birth cohort. Such disadvantages can be traced to different, possibly interrelated, circumstances. For example, ethnic minorities more frequently live in low-income locations where school quality is often lower. Minority children primarily using their own language face difficulties as instruction in Chinese schools is predominantly in Mandarin. Family circumstances, such as the low educational attainment of parents and financial difficulties in the household, can also contribute to ethnic gaps in length of education. In addition, length of education is also a result of choices which are influenced by peers and relatives, for example, who typically belong to the same ethnicity. Thus, it follows that ethnic disparities in educational attainment can be transmitted across generations.
Some authors have investigated ethnic differences in earnings and income in urban China, and others in rural China.Footnote 9 As the topic here is rural Ningxia, the literature survey focuses on studies on rural China. Some such studies have used data from the China Household Income Project (CHIP). Gustafsson and Li analysed households living in rural regions in 19 provinces for 1988 and 1995.Footnote 10 They found that although average income per capita among minorities increased between the two years surveyed, the minority/majority income gap also increased. This was found to be the result of economic growth being spatially unbalanced during the period studied, in combination with China's ethnic minorities living primarily in other locations than the majority. In the two provinces in the south-west, Yunnan and Guizhou, few ethnic differences in average per capita household were reported. In line with these studies, Gustafsson and Ding used household panel data from 22 province-level units for 2000 to 2002, and reported rural poverty to be more widespread among ethnic minority households than among the majority households.Footnote 11 However, as majority persons are more numerous, most poor people in rural China belong to the ethnic majority.
The unit of analysis used by Gustafsson and Ding is the village, and a large survey for 2002 is used for studying household per capita income as well as household per capita wealth.Footnote 12 Persons living in minority villages in north-east China were found on average to have a somewhat better economic situation than inhabitants in the average Chinese village, but minority villages in the south-west were clearly worse off. Among many factors affecting the economic situation in the village, location was found to be the single most important circumstance negatively affecting the economic situation of a village in the north-west and particularly in the south-west.
Some authors have investigated migration by ethnic minorities and compared it with migration of the majority population.Footnote 13 As reasons and destinations for migration differ across time and space, it is not easy to generalize results from various studies. Furthermore, the differences across ethnic minorities might be as large (or perhaps even larger) as the differences between the majority and minorities taken as one category. For example, one could hypothesize that those minorities with their own language and who are visibly different from the Han, such as the Uyghur, face larger barriers to migration than the Hui, who have the same language as the majority. Footnote 14
One example of a study of ethnic minority migration in China is Iredale et al.Footnote 15 Chapter 4 of their study compares the migration rates between minorities and the majority using the 1990 census. They report that rates of movement within provinces are relatively similar but that there are lower rates of minority movement across province boundaries. Fieldwork in Inner Mongolia (Chapter 5) indicates that, generally, migration is seen as a good thing by both individuals and politicians and a positive force for aiding economic development. Also, Jijiao Zhang paints a positive picture of ethnic minority migration based on experiences in Guizhou: many skilled migrants have returned, remittances sent back by rural migrants are significant and urban influences brought back by migrants are not necessarily destructive.Footnote 16 Bhalla and Luo, who analysed a sample of minority persons who had migrated to urban areas of China and kept their rural hukou 户口, reported that in the new location the migrants earned considerably more than at their rural origins.Footnote 17
Context
According to the fifth national census taken in 2010, there are 10,586,078 Hui in China, which constitutes 0.79 per cent of the total population. Hui is the largest of China's ten officially recognized Muslim minorities and is, after Zhuang 壮族 and Manchu 满族, the third-largest ethnic minority group in the PRC. The Hui are spread all over China's 31 province-level units, but the highest concentration is found in Ningxia Hui Autonomous Region, where 35.4 per cent of the population is Hui, and 1.4 per cent is made up of other ethnic minorities (according to published reports from the 2010 Census). Above average concentrations of Hui are also found in Gansu, Xinjiang, Henan, Hebei, Shandong and Yunnan. The Hui are at least as urbanized as the Han majority.Footnote 18
The Hui are of varied ancestry. It is often claimed that it was during the Ming dynasty (1360–1644) that the Huihui 回回 (later referred to as Hui) began to emerge as an ethnic group.Footnote 19 The Hui are similar to the Han majority in language and physical appearance. However, as Muslims, they follow Islamic dietary laws and reject the consumption of pork. They also often dress differently from Han: Hui women frequently wear headscarves and men wear white caps. Some family names also signal that the person most probably belongs to the Hui minority.Footnote 20 Hui typically marry within their own ethnic group.Footnote 21
Ningxia Hui Autonomous Region was formed in 1958 and is small compared to most of China's other province-level units in terms of area as well as population. With a population of 6.25 million in 2009, only Tibet and Qinghai have smaller populations. However, Ningxia's population is not particularly small when seen from a European perspective. Ningxia has approximately the same number of inhabitants as Bulgaria or Denmark. In 2009, 54 per cent of the population in Ningxia lived in a rural area. Measured by indicators such as household income and life expectancy, Ningxia ranks below the median for China.Footnote 22 Natural conditions are in many parts of Ningxia unfavourable for agricultural activities and the government has for some decades carried out resettlement projects.Footnote 23 The area used for agricultural production has decreased owing to the implementation of national policies aimed at reducing soil erosion by converting farm land on steep slopes into forest and compensating farmers thereafter.Footnote 24 Furthermore, Ningxia is one of China's least industrialized province-level units.
Many rural households in China have sought to improve their economic situation by sending family members as migrants or commuters to places with better employment conditions. Results from our survey show that temporary migration in Ningxia is typically short, as only a minority of migrants have moved out of Ningxia. Migration often takes the form of chain migration. As opposed to many other parts of China, local government officials in rural Ningxia have taken an active role in promoting the out-migration of its inhabitants, as the officials' performance can be evaluated based on the number of out-migrants in their jurisdiction.
Data
We use data from a socio-economic survey conducted in 2007 in the Ningxia Hui Autonomous Region by the Ningxia Survey Team of the National Bureau of Statistics on behalf of the Institute of Ethnology and Anthropology, Chinese Academy of Social Sciences. The samples were selected from the larger pool of households surveyed in the region for official statistical information published each year in the statistical yearbook for Ningxia Autonomous Region. We use the rural sample.
The sampling was drawn as follows. All regularly sampled households in all five of Ningxia's divisions (Yinchuan 银川, Shizuishan 石嘴山, Wuzhong 吴忠, Guyuan 固原 and Zhongwei 中卫) were selected. The research team also designed questionnaires for the rural and urban households, respectively. Data on various household assets were collected making it possible to investigate household wealth. In this respect, this followed previous CHIP surveys where similar questions were put to households in many provinces of China.Footnote 25 For the households surveyed, we had access to information already collected by the survey team. This means, for example, that we can define and measure household income in the same way as the National Bureau of Statistics. Our questionnaire was answered by members in almost all households (99.72 per cent). The survey covered 1,190 households with 5,399 individuals in 120 villages. In the sample, 3,028 people (57 per cent) are Han, and 2,289 (43 per cent) are Hui. In addition, a survey on village circumstances was answered by village cadres.
Characteristics of Han and Hui Populations
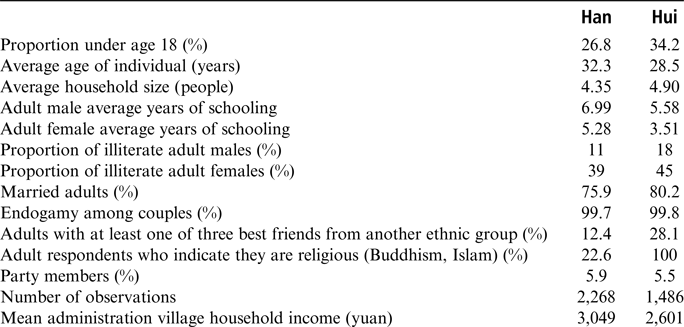
Table 1 provides some basic information on the two ethnic groups derived from our sample. The Hui population has a larger proportion of children than the Han population, and Hui households consistently have a somewhat larger number of members than Han households. This is consistent with Hui females having fewer years of education than Han females, as well as the one-child policy on the whole affecting the Han more stringently than the Hui. We report ethnic as well as gender gaps in length of education among adults. The longest average length of education (7.0 years) is not surprisingly found among Han males, with Hui males coming second (5.6 years), closely followed by Han females (5.3 years), and Hui females coming last with an average of not more than 3.5 years. Marriages across ethnic groups are very rare. Patterns of friendship are also demarcated by ethnic group. Hui more often than Han have at least one person of the other ethnicity among their three closest friends. While almost all Hui respondents indicate that they are religious, this was only the case among a minority of Han respondents who indicate that they are Buddhists. There is no ethnic difference in the proportion of adult members who are members of the Communist Party (6 per cent).
Descriptive Statistics for Han and Hui in Urban and Rural Ningxia, 2006

Source:
Authors' calculation from Socio-economic Survey of Ningxia 2006.
Notes:
There was a large non-response on the question on ethnicity among three best friends as answers were obtained by only 555 Han and 556 Hui respondents. The question of endogamy was answered by 1,715 Han and 1,176 Hui. The question on religion was answered by 2,721 Han and 2,050 Hui. A person is considered to be an adult at age 18.
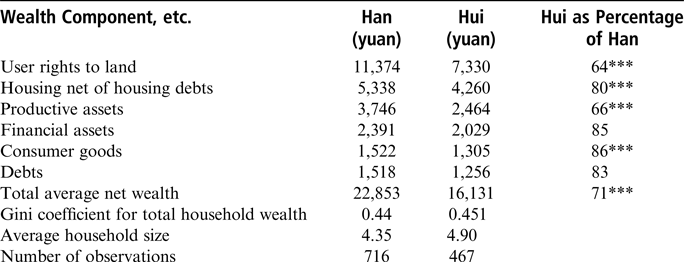
We now turn to results on household per capita wealth. We distinguish between some broad types of assets.Footnote 26 We follow McKinley when defining the user rights to land, based on land size and quality and various other assumptions.Footnote 27 Housing net of housing debts consists of the market value of private housing after, in a few cases, the subtraction of housing debts. Another component is production assets used in private business activities. Financial assets include term deposits, current account deposits, and in a few cases, stock shares and bonds, and also other financial assets. Consumer goods indicate the value of furniture, TVs, bicycles, etc. Table 2 reports wealth components, average total net household per capita wealth and the Gini coefficient for household net wealth per capita.Footnote 28 This is done for the Han as well as the Hui households. The net wealth owned by Hui households is on average less valuable than that owned by Han households, with the gap estimated to be 29 per cent. The gap is somewhat larger when it comes to user rights to land and possession of productive assets. In contrast, the ethnic gap in the value of consumer durables is not more than 15 per cent and there is actually no statistically significant difference when it comes to financial wealth. The Gini coefficients are similar for the two ethnic groups, with a value of 0.44 for Han and 0.45 for Hui.Footnote 29
Household per Capita Wealth among Han and Hui Households in Rural and Urban Ningxia: Components, Mean Value and Gini Coefficients, 2006.
Source:
Authors' estimates from Socio-economic Survey of Ningxia 2006.
Notes:
Household is the unit of analysis. *** indicates that the means for Han and Hui are statistically different at the 1% level; **indicates that the means for Han and Hui are statistically different at the 5% level; * indicates that the means for Han and Hui are statistically different at the 10% level.
We have thus found that on average the Hui are not as advantaged as the Han in Ningxia in terms of length of education and household wealth. If these were the only circumstances affecting how much income a household earns, we would expect to find the Hui to be disadvantaged compared to the Han. And yet, this is not what we report in the next section.
Income and Poverty in Rural Ningxia
It is a widely held view in Chinese society that the Hui show great skill in taking advantage of income earning opportunities.Footnote 30 As reported above, this skill may be borne out of necessity: they own fewer user rights to land and productive assets and receive less education than the Han. It is reasonable to assert that, over the course of generations, by living in other villages the Hui have acquired a somewhat different lifestyle to the Han. This is manifest in the fact that they are likely to be more involved in non-farm activities, including migration, than the Han. The Hui have a reputation for often being involved in private business or working for a wage.Footnote 31 Field visits in rural Ningxia by one of the authors have shown that remarkably often Hui migration is organized by local township cadres. For example, one township-level government had made an agreement with a work unit in the eastern part of China to recruit migrants, and local cadres, right down to the administrative village level, are tasked with promoting out-migration.
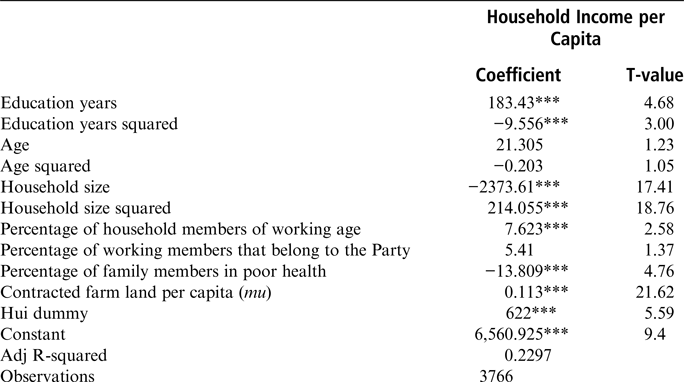
One way to investigate whether the Hui are in a better position to take advantage of income-generating opportunities is to estimate income functions that include a number of variables which are likely to affect household income. In the specification, a dummy for Hui ethnicity is also included and we expect that the coefficient will be positive. The outcome of this exercise is shown in Table 3. Explanatory variables include average number of years of education of household members of working age, average age of adult household members, and household size measured by number of people. We also include the square of each of the three variables in order to allow for possible non-linear effects. Furthermore, we include the percentage of household members that are of working age and the percentage of the working members that are members of China's Communist Party as explanatory variables. We also include the percentage of family members that are in poor health and the contracted farm land measured in mu. Estimates are shown in Table 3.
Income Functions for Rural Ningxia
Source:
Authors' estimate from Socio-economic Survey of Ningxia 2006.
Notes:
The population studied comprises adults of at least 18 years of age. *** indicates statistical significance at least the 1% level; ** indicates statistical significance at the 5% level; *indicates statistical significance at the 10% level.
The parameter of main interest in Table 3, the coefficient for Hui ethnicity in the equation for household income, is positive and estimated with high t-statistics. Thus, given a number of income-generating variables, Hui persons earn more than their Han counterparts. From the estimates in Table 3, we also learn that household per capita income is positively affected by years of education among adult members but at a decreasing rate, and negatively affected by household size at a decreasing rate. Furthermore, per capita household income is positively affected by the percentage of household members of working age and negatively affected by the percentage of household members in poor health. The amount of contracted farm land has a positive effect on household income.
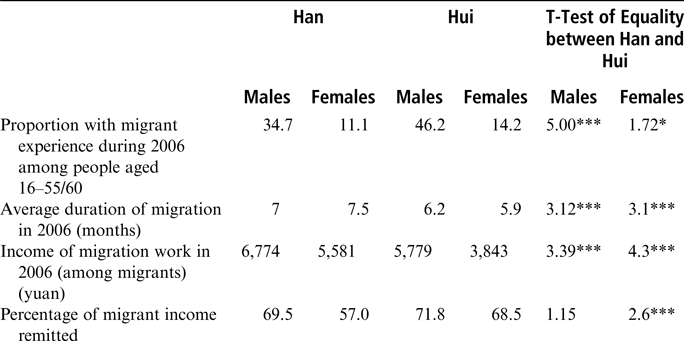
One possible reason for the positive coefficient for the Hui dummy in Table 3 is that the Hui are more involved in migration. This can be seen in Table 4, which also shows that in rural Ningxia migration is typically a male activity. As many as 46 per cent of Hui males were involved in migration in 2006, while the corresponding proportion among Han males was 35 per cent. On average, Hui migrants earn less than Han migrants and migration lasts for about half a year. Data from our survey and from the Ningxia Statistical Bureau indicate that many migrants work in construction, often people migrate over a short distance, and that out-of-province migration is typically to neighbouring provinces. Note that the information in Table 4 indicates that most migrant income is sent home.
Migration among Hui and Han in Rural Ningxia, 2006
Source:
Authors' calculation from Socio-economic Survey of Ningxia 2006.
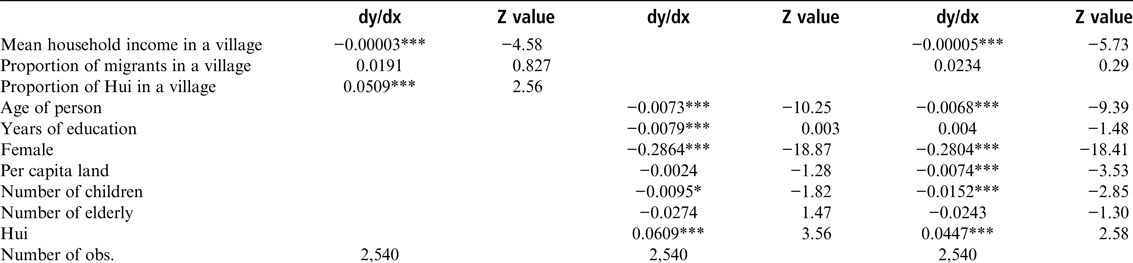
We are interested in gaining a better understanding of the extent to which migration in Ningxia is influenced by low village income and by ethnicity. We have therefore specified and estimated probit models for the subsample of adult household members who are of working age. As can be seen in Table 5, we relate the event of having migrated during 2006 to village characteristics in Specification 1, and to household and individual characteristics in Specification 2. Specification 3, on which our comments are based, includes characteristics at the village, individual and household level.Footnote 32
Determinants of Migration in Rural Ningxia, 2006, Probit Model
Source:
Authors' estimates from Socio-economic Survey of Ningxia 2006.
Notes:
The observations are individuals aged 16–55 for females and 16–60 for males. The dependent variable is whether the household member migrated (1) or not (0) in 2006.
The pattern we find is a very clear negative relation between the mean income of the village and the probability of migrating. In other words, people migrate because they live in a poor village.Footnote 33 However, as migrants bring home income, it follows that migration has an income-redistribution function across villages. Turning to individual characteristics used in the specifications, we find that age negatively affects the probability of migrating, as does being female. Two household variables are found to affect the probability of migrating: per capita land has a negative effect as does the number of children in the household. Having access to a significant amount of land and having children make people less likely to migrate. Table 5 also shows that Hui ethnicity (at the village level in Specification 1 and at the individual level in Specification 3) has an independent positive effect on the probability of migration.
In Figure 1, we use Specification 3, as reported in Table 5, to predict the probability of migration for individuals with different characteristics. For a base person (A), a man aged 23 and living in a village belonging to the lowest decile according to per capita income, the probability of migrating is predicted to be 52 per cent. The corresponding probability is 36 per cent if the village has a mean income placing it in the top decile (the second panel), that is to say, 16 per cent lower. The importance of age is evident, as changing the age of the base person to 40 (case E) reduces the probability of migration from 52 per cent to 24 per cent, a reduction of 28 per cent. This change is almost identical to the probability obtained for being aged 23 and female (B). Changing the amount of land to which the household has access (F and G) for the base individual leads to a variation in migration probability of ten percentage units. From Figure 1, we can also learn that, compared to the variations in the variables village income, age and gender, the number of children in a household (cases H, I, J and K) is of lesser importance.
Predicted Probabilities of Migrating for Individuals Living in Villages with Different Income Levels
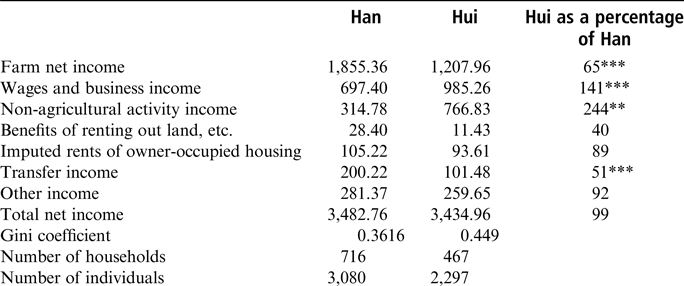
Has the higher level of migration among the Hui, partly triggered by low village income in combination with a higher frequency of off-farm work, fully compensated for the disadvantage of being less educated and owning less valuable land when it comes to earning an income? In Table 6, we compare income components per capita, average household income per capita and income inequality among the Hui and Han in rural Ningxia. Interestingly enough, we find that the average total income per capita is estimated to be identical for both Hui and Han. Although it is true that Hui agricultural income amounts to only 65 per cent of the agricultural income for Han, this is fully compensated for by higher income from wages and business, as well as non-agricultural income. Much of this is owing to migration and other non-farm activities.Footnote 34
Income Components and Total per Capita Income among Han and Hui in Rural Ningxia, 2006 (yuan).
Source:
Authors' estimates from Socio-economic Survey of Ningxia 2006.
Notes:
Individuals are the unit of analysis. *** indicates that the means for Han and Hui are statistically different at the 1% level; ** indicates that the means for Han and Hui are statistically different at the 5% level; * indicates that the means for Han and Hui are statistically different at the 10% level.
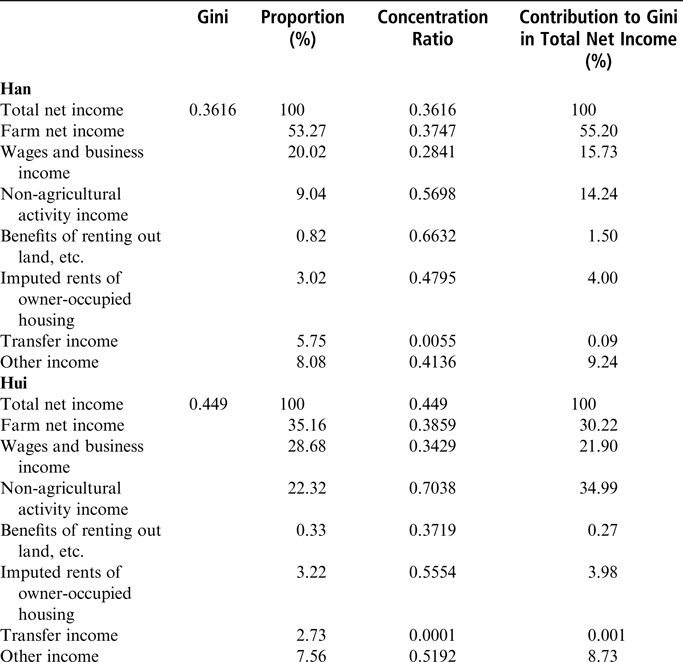
Table 6 also shows that income inequality among the Hui population measured by the Gini coefficient is greater than among the Han (0.45 to be compared with 0.36).Footnote 35 As shown in Table 7, this is consistent with non-agricultural income constituting a larger fraction of total income among the Hui than among the Han, and non-agricultural income being more concentrated to high total income. Furthermore, the concentration of non-agricultural income among those with a high income is particularly large among Hui. Table 7 shows results from decomposing the Gini coefficient by income sources for each of the two ethnicities. The Gini for total net income is a weighted sum of the concentration coefficients for each income component. The relative shares of each income component are the weights. The concentration coefficient indicates the association between the income component and total net income and can take values from –1 to +1. The higher the value of the concentration coefficient, the stronger the particular income component concentrated to high income units. Table 7 shows that 22 per cent of the total income of Hui individuals came from non-agricultural income, having a concentration coefficient as high as 0.70. The last column shows that as much as 35 per cent of the Gini value for the Hui can be attributed to non-agricultural income. The corresponding number for the Han majority is not more than 14 per cent (of a lower Gini).
Decomposing the Gini Coefficient for Household per Capita Income by Income Components for Hui and Han in Rural Ningxia
Source:
Authors' estimates from Socio-economic Survey of Ningxia 2006.
Does the higher income inequality among the Hui, in combination with the identical mean incomes, lead to the greater likelihood of a Hui being poor than a Han? The answer to this question is “no” as long as we apply the poverty lines used by the National Bureau of Statistics for the year under investigation. In Figure 2, we show the cumulative density functions for household per capita income of Hui and Han individuals for the lower range of the distributions. That is, the horizontal axis shows household per capita income and the vertical axis shows the cumulative proportion of individuals. In the figure, we have also drawn the poverty line at 693 yuan per person per year (which was the poverty line NBS applied for rural China in 2006), as well as the low income line of 958 yuan per year, which was also applied by NBS for the same year. The estimated proportion of individuals falling under the poverty line set at 693 yuan per year is 4.9 per cent for Hui and 4.5 per cent for Han. The proportion of Hui falling under the low income line is estimated to be 12.1 per cent and 10.3 per cent among Han. However, note that at higher income levels, the graph for Hui is higher than the graph for Han. This means that for higher poverty lines, Hui would be deemed to be more poverty prone than Han.Footnote 36
Cumulative Density Functions for Han and Hui in Rural Ningxia, 2006.
Conclusion
In this study, we have investigated the income and poverty of Hui and Han individuals living in rural Ningxia Hui Autonomous Region using data collected from a 2006 household survey. The Hui ethnic group is the most numerous Muslim minority in China and constitutes roughly one-third of the population of Ningxia. The data show that marriage between people from the two different ethnic groups is rather uncommon. Rural Hui people live to a large extent in different (poorer) villages to Han people and both ethnicities socialize mainly with people from the same ethnic background. Hui live in households that on average have a larger number of members than Han households. In this sense, we are talking about two different populations.
We have reported that in rural Ningxia, Hui adults on average have fewer years of education than Han of the same gender and that women have a shorter education than men. We have also reported an ethnic gap in average per capita household wealth, with Hui households having 29 per cent less than Han households. The gap is even larger regarding user rights to land and productive assets. Based on the lower educational attainment and ownership of lesser-valued assets, one would expect that the Hui in rural Ningxia would be disadvantaged compared to the Han in terms of mean disposable per capita income and rates of poverty. However, this is not what we have reported. Average household per capita income is the same and there is no discernible ethnic gap in poverty if assessment is based on the poverty line applied by the National Bureau of Statistics for rural China in 2006.
The explanation for this paradox is that the rural Hui are involved in non-farm work, including migration, to a greater extent than the rural Han. According to our data, as many as almost one in two Hui males in Ningxia migrated in 2006 and they brought home substantial amounts of income. Results from estimated models indicate that a low village income is one (but not the only) factor behind the higher probability that rural Hui will migrate. This analysis has also illustrated that the probability of migration is particularly high for young Hui males living in a low-income village in households with little land and no dependent children. We have shown that Hui households earn more non-agricultural income than Han and that such incomes are disproportionately concentrated among the better-off Hui. The latter is an important reason why the distribution of income among Hui is found to be rather unequal, and more unequal than among the Han.
To round off, the main result of this paper has been to find a non-existent ethnic income gap and poverty gap in rural areas of Ningxia. It will be an important task for future research to investigate whether different or similar results can be found for urban Ningxia, as well as for Tibet, Xinjiang, Guangxi, and Inner Mongolia – the four other autonomous regions of China with large minority groups. Finally, for readers familiar with the present situation in northern Europe where Muslim populations tend to have considerably lower incomes and to be more poverty prone than the majority, our results can provide further food for thought. We have namely found that in a region where a Muslim minority has lived for generations, there is no sign of an income or poverty gap.