


1. INTRODUCTION
The distribution function of an electron bunch, transverse, or longitudinal, is often assumed to be Gaussian. Actually, however, due to stochastic processes, there always exists some deviation and hence charge distributions of accelerator beams can be separated into two parts: the beam cores, which usually have Gaussian-like distributions, and the beam halos, which have much broader distributions than the beam cores. The central part affects the luminosity of colliders, circular or linear, and the brightness of synchrotron light sources, while the halos can give rise to background in collision experiment detectors and even reduce the lifetime if its distribution is too large.
Both calculations and measurements for beam halo are a hard topic. For the root mean square (RMS) emittance growth, we do have some mature theories and numerical codes to use, while for the whole beam distribution, especially for the halo part, there are few mature theories. Even using simulations, it's still difficult to get the halo distribution with three dimensions because the beam halo includes much fewer particles than the beam core. For the first time, we have developed a series of theory to estimate the whole beam distribution, including the distribution of the halo section based on the theory established by Hirata and Yokoya (Reference Hirata and Yokoya1992); Wang et al. (Reference Wang, Bambade, Yokoya and Gao2014). We have focused on three main mechanisms: beam-gas scattering, beam-gas bremsstrahlung and intrabeam scattering (IBS). Beam-gas scattering produces transverse halo, beam-gas bremsstrahlung produces longitudinal halo, and IBS can induce both transverse and longitudinal halo.
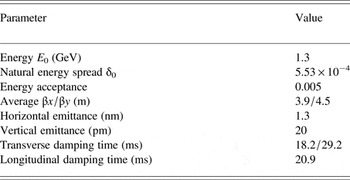
At the interaction point (IP) of ATF2 (Accelerator Test Facility 2 in KEK), an elaborately designed beam size monitor based on laser interferometer technology, called the Shintake monitor, is utilized to measure the sub-100 nm electron beam size (Suehara et al., Reference Suehara, Oroku, Yamanaka, Yoda, Nakamura, Kamiya, Honda, Kume, Tauchi, Sanuki and Komamiya2008). However, the photon background in the IP section will influence the modulation of the Shintake monitor, and hence degrade the resolution of beam size measurements. So, the beam halo distribution is important for the measurement of the beam size at IP. Since the understanding of charge distribution for the beam halo and how the beam halo is created are essential to our estimation of background. We have made some analytical estimation of halo distribution in ATF due to three common stochastic processes using our own theories (typical ATF damping ring parameters are listed in Table 1). Also, we have compared the theoretical estimation with the newest measurements by an advanced halo monitor. The analytical results agree the measurements very well.
Typical ATF parameters (Bane et al., Reference Bane, Hayano, Kubo, Naito, Okugi and Urakawa2002)
2. THEORY REVIEW
2.1. Beam-gas scattering
The performance of accelerators and storage rings depends on the many components of the accelerator, and one very important component is the vacuum system. Interactions between the accelerated particles and the residual gas atoms and molecules may degrade the beam quality. The lifetime may be reduced and/or the emittance may increase. The beam halo is possibly generated and hence the particles’ distribution deviates from a Gaussian distribution.
The deflection of an electron via the Coulomb interaction is described by Rutherford scattering. We assume that this scattering is elastic and that the recoil momentum of the residual gas is negligible. The differential cross-section of the electron scattering with an atom is given by (Heilter, Reference Heilter1995)
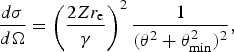 $$\displaystyle{{d { {\rm \sigma}}} \over {d{\rm \Omega}}} = \left( {\displaystyle{{2Zr_{\rm e}} \over { {\rm \gamma}}}} \right)^2 \displaystyle{1 \over {( { {\rm \theta}} ^2 + { {\rm \theta}} _{\min} ^2 )^2}}, $$
where Z is the atomic number, r e is the classical electron radius, γ is the relativistic Lorentz factor, θ is the scattering angle for certain electron, and θmin is the minimum scattering angle, which is determined by the uncertainty principle as
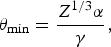 $$ { {\rm \theta}} _{\min} = \displaystyle{{Z^{1/3} { {\rm \alpha}}} \over { {\rm \gamma}}}, $$
where α is the fine structure constant. If we integrate over the whole space angle Ω, we obtain the total cross-section
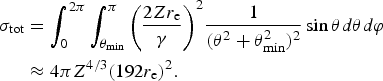 $$\eqalign{ { {\rm \sigma}} _{{\rm tot}} &= \int_0^{2 { {\rm \pi}}} {\int_{ { {\rm \theta}} _{\min}} ^ { {\rm \pi}} {\left( {\displaystyle{{2Zr_{\rm e}} \over { {\rm \gamma}}}} \right)^2}} \displaystyle{1 \over {( { {\rm \theta}} ^2 + { {\rm \theta}} _{\min} ^2 )^2}} \sin { {\rm \theta}} d { {\rm \theta}} d { {\rm \varphi}} \cr &\approx 4 { {\rm \pi}} Z^{4/3} (192r_{\rm e} )^2.} $$
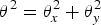
We then need to get the probability density function f(θ). Assuming
 $ { {\rm \theta}} ^2 = { {\rm \theta}} _x^2 + { {\rm \theta}} _y^2 $
, then integrating over one direction will give the differential cross-section for the other direction
 $$\displaystyle{{d { {\rm \sigma}}} \over {d { {\rm \theta}}}} = \displaystyle{{4 { {\rm \pi}} r_{\rm e}^2 Z^2} \over { { {\rm \gamma}} ^2}} \displaystyle{1 \over {( { {\rm \theta}} ^2 + { {\rm \theta}} _{\min} ^2 )^{3/2}}}. $$
Here and hereafter we denote
 $$ { {\rm \theta}} \equiv { {\rm \theta}} _x ( { {\rm \theta}} _y ).$$
Thus,
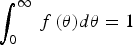
 $$f\,( { {\rm \theta}} ) = \displaystyle{1 \over { { {\rm \sigma}} _{{\rm tot}}}} \displaystyle{{d { {\rm \sigma}}} \over {d { {\rm \theta}}}} = \displaystyle{{ { {\rm \theta}} _{\min} ^2} \over {( { {\rm \theta}} ^2 + { {\rm \theta}} _{\min} ^2 )^{3/2}}}, $$
where f (θ) can be normalized (
 $\int_0^\infty {\,f\,( { {\rm \theta}} )d { {\rm \theta}}} = 1$
).
For the elastic scattering, we assume that CO gas is dominant for beam-gas scattering (CO is heavier than H2/He and almost as heavy as N2/Ne.), so that the total scattering probability in a unit time is
 $$N = Q { {\rm \sigma}} _{{\rm tot}} c,$$
where c is the speed of light, and Q is the number of atoms in a unit volume, given by
 $$Q = 2.65 \times 10^{20} nP,$$
where n is the number of atoms in each gas molecule, and P is the partial pressure of the gas in pascals. (Here for CO gas, Z = 501/2 and n = 2.)
The collision probability of electron and gas atoms during one damping time is
 $$N_{ {\rm \tau}} = N{ {\rm \tau}}, $$
where τ is the transverse damping time for either the horizontal or vertical direction.
Finally, one gets the beam transverse distribution as
 $$\eqalign{{ {\rm \rho}} (X) = & \displaystyle{1 \over { {\rm \pi}}} \int_0^{\infty} {\cos (kX)} \exp \left[ { - \displaystyle{{k^2} \over 2} + \displaystyle{2 \over { {\rm \pi}}} N_{ {\rm \tau}}} \right. \cr & \left. { \times \int_0^1 {\displaystyle{{\bigg\{ \int_0^{\infty} {\cos (k/( { {\rm \sigma}} _0^{\prime} )x { {\rm \theta}} )f\,( { {\rm \theta}} )d { {\rm \theta}}} \bigg\} - 1} \over x}\arccos (x)dx}} \right]dk \cr = & \displaystyle{1 \over { {\rm \pi}}} \int_0^{\infty} {\cos (kX)} \exp \left[ { - \displaystyle{{k^2} \over 2} + \displaystyle{2 \over { {\rm \pi}}} N_{ {\rm \tau}}} \right. \cr & \left. { \times \int_0^1 {\displaystyle{{{\rm \Theta} xkK_1 ({\rm \Theta} xk) - 1} \over x}\arccos (x)dx}} \right]dk,} $$
where Θ is the minimum scattering angle normalized by angular beam size, which is defined by
 $ { {\rm \theta}} _{\min} / { {\rm \sigma}} {}_0^{\prime} ( { {\rm \sigma}} {}_0^{\prime} = { {\rm \sigma}} {}_0/\overline { {\rm \beta}} )$
, and X denotes both horizontal and vertical normalized coordinate. This formula tells us that the disturbance of the beam distribution by the beam-gas scattering effect is decided by only two parameters, the normalized scattering frequency N
τ and the normalized minimum scattering angle Θ.
2.2. Beam-gas bremsstrahlung
As is well known, when the charged particles are accelerated, they emit electromagnetic radiation, that is, photons. In accelerators, an electron with energy E 0, which passes a molecule of the residual gas, is deflected in the electric field of the atomic nucleus. The electron loses energy due to the radiation emitted when an electron is deflected. This bremsstrahlung will be very strong for relativistic electrons. There is a certain probability that a photon with energy ε is emitted and the differential cross-section for an energy loss ε due to bremsstrahlung is given by (Kim, Reference Kim2004)
 $$\displaystyle{{d { {\rm \sigma}}} \over {d{ {\rm \varepsilon}}}} = 4 { {\rm \alpha}} r_{\rm e}^2 Z(Z + 1)\left( {\displaystyle{4 \over 3}\ln \displaystyle{{183} \over {Z^{1/3}}} + \displaystyle{1 \over 9}} \right)\displaystyle{1 \over { {\rm \varepsilon}}}. $$
Then, one can get the total scattering frequency
 $$\eqalign{ { {\rm \sigma}} _{{\rm tot}} = & \int_{E_{\min}} ^{E_{\max}} {\displaystyle{{d { {\rm \sigma}}} \over {d{ {\rm \varepsilon}}}} d{ {\rm \varepsilon}}} = 4 { {\rm \alpha}} r_{\rm e}^2 Z(Z + 1) \cr & \quad \times \left( {\displaystyle{4 \over 3}\ln \displaystyle{{183} \over {Z^{1/3}}} + \displaystyle{1 \over 9}} \right)\ln \displaystyle{{E_{\max}} \over {E_{\min}}}} $$
and the probability density function
 $$f\,({ {\rm \varepsilon}} ) = \displaystyle{1 \over { { {\rm \sigma}} _{{\rm tot}}}} \displaystyle{{d { {\rm \sigma}}} \over {d{ {\rm \varepsilon}}}} = \displaystyle{1 \over {\ln E_{\max} /E_{\min}}} \displaystyle{1 \over { {\rm \varepsilon}}} \;\left( {\int_{E_{\min}} ^{E_{\max}} {\,f\,({ {\rm \varepsilon}} )d{ {\rm \varepsilon}}} = 1} \right), $$
where E max is the maximum energy loss, which is equal to the ring energy acceptance and E min is the minimum energy loss for each scattering.
Also, using the same formulae given in Eqs (7)–(9), we can calculate the total collision frequency.
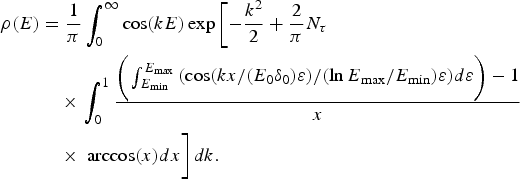
Thus, the beam energy distribution due to beam-gas bremsstrahlung can be expressed by
 $$\eqalign{{\rm \rho} (E) &= \displaystyle{1 \over {\rm \pi}} \int_0^\infty {\cos (kE)} \exp \left[ { - \displaystyle{{k^2} \over 2} + \displaystyle{2 \over {\rm \pi}} N_{\rm \tau}} \right. \cr & \quad \times \left. {\int_0^1 {\displaystyle{{\bigg(\int_{E_{\min}} ^{E_{\max}} {(\cos (kx/(E_0 {\rm \delta} _0 ){\rm \varepsilon} )/(\ln E_{\max} /E_{\min} ){\rm \varepsilon} )d{\rm \varepsilon}} \bigg) - 1} \over x} }} \right.\cr & \quad\times \left. \vphantom{{ - \displaystyle{{k^2} \over 2} + \displaystyle{2 \over {\rm \pi}} N_{\rm \tau}}} \arccos (x)dx \right]dk. } $$
2.3. Intrabeam scattering
IBS is the result of multiple small-angle Coulomb collisions between particles in the beam, which is different from the Touschek effect. The Touschek effect describes collision processes, which lead to the loss of both colliding particles. In reality, however, there are many other collisions with only small exchanges of momentum. Owing to the scattering effect, beam particles can transform their transverse momenta into longitudinal momenta randomly, which leads to a continuous increase of beam dimensions and to a reduction of the beam lifetime when the particles hit the aperture. Detailed theories of IBS have been developed in references (Piwinski, Reference Piwinski1974; Bjorken & Mtingwa, Reference Bjorken and Mtingwa1983; Duff, Reference Duff1987; Piwinski, Reference Piwinski1990; Raubenheimer, Reference Raubenheimer1992; Kubo & Oide, Reference Kubo and Oide2001; Kubo et al., Reference Kubo, Mtingwa and Wolski2005). However, the existing theories mainly discuss the RMS emittance growth and the rise time due to IBS, which cannot give the whole information of particle distribution because the real beam has a non-Gaussian distribution. In this paper, we will discuss the IBS-induced beam dilution for the longitudinal and vertical directions.
In the center-of-mass reference frame of two scattering particles, the differential cross-section of Coulomb scattering for electrons (or positrons) is given by the Möller formula (Bruck, Reference Bruck1966)
 $$\displaystyle{{d{\bar { {\rm \sigma}}}} \over {d{\rm \Omega}}} = \displaystyle{{4r_{\rm e}^2} \over {(v/c)^4}} \left( {\displaystyle{4 \over {\sin ^4 { {\rm \theta}}}} - \displaystyle{3 \over {\sin ^2 { {\rm \theta}}}}} \right),$$
where v is the relative velocity in the center-of-mass system that we will assume to be essentially horizontal because horizontal momentum is much larger than vertical momentum and hence will contribute more to momentum exchange, and θ is the scattering angle. The bar denotes the center-of-mass reference frame and the differential cross section
 $d{\bar { {\rm \sigma}}} $
is evaluated in the center-of-mass system.
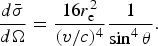
At small angles (as is common for IBS), the Möller formula for the differential cross-section reduces to
 $$\displaystyle{{d{\bar { {\rm \sigma}}}} \over {d{\rm \Omega}}} = \displaystyle{{16r_{\rm e}^2} \over {(v/c)^4}} \displaystyle{1 \over {\sin ^4 { {\rm \theta}}}}. $$
Considering the angular change of the momentum gives a momentum component perpendicular to the horizontal axis
 $$p_ \bot = p_x \sin { {\rm \theta}} $$
and
 $$dp_ \bot = p_x \cos { {\rm \theta}} d { {\rm \theta}} \approx - p_x d { {\rm \theta}} $$
with
 $$p_x = \displaystyle{{m_0 v} \over 2},$$
where m 0 is the rest mass of the electron. Also considering
 $$d{\rm \Omega} = 2 { {\rm \pi}} \sin { {\rm \theta}} d{ {\rm \theta}}, $$
one can get
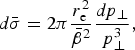 $$d{\bar { {\rm \sigma}}} = 2 { {\rm \pi}} \displaystyle{{r_{\rm e}^2} \over {{\bar { {\rm \beta}}} ^2}} \displaystyle{{dp_ \bot} \over {\,p_ \bot ^3}}, $$
where
 ${\bar { {\rm \beta}}} $
is the center-of-mass velocity of the electrons in units of c
 $({\bar { {\rm \beta}}} = v/2c)$
and p
⊥ is the momentum exchange from the horizontal direction to the perpendicular directions in the center-of-mass frame.
Furthermore, taking account of the fact that the probability is the same for transfers occurring in the vertical and longitudinal directions, we can get the differential cross section for longitudinal momentum growth in the center-of-mass system
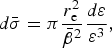 $$d{\bar { {\rm \sigma}}} = { {\rm \pi}} \displaystyle{{r_{\rm e}^2} \over {{\bar { {\rm \beta}}} ^2}} \displaystyle{{d{ {\rm \varepsilon}}} \over {{ {\rm \varepsilon}} ^3}}, $$
where ε is the longitudinal momentum change due to the IBS effect in the center-of-mass system. If we transfer the longitudinal momenta back to the laboratory system, then the real longitudinal momentum growth will be γε.
Finally, for a single test particle, the total number of events of momentum exchange from the horizontal direction to the longitudinal direction per second and the probability density function f(ε) can be written as Eqs (23) and (24).
 $$\eqalign{N = & \displaystyle{{4 { {\rm \pi}}} \over { { {\rm \gamma}} ^2}} \int {{\bar { {\rm \beta}}} cP(\vec x_1, \vec x_2 )} \int_{E_{\min}} ^\infty {\displaystyle{{d{\bar { {\rm \sigma}}}} \over {d{ {\rm \varepsilon}}}} d{ {\rm \varepsilon}}} d\vec x_1 d\vec x_2 \cr \approx & \displaystyle{{cr_{\rm e}^2} \over {6 { {\rm \gamma}} ^3}} \displaystyle{{N_{\rm e}} \over {E_{\min} ^2 { {\rm \sigma}} _x { {\rm \sigma}} _y { {\rm \sigma}} _z { {\rm \sigma}} _{x^{\prime}}}},} $$
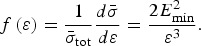 $$f\,({ {\rm \varepsilon}} ) = \displaystyle{1 \over {{\bar { {\rm \sigma}}} _{{\rm tot}}}} \displaystyle{{d{\bar { {\rm \sigma}}}} \over {d{ {\rm \varepsilon}}}} = \displaystyle{{2E_{\min} ^2} \over {{ {\rm \varepsilon}} ^3}}. $$
For the integration of Eq. (23), we have used the approximate result in (Raubenheimer, Reference Raubenheimer1992).
Thus, one gets the expression of beam energy distribution due to the IBS process as
 $$\eqalign{{\rm \rho} (E) &= \displaystyle{1 \over {\rm \pi}} \int_0^\infty {\cos (kE)} \exp \left[ { - \displaystyle{{k^2} \over 2} + \displaystyle{2 \over {\rm \pi}} N_{\rm \tau}} \right. \cr & \quad \times \left. {\int_0^1 {\displaystyle{{\bigg(\int_{E_{\min}}^{\infty} {(2E_{\min}^{2}\cos ((kx/(E_0 {\rm \delta} _0 ){\rm \gamma\varepsilon} )/{\rm \varepsilon^{3}} )d{\rm \varepsilon}} \bigg) - 1} \over x} }} \right.\cr & \quad\times \left. \vphantom{{ - \displaystyle{{k^2} \over 2} + \displaystyle{2 \over {\rm \pi}} N_{\rm \tau}}} \arccos (x)dx \right]dk, } $$
where N τ is the total scattering rate normalized by the longitudinal damping rate (N τ = Nτ z ) and E min is the minimum momentum increment in the longitudinal direction during the IBS process.
Furthermore, using the same method of beam-gas scattering, one can get the vertical distribution due to IBS as
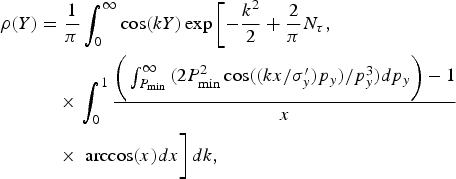 $$\eqalign{{\rm \rho} (Y) &= \displaystyle{1 \over {\rm \pi}} \int_0^\infty {\cos (kY)} \exp \left[ { - \displaystyle{{k^2} \over 2} + \displaystyle{2 \over {\rm \pi}} N_{\rm \tau}}, \right. \cr & \quad \times \left. {\int_0^1 {\displaystyle{{\bigg(\int_{P_{\min}}^{\infty} {(2P_{\min}^{2}\cos ((kx/ { {\rm \sigma}}^{\prime}_y)p_y)/p_y^3 )dp_y\bigg)} - 1} \over x} }} \right.\cr & \quad\times \left. \vphantom{{ - \displaystyle{{k^2} \over 2} + \displaystyle{2 \over {\rm \pi}} N_{\rm \tau}}} \arccos (x)dx \right]dk, } $$
where N τ is the total scattering rate normalized by the vertical damping rate (N τ = Nτ y ) and P min is the minimum momentum increment in the vertical direction during the IBS process.
3. ANALYTICAL ESTIMATION FOR ATF BEAM HALO
3.1. Beam-gas scattering
According to Eq. (10), we calculated the beam halo distribution with different emittances and different vacuum pressure.
3.1.1. Halo distribution with different vacuum pressures (E0 = 1.3 GeV, ε x = 1.3 nm, ε y = 20 pm)
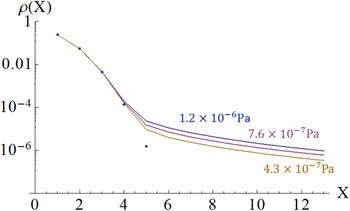
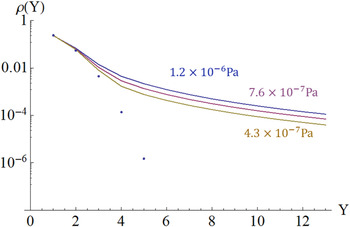
From Figures 1 and 2, we can see that due to the beam-gas scattering effect, the beam distribution will deviate from a Gaussian distribution. Worse vacuum status will give a larger beam halo and smaller Gaussian beam core. Also, it can be seen that the vertical distribution of a beam is affected more than the horizontal distribution by the elastic beam-gas scattering because σ y0′ ≪ σ x0′, so Θ y > Θ x .
Horizontal beam distribution with different vacuum pressures (horizontal coordinate X is normalized by RMS beam size and the dots show the Gaussian distribution).
Vertical beam distribution with different vacuum pressures (vertical coordinate Y is normalized by RMS beam size and the dots show the Gaussian distribution).
3.1.2. Halo distribution with different emittances (E0 = 1.3 GeV, P = 10−6 Pa)
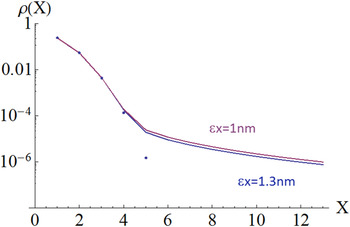
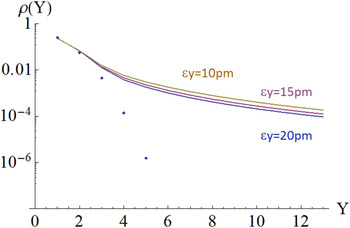
Figures 3 and 4 show that larger emittance will give smaller halo.
Horizontal beam distribution with different emittance (horizontal coordinate X is normalized by RMS beam size and the dots show the Gaussian distribution).
Vertical beam distribution with different emittance (vertical coordinate Y is normalized by RMS beam size and the dots show the Gaussian distribution).
3.2. Beam-gas bremsstrahlung
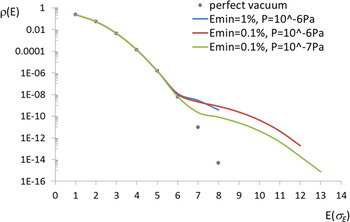
Figure 5 shows the beam energy distribution based on Eq. (14). From Figure 5, it can be seen that the level of beam halo is decided by the purity of the vacuum. Lower vacuum pressure will give a smaller beam halo. Also, it shows that minimum energy loss per scattering E min is an important parameter which can be adjusted. We therefore need to choose an appropriate E min, keeping in mind a balance of CPU computing time and halo length.
Energy distribution with different vacuum pressures and different minimum energy loss (The horizontal coordinate E is normalized by the natural energy spread and the dots show the Gaussian distribution).
3.3. Intra-beam scattering
Figure 6 shows the beam energy distribution based on Eq. (25). Here, we choose E min equal to 0.01% of nature energy spread. We can see that a larger beam density give a larger beam halo, which will also increase the RMS beam size. Since the design bunch population is 1 × 10¹⁰ for the ATF damping ring, from Figure 6, the beam energy distribution will deviate from a Gaussian shape outside 8σE and the halo particles will have about 1 × 10⁻¹⁶ of peak beam density. Compared with Figure 5, it can be seen that in the ATF damping ring, the energy distribution of the beam halo is dominated by the beam-gas bremsstrahlung effect rather than the IBS effect.
Energy distribution with different bunch populations (the horizontal coordinate E is normalized by the natural energy spread and the dots show the Gaussian distribution).
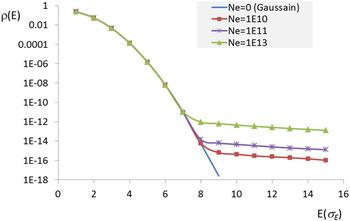
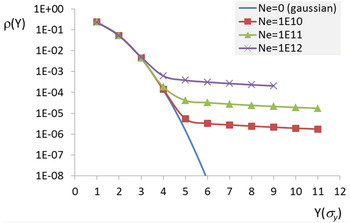
Figure 7 shows the vertical charge distribution based on Eq. (26). Here, we choose P min about 0.02% of the natural energy spread. In the ATF damping ring, the vacuum level is of the order of 10−7–10−6 Pa. According to Figure 2, the charge intensity of the vertical halo is about four orders of magnitude lower than the beam core in the ATF due to beam-gas scattering effect. So, it seems that in the ATF damping ring, the vertical distribution is dominated by beam-gas scattering rather than by the IBS effect.
Vertical distribution with different bunch populations (vertical coordinate Y is normalized by RMS beam size and the dots show the Gaussian distribution).
4. COMPARISON WITH MEASUREMENTS
4.1. Measurement with advanced halo monitor
In order to measure the beam halo distribution and make comparison with analytical estimation, KEK-ATF2 developed a beam halo monitor, which has both high resolution and high sensitivity based on a fluorescence screen. A YAG: Ce screen, which has 1 mm slit in the center was set in the beam line. The image on fluorescence screen is observed by an imaging lens system and a CCD (charge-coupled device) camera. In this configuration, the beam in the core will pass through the slit. The beam in the surrounding halo will hit the fluorescence screen, and we can observe the distribution of beam halo. The intensity contrast of beam halo to the beam core is measured by scanning the beam position for the fixed fluorescence screen position. Figures 8 and 9 show the very fresh measurements in 2015 by a YAG: Ce screen (Naito & Mitsuhashi, Reference Naito and Mitsuhashi2015).
Vertical distribution of the beam halo for the different vacuum condition in the case of the beam intensity 0.23 × 10¹⁰ electrons.
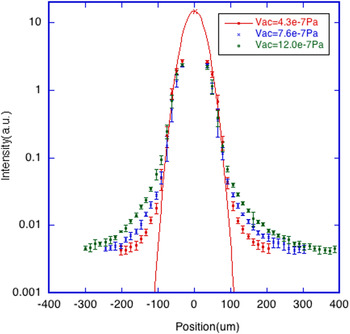
Vertical distribution of the beam halo for the different vacuum condition in the case of the beam intensity 0.45 × 10¹⁰ electrons.
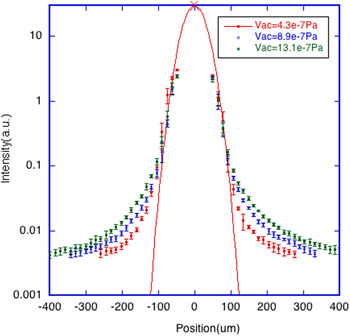
By comparing Figures 8 and 9 with Figure 2, we found amazing agreement. Also we can see little difference for charge intensity between Figures 8 and 9. It is a good proof of our prediction that in ATF the vertical distribution is dominated by beam-gas scattering rather than by the IBS effect.
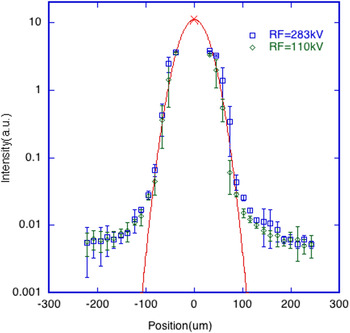
The distribution of the beam halo for the different radio frequency (RF) voltage of the damping ring is plotted in Figure 10 in the case of the beam intensity 0.23 × 10¹⁰ electrons (Naito & Mitsuhashi, Reference Naito and Mitsuhashi2015). Two different RF voltages are plotted, V rf = 283 and 110 kV, respectively. The bunch length and the energy spread of the beam is a function of the RF voltage and the difference is about 10% for the two cases. The bunch length will affect the size of beam core by the IBS. The measurement shows almost same level of beam halo for the two cases. Once again it verified our theoretical expectation that ATF vertical halo is determined by beam-gas scattering effect rather than IBS effect.
Vertical distribution of beam halo for the different RF voltage in the case of the beam intensity 0.23 × 10¹⁰ electrons.
4.2. Measurement with wire scanner
Before the completion of ATF2 beam line, halo distribution was also measured in the old ATF extraction line with wire scanners in ATF spring run of 2005 (Suehara et al., Reference Suehara, Oroku, Yamanaka, Yoda, Nakamura, Kamiya, Honda, Kume, Tauchi, Sanuki and Komamiya2008). The wire scanner consists of a metal wire (tungsten in the ATF) with a micromover to scatter the electron beam at every wire position. The scattered photons are counted by a gamma detector, which is an air-Cherenkov counter with a lead converter and a PMT.
Figure 11 is the horizontal charge distribution using the ATF extraction line wire scanner MW2X. The plot shows that the distribution in the beam center of <4σ range is well approximated by a Gaussian (bold line), while in the region of >4σ, the deviation from the central Gaussian is large. This measurement result agrees well with analytical estimation in Figures 1 and 3.
Horizontal charge distribution using the ATF extraction line wire scanner MW2X.
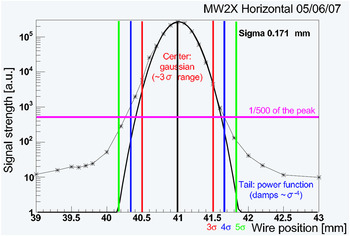
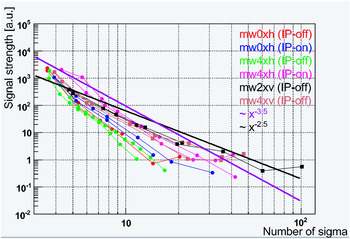
Figure 12 is the halo distribution for both horizontal and vertical directions which are measured at different locations. This plot shows a comparison of the halo distribution for several beam sizes. It is also a proof to our theoretical expectation that the vertical distribution of the beam is affected more than the horizontal distribution due to beam-gas scattering.
Measurement of the halo part using several wire scanners for both vertical and horizontal directions (horizontal axis is normalized by beam size). Vertical beam profiles are shown as a square, and horizontal beam profiles are shown as a circle. The difference of the IP-on data and the IP-off data is the vacuum level. For the IP-off data, some of the ion pumps in the ATF damping ring were turned off to obtain data with degraded vacuum. The difference of the vacuum level is about 1:5.
5. REMAINING ISSUES
There are still several issues remaining to be addressed for a whole systematic study.
-
1. The horizontal halo due to IBS, where a coupling effect between longitudinal and horizontal directions exists through horizontal dispersion, has not been solved out theoretically. The horizontal distribution due to IBS will be more difficult than the vertical direction.
-
2. The combined influence on beam halo due to beam-gas scattering ring, beam-gas bremsstrahlung, and IBS has not been given.
-
3. It is a pity that we have no measurement results for longitudinal distribution to support our theory related to the longitudinal halo so far.
6. CONCLUSIONS
Owing to various incoherent stochastic processes in the electron (positron) rings in an accelerator, the beam distribution will deviate from a Gaussian shape, generating a longer beam tail, and increasing the beam dimensions. With the background issue, we have to study the halo distributions and the mechanisms by which the halo particles are produced. Once we understand the mechanisms of how the halo comes up, we can estimate the intensity level at halo part and try to control/reduce the halo. Furthermore, we can predetermine the requirement for the vacuum pressure in order to control the beam halo at a certain level at the early stage of accelerator design. Take ATF as an example, we try to estimate the halo status with different emittance and vacuum level. In this paper, we have calculated the whole beam distribution of the ATF damping ring, including the halo section, based on our own theory. By comparing with measurements, we saw a good agreement between the analytical method and the experimental results. The analytical method developed in this paper is not specific to ATF and can be utilized on any circular electron (positron) accelerator.
For the RMS emittance growth, we do have some mature theories and numerical codes to use, while for the whole beam distribution, especially for the halo part, there are few mature theories. Even using simulations, it is still difficult to get the halo distribution because the beam halo includes much fewer particles than the beam core and the statistics for halo is not enough given certain amount of micro-particles per bunch. For the first time, we have given a theoretical method to estimate the whole beam distribution of the lepton ring, especially for the halo part, with different emittance and vacuum level. From our study, we know that the transverse halo in ATF is dominated by beam-gas scattering, and also smaller emittance and worse vacuum give larger beam halo. Also we can expect that the longitudinal halo in ATF is dominated by the beam-gas bremsstrahlung effect. For the next, we are trying to study the horizontal distribution due to IBS and the method how to evaluate the combine effect from the three stochastic processes.
ACKNOWLEDGMENTS
The authors would like to thank all the colleagues in ATF/ATF2 group and thank KEK managements for their support of this international project. This work was supported by National Key Programme for S&T Research and Development (Grant no. 2016YFA0400400), National Foundation of Natural Sciences (Grant numbers 11575218 and 11505198) and the France-China Particle Physics Laboratory (FCPPL).



