


1. Introduction
Turbulent Rayleigh–Bénard convection (RBC) occurs in a layer of fluid between two horizontal plates in the presence of gravity, with the top (bottom) plate at a temperature  $T_t$ (
 $T_b$) and
 $T_b > T_t$ (Ahlers Reference Ahlers2009; Ahlers, Grossmann & Lohse Reference Ahlers, Grossmann and Lohse2009b; Lohse & Xia Reference Lohse and Xia2010; Chillà & Schumacher Reference Chillà and Schumacher2012). For a cylindrical sample, the RBC flow is determined by the Rayleigh number
 $Ra \equiv \alpha g \varDelta L^3 / (Nu\ \kappa )$, the Prandtl number
 $Pr \equiv \nu /\kappa$, the aspect ratio
 $\varGamma \equiv D/L$ and the thermal properties of the sidewall (Wan et al. Reference Wan, Wei, Verzicco, Lohse, Ahlers and Stevens2019). Here
 $g$ is the gravitational acceleration,
 $\varDelta \equiv T_b - T_t$ and
 $\alpha$,
 $\nu$ and
 $\kappa$ are, respectively, the thermal expansion coefficient, the kinematic viscosity and the thermal diffusivity of the fluid. When
 $Ra$ is moderate (say
 $Ra \underset{\smash{\scriptscriptstyle\thicksim}} { < } 10^{13}$ for
 $Pr \simeq 1$), most of
 $\varDelta$ is sustained by two thermal boundary layers (BLs), each of thickness
 $\lambda << L$, and one each adjacent to the top and bottom plate. While the flow in the majority (the ‘bulk’) of the sample is turbulent, the BLs remain laminar (albeit time dependent). This state is referred to as ‘classical’ RBC. As
 $Ra$ increases, the shear applied to the BLs by the turbulent flow in the bulk increases and beyond a critical value
 $Ra^*$ the BLs are expected to become turbulent as well (Kraichnan Reference Kraichnan1962). For
 $Pr \simeq 1$ it was predicted (Grossmann & Lohse Reference Grossmann and Lohse2001, Reference Grossmann and Lohse2011) and found from experiment (He et al. Reference He, Funfschilling, Nobach, Bodenschatz and Ahlers2012b) that
 $Ra^* = {{O}}(10^{14})$. This state is known as the Kraichnan state (Kraichnan Reference Kraichnan1962) or, as it is expected to persist up to arbitrarily large
 $Ra$, the ‘ultimate’ state (Chavanne et al. Reference Chavanne, Chilla, Castaing, Hebral, Chabaud and Chaussy1997).
The spatial variation of the near-wall mean temperature  $\langle T(t,z,r) \rangle$ (
 $\langle \dots \rangle$ represents the average over the time
 $t$,
 $z$ is the vertical distance from the bottom plate and
 $r$ is the radial position) and its fluctuations as represented by its variance
 $\sigma ^2(z,r) \equiv \langle [ T(t,z,r) - \langle T(t,z,r) \rangle ]^2\rangle$ are of interest for several reasons. They are the key quantities for understanding the mechanism of convective heat transport, i.e. of the Nusselt number
 $Nu \equiv QL/(k\varDelta )$ (here
 $Q$ is the global heat flux and
 $k$ the fluid thermal conductivity). Further, the near-wall temperature fluctuations are important in many industrial and natural systems where
 $Ra$ is large, such as those found in climatology (van Doorn et al. Reference van Doorn, Dhruva, Sreenivasan and Cassella2000), oceanography (Marshall & Schott Reference Marshall and Schott1999), geophysics (Cardin & Olson Reference Cardin and Olson1994) and astrophysics (Busse Reference Busse1994).
A thermal BL equation that takes into account the effect of turbulent fluctuations was derived recently for a laterally infinite system and yielded near-wall profiles  $\langle T(t,z) \rangle$ (Shishkina et al. Reference Shishkina, Horn, Wagner and Ching2015) and
 $\sigma (z)^2$ (Wang, He & Tong Reference Wang, He and Tong2016) that agree well with experimental data in the range
 $0 \underset{\smash{\scriptscriptstyle\thicksim}} { < } z/\lambda \underset{\smash{\scriptscriptstyle\thicksim}} { < } 4$ (Wang et al. Reference Wang, He and Tong2016, Reference Wang, Xu, He, Yik, Wang, Schumacher and Tong2018). Using dimensional analysis for the mixing zone (
 $z/\lambda \underset{\smash{\scriptscriptstyle\thicksim}} { > } 5$ and
 $z/L \underset{\smash{\scriptscriptstyle\thicksim}} { < } 0.1$) of convection over a horizontal heated plate, the Priestly similarity law (Priestley Reference Priestley1956) yields the scaling
 $\sigma (z) \sim z^{-\zeta }$ with
 $\zeta = 1/3$ and
 $Nu \sim Ra^{1/3}$. A mixing-layer model (Castaing et al. Reference Castaing, Gunaratne, Heslot, Kadanoff, Libchaber, Thomae, Wu, Zaleski and Zanetti1989) gives rise to two scenarios for the form of
 $\sigma (z)$: the power-law form with
 $\zeta = 1/2$ and a logarithmic form (Adrian Reference Adrian1996), both of which yield
 $Nu \sim Ra^{2/7}$. The spatial variations of
 $\sigma (z,r)$ had been extensively studied in experiments (Maystrenko, Resagk & Thess Reference Maystrenko, Resagk and Thess2007; du Puits et al. Reference du Puits, Resagk, Tilgner, Busse and Thess2007; Sun, Cheung & Xia Reference Sun, Cheung and Xia2008; Zhou & Xia Reference Zhou and Xia2013; Wei & Ahlers Reference Wei and Ahlers2016; Wang et al. Reference Wang, He and Tong2016, Reference Wang, Xu, He, Yik, Wang, Schumacher and Tong2018) and numerical simulations (Emran & Schumacher Reference Emran and Schumacher2008; Schmitz & Tilgner Reference Schmitz and Tilgner2009; Wang et al. Reference Wang, Xu, He, Yik, Wang, Schumacher and Tong2018) in the parameter space
 $0.7 \underset{\smash{\scriptscriptstyle\thicksim}} { < } Pr \underset{\smash{\scriptscriptstyle\thicksim}} { < } 12.3$ and
 $4\times 10^5 \underset{\smash{\scriptscriptstyle\thicksim}} { < } Ra \underset{\smash{\scriptscriptstyle\thicksim}} { < } 2\times 10^{12}$ in RBC samples with varying geometries. Due to limited ranges of
 $\lambda$ and
 $L$, most measurements do not clearly distinguish one from another of the predicted forms. Recent
 $\sigma$ data measured in the large-scale flow shearing region were found to follow a power-law form with
 $\zeta = 0.5$, while near the plume accumulated region the form of
 $\sigma (z)$ seems to depend on
 $Ra$ and the sample geometry (Wei & Ahlers Reference Wei and Ahlers2016; Wang et al. Reference Wang, Xu, He, Yik, Wang, Schumacher and Tong2018; He & Xia Reference He and Xia2019). Besides the mixing-layer model, a new equation for
 $\sigma ^2$ was derived for the mixing zone based on experimental and numerical data (Wang et al. Reference Wang, Xu, He, Yik, Wang, Schumacher and Tong2018), which has a power-law solution and the exponent is given by
 $\zeta = (1/10)[1+[1+20/(a_1a_2)]^{1/2}]$. Here
 $a_1$ and
 $a_2$ are two scaling factors with
 $a_1a_2 \simeq 1$ near the central axis of a cylindrical sample with
 $\varGamma \simeq 1$.
Here we report new measurements of temperature frequency spectra  $P(\,f, z, r)$, of the variance
 $\sigma ^2(z,r)$ and of the Nusselt number
 $Nu$ over the large
 $Ra$ range
 $10^{12} \underset{\smash{\scriptscriptstyle\thicksim}} { < } Ra \underset{\smash{\scriptscriptstyle\thicksim}} { < } 5\times 10^{15}$ for
 $Pr \simeq 0.8$ in three cylindrical samples with
 $\varGamma = 0.33$,
 $0.50$ and
 $1.00$. Most of our measurements are at fixed values of
 $r$ and for varying
 $z$ and
 $Ra$. Thus, for simplicity of notation, we henceforth suppress mentioning the
 $r$-dependence of the measured quantities. The results for
 $P(\,f, z)$ confirm the earlier findings of universal
 $f^{-1}$ temperature frequency spectra for
 $\varGamma = 0.50$ (He et al. Reference He, van Gils, Bodenschatz and Ahlers2014) and extend them to
 $\varGamma = 0.33$ and 1.00. For each
 $\varGamma$, we found in the classical state that the dimensionless
 $\sigma ^2(z)/\varDelta ^2$ data, when plotted as a function of
 $z/\lambda$, fall onto a single curve independent of
 $Ra$ over the wide range
 $20 \underset{\smash{\scriptscriptstyle\thicksim}} { < } z/\lambda \underset{\smash{\scriptscriptstyle\thicksim}} { < } 10^4$. Here
 $\lambda \equiv L/(2{Nu})$ is the thermal BL thickness. In the transition range
 $Ra^*_1 \underset{\smash{\scriptscriptstyle\thicksim}} { < } Ra \underset{\smash{\scriptscriptstyle\thicksim}} { < } Ra^*_2$ to the ultimate state, as well as in the ultimate state itself, it was necessary to replace
 $\lambda$ with an adjustable parameter
 $\tilde {\lambda } = L/(2 \widetilde {Nu})$ to achieve a similar data collapse. The needed parameter
 $\widetilde {Nu}$ gradually became larger than
 $Nu$ as
 $Ra$ increased. For
 $Ra \underset{\smash{\scriptscriptstyle\thicksim}} { > } Ra^*_2$, we found that
 $\widetilde {Nu}$ was systematically larger than the measured
 $Nu$, but both
 $Nu$ and
 $\widetilde {Nu}$ agreed well with the predicted scaling
 $Nu \propto Ra^\gamma$ with
 $\gamma = 0.38 \pm 0.02$ for the ultimate regime. On the basis of the above experimental findings and the universal
 $f^{-1}$ temperature frequency spectra we derived an equation for
 $\sigma ^2/\varDelta ^2$ (He, Bodenschatz & Ahlers Reference He, Bodenschatz and Ahlers2021) which can fit the overlapped variance data over the whole range
 $0.018 \underset{\smash{\scriptscriptstyle\thicksim}} { < } z/L \underset{\smash{\scriptscriptstyle\thicksim}} { < } 0.5$.
2. Experimental conditions
Details of the experiment for  $\varGamma = 0.50$ and
 $1.00$ were reported before (Ahlers et al. Reference Ahlers, He, Funfschilling and Bodenschatz2012b; He et al. Reference He, Funfschilling, Bodenschatz and Ahlers2012a, Reference He, van Gils, Bodenschatz and Ahlers2015). The apparatus and measuring procedures for
 $\varGamma = 0.33$ are similar. Here we only mention some key information. Three convection samples had the same diameter
 $D = 1.12$ m and different heights
 $L = 1.12$,
 $2.24$ and
 $3.40$ m. They were placed in a pressure vessel known as the ‘Uboot of Göttingen’ (Ahlers, Funfschilling & Bodenschatz Reference Ahlers, Funfschilling and Bodenschatz2009a). Both Uboot and sample were filled with compressed sulphur hexafluoride (SF
 $_6$) gas at pressures up to 19 bar. The sample bulk temperature
 $T_m = (T_b+T_t)/2$ was maintained around
 $21.5\,^\circ \textrm {C}$, so that the Prandtl number was kept in a small range
 $0.79 \underset{\smash{\scriptscriptstyle\thicksim}} { < } Pr \underset{\smash{\scriptscriptstyle\thicksim}} { < } 0.86$. After the measurements for
 $\varGamma = 0.50$ and
 $1.00$, we extended the turret of the Uboot to accommodate the
 $L = 3.4$ m sample that can reach the largest
 $Ra \simeq 5\times 10^{15}$. All samples were levelled relative to gravity to within
 $10^{-4}$ rad. We controlled the temperature difference
 $\varDelta$ between the horizontal plates and monitored the bulk temperatures in the sample. All measurements were done under nearly Boussinesq conditions (He et al. Reference He, Funfschilling, Nobach, Bodenschatz and Ahlers2013). Local temperature profiles were measured using a column of thermistors installed in the range
 $0.018 \underset{\smash{\scriptscriptstyle\thicksim}} { < } z/L \underset{\smash{\scriptscriptstyle\thicksim}} { < } 0.5$ near the vertical walls with their radial locations
 $\xi \equiv (R-r)/R$ (
 $R$ is the sample radius) listed in table 1. Details of the thermistor specifications were reported in previous work (Ahlers, Bodenschatz & He Reference Ahlers, Bodenschatz and He2014; He et al. Reference He, van Gils, Bodenschatz and Ahlers2014).
Radial locations of the  $\sigma ^2(z)$ measurements, and values of
 $Ra^*_1$ and
 $Ra^*_2$, for the three RBC samples.

3. Results
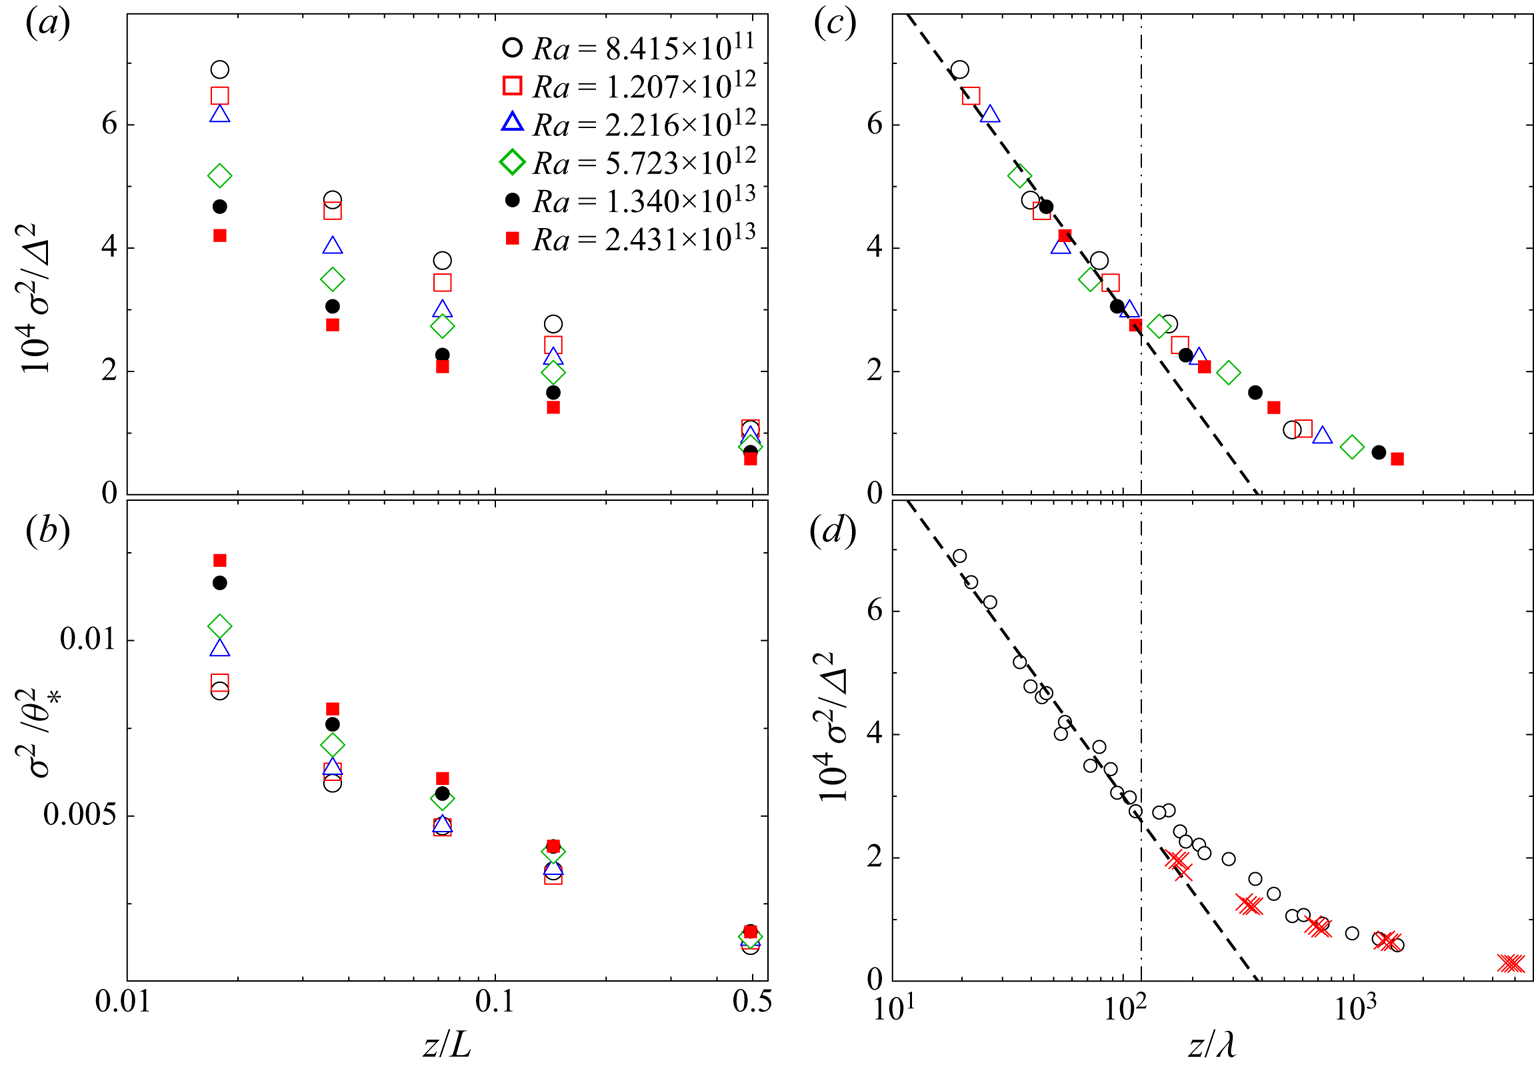
Figure 1 shows several typical sets of  $\sigma ^2(z)$ data as a function of
 $z/L$ for
 $\varGamma = 0.50$. In figure 1(a,b), the variance data for
 $8\times 10^{11} \underset{\smash{\scriptscriptstyle\thicksim}} { < } Ra \underset{\smash{\scriptscriptstyle\thicksim}} { < } 2\times 10^{13}$ were scaled by
 $\varDelta ^2$ and
 $\theta _*^2$, respectively. Here
 $\theta _* = Q_0 / (Q_0\beta g L)^{1/3}$ with
 $Q_0 = \kappa Nu \varDelta / L$. This is a temperature scale for the mixing zone (
 $z/\lambda \underset{\smash{\scriptscriptstyle\thicksim}} { > } 5$ and
 $z/L \underset{\smash{\scriptscriptstyle\thicksim}} { < } 0.1$) proposed by Deardorff (Reference Deardorff1970). The plots show that neither
 $\sigma ^2/\varDelta ^2$ nor
 $\sigma ^2/\theta _*^2$ collapse onto a single (‘universal’) curve when plotted as a function of
 $z/L$.
Fluctuation results for  $\varGamma = 0.50$ at the radial location
 $\xi = 0.0357$. (a)
 $\sigma ^2(z)/\varDelta ^2$ and (b)
 $\sigma ^2(z)/\theta _*^2$ as a function of
 $z/L$ for several
 $Ra$. (c)
 $\sigma ^2(z)/\varDelta ^2$ as a function of
 $z/\lambda = (z/L)\times (2Nu)$. The data are the same as in (a). (d)
 $\sigma ^2(z)/\varDelta ^2$ for
 $Ra \underset{\smash{\scriptscriptstyle\thicksim}} { < } 2.5\times 10^{13}$ (black circles) and for
 $Ra \underset{\smash{\scriptscriptstyle\thicksim}} { > } 2\times 10^{14}$ (red crosses) as a function of
 $z/\lambda$. Here
 $Nu$ was simultaneously measured with the same sample in the classical state. The dashed lines in (c,d) represent the logarithmic function
 $\sigma ^2(z) / \varDelta ^2= M\times \ln (z/\lambda ) + N$.

In the mixing zone, where plumes accumulate above or below the thermal BL, local temperature fluctuations are dominated by thermal plumes rather than by turbulent background flow. As the thermal plumes have emanated from the temperature BLs, the plume region and the BLs can be expected to be characterized by the same scales. To test this idea, we used the BL thickness  $\lambda$ as the length scale and
 $\varDelta$ as the temperature scale for our data. In figure 1(c), we plot the
 $\sigma ^2(z)/\varDelta ^2$ data shown in figure 1(a) as a function of
 $z/\lambda$. Here
 $\lambda = L/(2{Nu})$ with
 $Nu$ simultaneously measured with the same sample. Details of the
 $Nu$ measurements have been reported previously (Ahlers et al. Reference Ahlers, He, Funfschilling and Bodenschatz2012b; He et al. Reference He, Funfschilling, Nobach, Bodenschatz and Ahlers2012b), and the results showed
 ${Nu} = 0.1044Ra^{0.312}$ in the classical regime. It is found that the measured
 $\sigma ^2/\varDelta ^2$ for all
 $Ra$ collapse onto a universal curve over the whole range of
 $z/\lambda$. In figure 1(d), we added the variance data for
 $Ra \underset{\smash{\scriptscriptstyle\thicksim}} { > } 2 \times 10^{14}$ for comparison. For those data, the values of
 $\lambda$ were calculated using the extrapolation of the
 $Nu$ power law given above for the classical state. It is seen that the normalized variance profiles deviate from the collapsed curve for
 $Ra < Ra^*_1 \simeq 2 \times 10^{13}$, with deviations larger than experimental errors.
Previous experimental and numerical studies had found that some features of the temperature field in RBC behave in a manner analogous to those of the velocity in wall-bounded turbulence. For  $z/\lambda \underset{\smash{\scriptscriptstyle\thicksim}} { > } 10$ and
 $z/L \underset{\smash{\scriptscriptstyle\thicksim}} { < } 0.1$ (the plume-dominated mixing region) the mean temperature
 $\langle T(z) \rangle$ follows a logarithmic profile (Ahlers et al. Reference Ahlers, Bodenschatz, Funfschilling, Grossmann, He, Lohse, Stevens and Verzicco2012a, Reference Ahlers, Bodenschatz and He2014; van der Poel et al. Reference van der Poel, Ostilla-Mónico, Verzicco, Grossmann and Lohse2015). In the logarithmic layer the temperature frequency spectra
 $P(\,f\tau _0)$ have the universal
 $f^{-1}$ scaling
 $P(\,f\tau _0) = P_0\times (\,f\tau _0)^{-1}$ with
 $P_0 = 0.208$. Here
 $\tau _0 = \sqrt {2R_0}$ is the Taylor microscale in time, where
 $R_0$ is the radius of curvature of the temperature autocorrelation function at
 $\tau = 0$ (He et al. Reference He, van Gils, Bodenschatz and Ahlers2014). Far above the plate, near
 $z/L = 0.5$, the spectra closely follow
 $P(\,f\tau _0) \sim (\,f\tau _0)^{-1.67}$, consistent with the Obukhov–Corrsin scaling for passive scalars in fully developed turbulence (Obukhov Reference Obukhov1949; Corrsin Reference Corrsin1951). For velocity in shear-flow turbulence the logarithmic variation arises from eddies attached to the wall (Townsend Reference Townsend1976), while for the temperature in RBC it is due to thermal plumes emitted by the BL (Ahlers et al. Reference Ahlers, Bodenschatz and He2014; van der Poel et al. Reference van der Poel, Ostilla-Mónico, Verzicco, Grossmann and Lohse2015). It is reasonable to assume that plumes in RBC play a role similar to the eddies in shear-flow turbulence. With this assumption, we proposed a model for the temperature variance based on dimensional analysis in wavenumber space (He et al. Reference He, Bodenschatz and Ahlers2021), and derived the universal form
 \begin{equation} \sigma^2/\varDelta^2 = c_1\ln(z/\lambda) + c_2 + c_3 (z/\lambda)^{{-}0.5} \end{equation}
for  $\sigma ^2$. Note that in (3.1) the predicted scaling function of
 $\sigma ^2$ is universal, but not the parameters. The parameters
 $c_1$,
 $c_2$ and
 $c_3$ can be adjusted so as to fit the data, but their relationships to other quantities are given by
(He et al. Reference He, Bodenschatz and Ahlers2021)
 $$\begin{gather} c_1 ={-}M_1 , \end{gather}$$
 $$\begin{gather}c_2 = N_1-M_1 \ln\left( \frac{Re_*}{2Nu}\right) \end{gather}$$
and
 \begin{equation} c_3 = C_1 \left( \frac{Pr Re_*}{2Nu} \right)^{{-}0.5} , \end{equation}
where  $M_1$ and
 $C_1$ are universal constants,
 $N_1$ is a large-scale characteristic constant, the shear velocity
 $u_* \equiv \sqrt {\nu (\partial U/\partial z )\vert _{z=0}}$ and the Reynolds number
 $Re_*= u_*L/\nu$. In a confined RBC sample, we should of course expect the three parameters (
 $c_1$,
 $c_2$ and
 $c_3$) to depend on
 $r$ and
 $\varGamma$, and thus to be determined from experimental data. Note that when
 $Pr$ approaches infinite, the power-law term in (3.1) vanishes and the temperature variance will solely follow the logarithmic profile.
To test this model, we used (3.1) to fit the  $\sigma ^2/\varDelta ^2$ data in the classical regime for
 $Ra \underset{\smash{\scriptscriptstyle\thicksim}} { < } 1.5 \times 10^{13}$ and
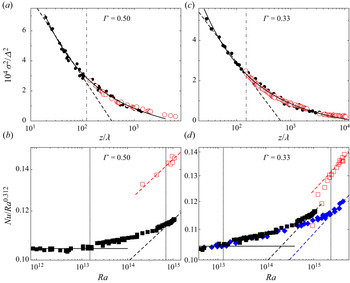
 $\varGamma = 0.50$. As shown in figure 2(a), the overlapped
 $\sigma ^2/\varDelta ^2$ data can be well described by the fitted curve over the whole range of
 $z/\lambda$, which corresponds to
 $z/L \underset{\smash{\scriptscriptstyle\thicksim}} { < } 0.5$ and thus covers essentially the entire sample. This fit indicates that the model captures the essential physics. In the range
 $20 \underset{\smash{\scriptscriptstyle\thicksim}} { < } z/\lambda \underset{\smash{\scriptscriptstyle\thicksim}} { < } 120$, which is the logarithmic layer for
 $\langle T(z) \rangle$ (Ahlers et al. Reference Ahlers, Bodenschatz and He2014), the variance data closely follow a logarithmic form as illustrated by the dashed line. It is noted that in the same range, a power function with adjustable parameters can fit the
 $\sigma ^2(z)/\varDelta ^2$ data almost equally well; however, neither a logarithmic nor a power function can fit the overlapped data over the whole range of
 $z/\lambda$ well above
 $1000$.
Results for (a,c)  $\sigma ^2/\varDelta ^2$ as a function of
 $z/\lambda$ and (b,d) the reduced
 $Nu/Ra^{0.312}$ as a function of
 $Ra$. Results in (a,b) are for
 $\varGamma = 0.50$ and in (c,d) are for
 $\varGamma = 0.33$. In (a) black filled circles represent the data for
 $Ra \underset{\smash{\scriptscriptstyle\thicksim}} { < } 2\times 10^{13}$ with
 $\lambda = L/(2Nu)$. The black line is the fit of (3.1) to the filled circles which gave
 $c_1 = -1.84\times 10^{-5}$,
 $c_2 = 1.24\times 10^{-4}$ and
 $c_3 = 2.75\times 10^{-3}$. Red open circles are for
 $Ra \underset{\smash{\scriptscriptstyle\thicksim}} { > } 2\times 10^{14}$ with
 $\lambda$ replaced by
 $\tilde {\lambda } = L/(2 \widetilde {Nu})$ with
 $\widetilde {Nu}$ adjusted to give the best fit to the solid line. In (c) black filled circles represent the variance data for
 $Ra \underset{\smash{\scriptscriptstyle\thicksim}} { < } 5.5 \times 10^{14}$. The solid line is the fit of (3.1) to the filled circles which gave
 $c_1 = -8.53\times 10^{-6}$,
 $c_2 = 6.09\times 10^{-5}$ and
 $c_3 = 2.56\times 10^{-3}$. Red open circles are for
 $Ra \underset{\smash{\scriptscriptstyle\thicksim}} { > } 10^{15}$ with
 $\lambda$ replaced by
 $\tilde {\lambda }$. In (b,d) black filled squares are the measured
 $Nu$ for
 $\varGamma = 0.50$, while the filled blue diamonds in (d) are the measured
 $Nu$ for
 $\varGamma = 0.33$. Red squares represent
 $\widetilde {Nu}$ obtained from the fit of the red open circles to the solid curves in (a,c). The horizontal lines represent the classical scaling
 $Nu = 0.1044Ra^{0.312}$. Two pairs of vertical dotted lines are at
 $Ra^*_1$ and
 $Ra^*_2$ (see table 1). The parallel dashed lines represent the ultimate effective scaling
 $Nu \propto Ra^{0.38}$ and are plotted so as to pass through the data for
 $Ra > Ra^*_2$.

For  $Ra \underset{\smash{\scriptscriptstyle\thicksim}} { > } 2 \times 10^{14}$ (i.e. during the transition to and in the ultimate state) the data deviated from the common curve found at smaller
 $Ra$ as illustrated in figure 1(d). As shown by the open red circles in figure 2(a,c), these large-
 $Ra$ data could be brought onto the same curve by replacing
 $\lambda$ with
 $\tilde \lambda = L/(2 \widetilde {Nu})$ and adjusting
 $\widetilde {Nu}$. The resulting values of
 $\widetilde {Nu}$ are shown as open red squares in figure 2(b,d). Figure 2(b) shows
 $Nu/Ra^{0.312}$ (filled squares) as a function of
 $Ra$ for
 $\varGamma = 0.50$. For
 $Ra > Ra^*_2 \simeq 8\times 10^{14}$ one sees that both
 $Nu$ and
 $\widetilde {Nu}$ follow the predicted scaling
 $Nu\propto Ra^{0.38 \pm 0.02}$ for the ultimate state, but the
 $\widetilde {Nu}$ data are larger by a factor of 1.09 than those for
 $Nu$.
For  $\varGamma = 0.33$ we found that the normalized temperature spectra
 $P(\,f\tau _0)$ in the logarithmic region have the same form as that for
 $\varGamma = 0.50$ (not shown). Thus our model for the temperature variance is expected to be valid also for
 $\varGamma = 0.33$. Figure 2(c) shows
 $\sigma ^2/\varDelta ^2$ as a function of
 $z/\lambda$ measured at the radial location
 $\xi = 0.0357$ for
 $\varGamma = 0.33$. Filled black circles represent the data for
 $9.8\times 10^{12} \underset{\smash{\scriptscriptstyle\thicksim}} { < } Ra \underset{\smash{\scriptscriptstyle\thicksim}} { < } 5.6 \times 10^{14}$. As expected, all the variance data fall onto a unique curve also for this
 $\varGamma$, and they are well described by (3.1). For large
 $Ra$, in the range
 $9.6\times 10^{14} \underset{\smash{\scriptscriptstyle\thicksim}} { < } Ra \underset{\smash{\scriptscriptstyle\thicksim}} { < } 4.5 \times 10^{15}$, the data did not fall onto the same curve and
 $\tilde {\lambda }$ with an adjustable
 $\widetilde {Nu}$ had to be used to achieve the fit shown by the open red circles in figure 2(c).
In figure 2(d) we show the results for  $Nu$ (filled blue diamonds) and
 $\widetilde {Nu}$ (open red squares) for
 $\varGamma = 0.33$. For comparison we also added the measured
 $Nu$ for
 $\varGamma = 0.50$ shown already in figure 2(b) (filled black squares) to the same plot. Over the large range
 $10^{12} \underset{\smash{\scriptscriptstyle\thicksim}} { < } Ra \underset{\smash{\scriptscriptstyle\thicksim}} { < } 5\times 10^{14}$ the results of
 $Nu$ for both
 $\varGamma$ agree well with each other and reveal a gradual transition from the classical scaling (horizontal solid line) for
 $Ra < Ra^*_1 \simeq 1.3 \times 10^{13}$ towards the ultimate scaling. For
 $\varGamma = 0.33$ we found
 $Ra^*_2 \simeq 2.3 \times 10^{15}$, which is larger than that for
 $\varGamma = 0.50$ and leads to a larger range of the transition. For
 $Ra \underset{\smash{\scriptscriptstyle\thicksim}} { > } Ra^*_2$, both
 $Nu$ and
 $\widetilde {Nu}$ were found to follow the predicted ultimate scaling, with
 $\widetilde {Nu}$ larger than
 $Nu$ by a factor of 1.14.
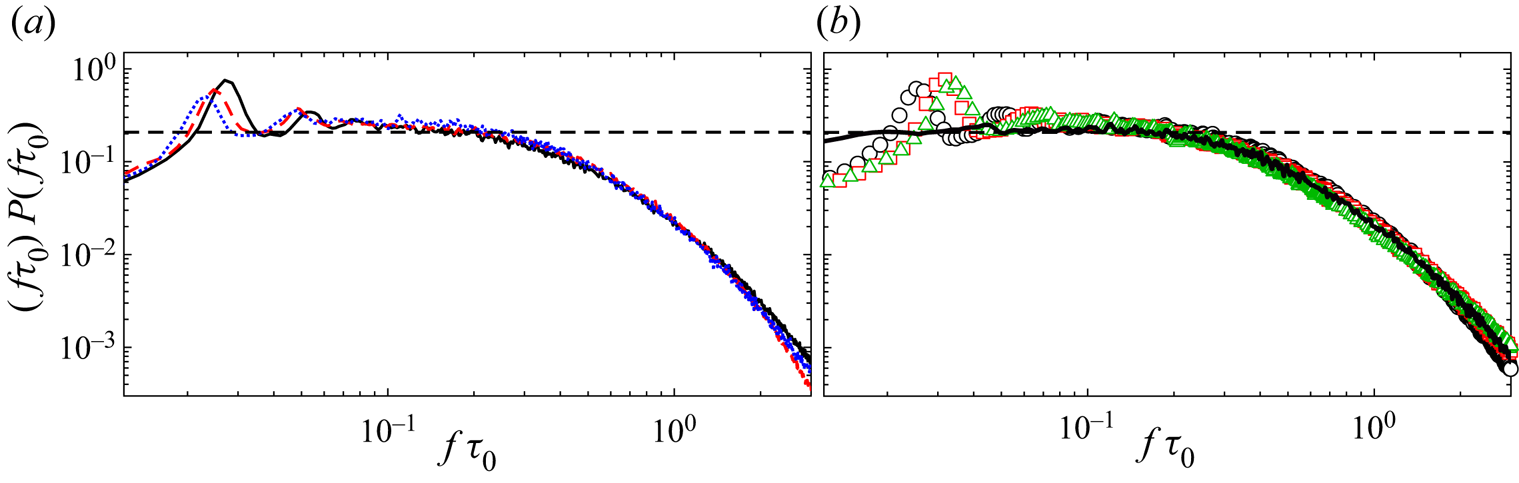
Next we turn to experimental results for  $\varGamma = 1.00$. Figure 3(a) shows the compensated temperature spectra
 $(\,f\tau _0)P(\,f\tau _0)$ as a function of
 $f\tau _0$ measured in the logarithmic layer at the fixed height
 $z/L = 0.0357$ and
 $Ra = 1.35\times 10^{14}$ for different radial locations
 $\xi$. Figure 3(b) shows
 $(\,f\tau _0)P(\,f\tau _0)$ at the fixed height
 $z/L = 0.018$ and
 $\xi = 0.0196$ for several
 $Ra$. It is found that, within their uncertainty, all the spectra fall on the same curve and agree with the universal form measured previously (He et al. Reference He, van Gils, Bodenschatz and Ahlers2014) for
 $\varGamma = 0.50$ (black solid line in figure 3b), except for the peaks in the low-frequency part that change with measuring locations and
 $Ra$. Those peaks are attributed to periodic oscillations of the large-scale circulation (LSC) (see e.g. Qiu & Tong Reference Qiu and Tong2001; Funfschilling & Ahlers Reference Funfschilling and Ahlers2004; Brown & Ahlers Reference Brown and Ahlers2009; He, He & Tong Reference He, He and Tong2010; Wei & Ahlers Reference Wei and Ahlers2016) and contribute less than
 $10\,\%$ to the total power. The model discussed above does not consider the LSC contributions to the spectra.
Reduced spectra  $f\tau _0\times P(\,f\tau _0)$ as a function of
 $f\tau _0$ for
 $\varGamma = 1.00$. (a)
 $z/L = 0.037$ and
 $Ra = 1.35\times 10^{14}$ at radial locations
 $\xi = 0.268$ (blue dotted line),
 $0.064$ (black solid line) and
 $0.0196$ (red dashed line). (b)
 $z/L = 0.018$ and
 $\xi = 0.0106$ at
 $Ra = 1.35\times 10^{14}$ (black circles),
 $1.03 \times 10^{13}$ (red squares) and
 $3.38 \times 10^{12}$ (green triangles). The horizontal dashed lines correspond to
 $P(\,f\tau _0) = P_0 \times (\,f\tau _0)^{-1}$ with
 $P_0 = 0.208$. The black solid line in (b) is a typical spectrum for
 $\varGamma = 0.50$ measured at
 $z/L = 0.0179$,
 $\xi = 0.0178$ and
 $Ra = 1.08 \times 10^{15}$.

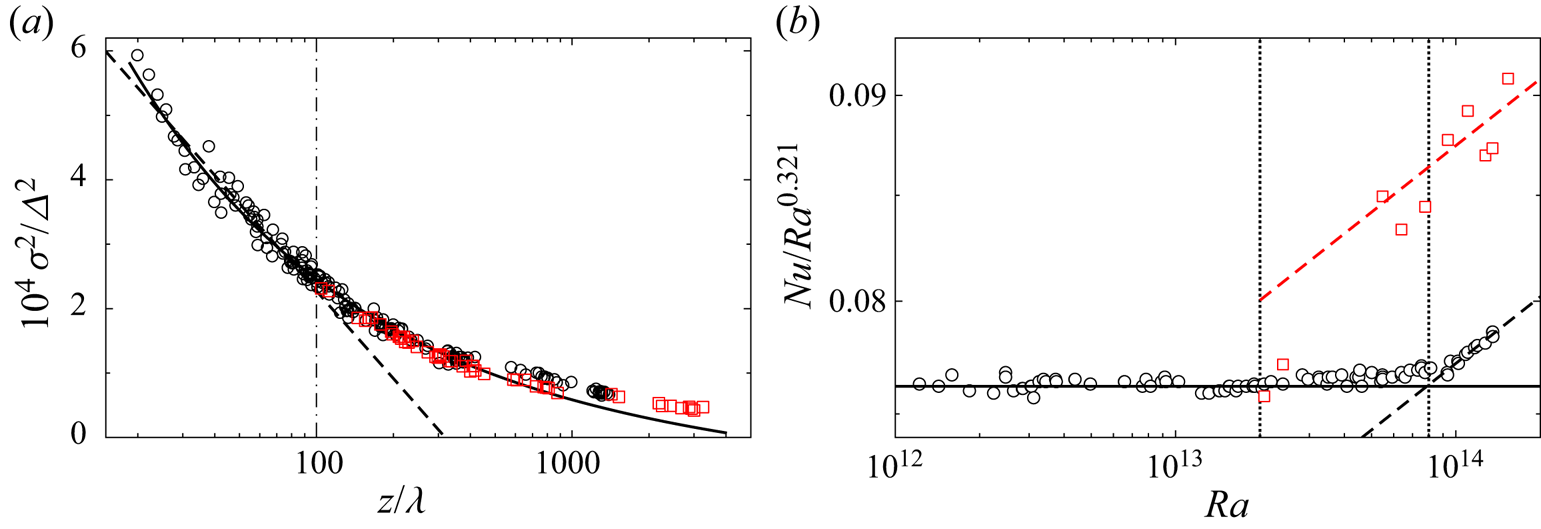
Figure 4(a) shows  $\sigma ^2/\varDelta ^2$ as a function of
 $z/\lambda$ for
 $\xi = 0.0196$. Black circles represent the data for
 $Ra < Ra^*_1 \simeq 2\times 10^{13}$ with
 $\lambda$ calculated from the measured
 $Nu$. As seen in figure 2(a,c) for other
 $\varGamma$, the variance data for
 $\varGamma = 1.00$ also follow the predicted scaling form given by (3.1), but with slightly larger scatter. The scatter reflects the influence from the LSC dynamics on local temperature fluctuations. For
 $Ra > Ra_1^*$ we again replaced
 $Nu$ by
 $\widetilde {Nu}$ to calculate
 $\lambda$, and adjusted
 $\widetilde {Nu}$ so that all the variance data agreed with those for
 $Ra < Ra_1^*$. The results are shown by the red squares. In figure 4(b) we plot the reduced
 $\widetilde {Nu}/Ra^{0.312}$ (red squares) together with measured
 $Nu/Ra^{0.312}$ (black circles) data from He, Bodenschatz & Ahlers (Reference He, Bodenschatz and Ahlers2016) as a function of
 $Ra$. As
 $\varGamma$ increases,
 $Ra^*_1$ does not change much but
 $Ra^*_2$ decreases strongly, thus leading to a smaller transition range between
 $Ra_1^*$ and
 $Ra_2^*$. Above
 $Ra^*_2 \simeq 8\times 10^{13}$, we found that both
 $Nu$ and
 $\widetilde {Nu}$ scale as
 $Ra^{0.375 \pm 0.02}$, consistent with the predicted ultimate-state scaling but with
 $\widetilde {Nu}$ larger than
 $Nu$ by a factor of 1.13.
Results for  $\varGamma = 1.00$. (a)
 $\sigma ^2/\varDelta ^2$ as a function
 $z/\lambda$. Black circles: data for
 $Ra \underset{\smash{\scriptscriptstyle\thicksim}} { < } 2 \times 10^{13} \simeq Ra_2^*$ with
 $\lambda = L/(2Nu)$. The black solid line is the fit of (3.1) to the circles which gave
 $c_1 = -9.41\times 10^{-6}$,
 $c_2 = 4.70\times 10^{-5}$ and
 $c_3 = 2.42\times 10^{-3}$. Red open squares are for
 $Ra \underset{\smash{\scriptscriptstyle\thicksim}} { > } 2\times 10^{13}$ with
 $\lambda$ replaced by
 $\tilde {\lambda } = L/(2 \widetilde {Nu})$ and
 $\widetilde {Nu}$ adjusted to give the best agreement with the black circles. (b)
 $Nu/Ra^{0.321}$ as a function of
 $Ra$. Black circles: measured values. Red squares:
 $\widetilde {Nu}$ from the fit shown in (a). The vertical dotted lines are at
 $Ra_1^*$ and
 $Ra_2^*$. The parallel dashed lines represent the ultimate scaling
 $Nu \propto Ra^{0.375}$ and are plotted so as to pass through the data for
 $Ra > Ra^*_2$.

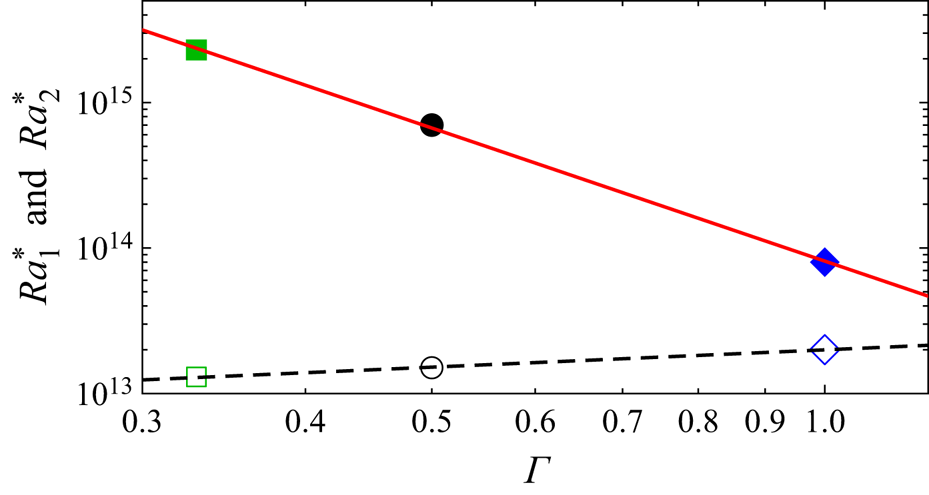
Finally, in figure 5, we summarize the results for the transition values  $Ra_1^*$ and
 $Ra_2^*$ that were derived from the
 $Nu$ measurements. Some of these values were confirmed also by Reynolds number measurements (He et al. Reference He, Funfschilling, Nobach, Bodenschatz and Ahlers2012b, Reference He, van Gils, Bodenschatz and Ahlers2015), measurements of logarithmic temperature profiles in the mixing layer (Ahlers et al. Reference Ahlers, Bodenschatz, Funfschilling, Grossmann, He, Lohse, Stevens and Verzicco2012a) and the azimuthal diffusivity of the LSC (He et al. Reference He, Bodenschatz and Ahlers2016). While there is a slight decrease of
 $Ra_1^*$ with decreasing
 $\varGamma$,
 $Ra_2^*$ increases strongly as
 $\varGamma$ decreases and is described well by
 $Ra_2^* = 8.1\times 10^{13} Ra^{-3.04}$. Thus, for small
 $\varGamma$ there is a relatively wide transition range, while this range apparently vanishes for
 $\varGamma$ just above one. A similar
 $\varGamma$ dependence
 $Ra^* \sim \varGamma ^{-2.5 \pm 0.5}$ was found in cryogenic experiments for
 $Pr \simeq 1.5$ over the range
 $0.23 \leq \varGamma \leq 1.14$ (Roche et al. Reference Roche, Gauthier, Kaiser and Salort2010; Roche Reference Roche2020). However, the values of
 $Ra^*$ (a transition Rayleigh number defined by the authors) are approximately
 $10^3$ times less than
 $Ra^*_2$. The destabilization of the ultimate state implied by the increase of
 $Ra_2^*$ as
 $\varGamma$ decreases can reasonably be attributed to the increasing length of the sidewalls which will tend to depress the turbulent flow in the bulk and thereby reduce the shear experienced by the BLs. It has been called to our attention (D. Lohse, personal communication) that a similar sidewall destabilization of convection occurs near onset where, for
 $\varGamma \underset{\smash{\scriptscriptstyle\thicksim}} { < } 1$, the critical Rayleigh number increases strongly with decreasing
 $\varGamma$ (Charlson & Sani Reference Charlson and Sani1971; Buell & Catton Reference Buell and Catton1983; Müller, Neumann & Weber Reference Müller, Neumann and Weber1984). We do not have an explanation for, and do not understand the origin of, the decrease of
 $Ra_1^*$ with decreasing
 $\varGamma$.
The transition values  $Ra^*_1$ (open symbols) and
 $Ra^*_2$ (filled symbols) of
 $Ra$ as a function of
 $\varGamma$. The black dashed line and red solid line represent the power laws
 $y = ax^b$ with the exponent
 $b = 0.40$ and
 $-3.04$, respectively.

4. Summary
We presented experimental results for the temperature variance  $\sigma ^2(z)$ and the heat transfer
 $Nu$ in RBC samples with aspect ratios
 $\varGamma = 0.33$,
 $0.50$ and
 $1.00$ over the range
 $4 \times 10^{11} \underset{\smash{\scriptscriptstyle\thicksim}} { < } Ra \underset{\smash{\scriptscriptstyle\thicksim}} { < } 5 \times 10^{15}$. In all measurements the Prandtl numbers were kept in the range
 $0.79 \underset{\smash{\scriptscriptstyle\thicksim}} { < } Pr \underset{\smash{\scriptscriptstyle\thicksim}} { < } 0.86$. For
 $Ra < Ra^*_1$, the
 $Nu$ data agree well with the Grossmann–Lohse predictions for the classical state. For a given
 $\varGamma$ the
 $\sigma ^2(z)/\varDelta ^2$ data, when plotted as a function of
 $\lambda = L/(2Nu)$, fall onto a unique curve for
 $20 \underset{\smash{\scriptscriptstyle\thicksim}} { < } z/\lambda \underset{\smash{\scriptscriptstyle\thicksim}} { < } 10^4$. On the basis of the observed universal
 $f^{-1}$ scaling for the temperature spectra in the logarithmic layer (He et al. Reference He, van Gils, Bodenschatz and Ahlers2014), we derived (3.1) for
 $\sigma ^2(z/\lambda )$ that can fit the experimental data over this entire range.
For  $Ra^*_1 \underset{\smash{\scriptscriptstyle\thicksim}} { < } Ra \underset{\smash{\scriptscriptstyle\thicksim}} { < } Ra^*_2$, the measured
 $Nu$ gently increased above the extrapolation of the classical scaling. As
 $\varGamma$ increased, we found that
 $Ra^*_2$ decreased in proportion to
 $\varGamma ^{-3.04}$ while
 $Ra^*_1$ increased very slightly, thus leading to a smaller transition range with increasing
 $\varGamma$. The data then suggest a unique sharp transition to the ultimate state near
 $Ra^* = 2 \times 10^{13}$ for
 $\varGamma \underset{\smash{\scriptscriptstyle\thicksim}} { > } 1.5$.
For  $Ra \underset{\smash{\scriptscriptstyle\thicksim}} { > } Ra^*_2$, we found
 $Nu \propto Ra^{\gamma }$ with an effective exponent
 $\gamma \simeq 0.38$ consistent with the predictions for the ultimate regime. In this range
 $\sigma ^2/\varDelta ^2$ deviated from the unique curve obtained for
 $Ra < Ra_1^*$ when
 $\lambda$ was based on an extrapolation of
 $Nu$ from the classical regime. The data could be brought onto that curve when
 $\lambda$ was replaced by
 $\tilde \lambda = L/(2 \widetilde {Nu})$ and
 $\widetilde {Nu}$ was adjusted. The
 $Ra$ dependence of the resulting
 $\widetilde {Nu}$ also agreed well with the predicted scaling for the ultimate state, but with
 $\widetilde {Nu}$ larger than
 $Nu$ by factors of 1.13, 1.09 and 1.14 for
 $\varGamma = 1.00, 0.50$ and
 $0.33$, respectively.
Acknowledgements
We thank A. Kopp, A. Kubitzek, H. Nobach and A. Renner for their enthusiastic technical support.
Funding
We are grateful to the Max-Planck-Society and the Volkswagen Stiftung, whose generous support made the establishment of the facility and the experiments possible. We thank the Deutsche Forschungsgemeinschaft (DFG) for financial support through SFB963: ‘Astrophysical Flow Instabilities and Turbulence’. X.H. acknowledges the support of the National Natural Science Foundation of China (grant nos. 11772111 and 91952101), the Natural Science Foundation of Guangdong Province (grant no. 2020A1515011094), the Science and Technology Innovation Commission of Shenzhen (grant no. KQJSCX20180328165817522) and the Max Planck Partner Group.
Declaration of interest
The authors report no conflict of interest.