Implications
The replacement of fish oil in aquaculture diets by vegetable oils is a common practice to counteract the trend of finite fish oil resources. A drawback of this practice is a reduction in product quality, especially of n-3 fatty acids. Bioactive phytochemicals might improve vegetable diets for fish. In this study, resveratrol (RV) and genistein (G) were evaluated for their effects on rainbow trout growth, nutrient utilization, body composition and fatty acid (FA) composition. The impairment of feed intake and growth caused by RV and G overweighs other positive effects and discourages their use in diets for farmed rainbow trout.
Introduction
Over the past years, the amount of fish oil used in aquaculture production has decreased mainly due to the increasing demand of fish oil for human consumption as well as increasing market prices (Shepherd and Jackson, Reference Shepherd and Jackson2013). The common practice in aquaculture to manage this imbalance is the substitution of fish oil with vegetable oils in aqua feeds. This practice does not necessarily affect the fish growth and performance, but most likely reduces n-3 long chain polyunsaturated fatty acid (n-3 LC-PUFA) levels in the end product provided to the consumer (Shepherd and Jackson, Reference Shepherd and Jackson2013; de Roos et al., Reference de Roos, Sneddon, Sprague, Horgan and Brouwer2017). Fish and fish-derived products, like fish oil, are beneficial for human health in relation to the high amounts of the n-3 LC-PUFAs EPA (20:5n-3) and DHA (22:6n-3), among other reasons (Molendi-Coste et al., Reference Molendi-Coste, Legry and Leclercq2011). Thus, a main goal in fish nutrition is to maintain fish n-3 LC-PUFA levels as high as possible to ensure good fish performance, fish health and a high product quality (Tocher, Reference Tocher2015). An interesting approach in this context is the use of plant-derived functional and bioactive phytochemicals, which might be potentially useful complements for fish oil replacement in aqua feeds.
In our previous study, we have demonstrated that the grape-derived stilbene RV increases the relative n-3 LC-PUFA levels in rainbow trout (Oncorhynchus mykiss) most likely via an increased production of the hepatic enzyme ∆6-desaturase (Torno et al., Reference Torno, Staats, de Pascual-Teresa, Rimbach and Schulz2017). The phytoestrogen G, a major bioactive component in soybean, might affect the lipid metabolism in fish (Cleveland and Manor, Reference Cleveland and Manor2015) and modulate the expression of genes encoding proteins centrally involved in FA synthesis (Schiller Vestergren et al., Reference Schiller Vestergren, Trattner, Mráz, Ruyter and Pickova2011). This indicates that G might potentially increase the amount of LC-PUFAs in fish, making it an interesting target phytochemical for fish nutrition studies. However, our previous study indicates that RV might possibly impair fish growth (Torno et al., Reference Torno, Staats, de Pascual-Teresa, Rimbach and Schulz2017). In addition, G is discussed as an anti-nutritional factor likely to impair fish growth and performance (Francis et al., Reference Francis, Makkar and Becker2001). In human nutrition, the use of RV and G in obesity and BW management has been discussed (Rupasinghe et al., Reference Rupasinghe, Sekhon-Loodu, Mantso and Panayiotidis2016). Since RV and G are currently investigated as potential complements for fish oil replacement in aqua feeds, further research on their effects on fish growth, performance and nutrient utilization is indispensable. Thus, the aim of this study was to evaluate the effects of dietary RV and G in rainbow trout on (1) growth, (2) performance and nutrient utilization parameters and (3) whole body composition, including the nutrient and FA composition. We further investigated whether the dietary fish oil level played a role in the response of the investigated parameters.
Material and methods
Experimental diets
In total, six different experimental diets (isonitrogenous and isoenergetic) were formulated as shown in Table 1. All diets consisted of mainly alternative plant protein sources and had a fish meal content of 10% dry matter (DM). Diet F4 contained 4% DM fish oil and 5.93% DM of a mixture of vegetable oils (linseed oil, rapeseed oil and sunflower oil). F4 served as overall reference diet. Diet F0 completely lacked fish oil (0% DM) and contained 9.93% DM of linseed oil and rapeseed oil. The diets contained considerably different amounts of the FAs EPA (20:5n-3), DHA (22:6n-3) and α-linolenic acid (ALA, 18:3n-3) as shown in Table 2. Basal diet F4 was formulated to meet the recommended dietary levels of ALA, EPA and DHA for rainbow trout (EPA+DHA: 0.4% to 0.5% of dry diet and ALA: 0.7% to 1.0 % of dry diet (National Research Council (NRC), 2011)). Basal diet F0 was formulated to meet ALA requirements, but contained amounts of EPA and DHA below the recommended dietary levels for rainbow trout. Diets F4+RV and F4+G were formulated equal to the basal diet F4 but supplemented with RV (+RV; trans-3,4′,5-trihydroxy stilbene, purity⩾98%; Chemos GmbH & Co. KG, Regenstauf, Germany) or G (+G; 5,7-dihydroxy-3-(4-hydroxyphenyl)-(4H)-benzopyran-4-one, purity ≥98%; Chemos GmbH & Co. KG)) at 0.3% DM of diet, respectively. The same applied for diets F0+RV and F0+G and the basal diet F0, respectively. All diets were formulated based on the macronutrient and the amino acid requirements of rainbow trout according to Rodehutscord et al. (Reference Rodehutscord, Becker, Pack and Pfeffer1997) and NRC (2011). All diets were pressed into 4-mm pellets using a feed press L14-175 (Amandus Kahl, Reinbek, Germany).
Ingredients and nutrient composition (percent of dry matter: % DM) of the experimental rainbow trout diets

F4 and F0 are the basal diets, +RV and +G indicate supplementation of basal diets with 0.3% DM resveratrol or genistein, respectively.
The nutrient composition is given as mean value of a double measurement from one sample (n=1).
1 Vereinigte Fischmehlwerke Cuxhaven GmbH & Co. KG, Cuxhaven, Germany.
2 SOYAFINE 200; EURODUNA Rohstoffe GmbH, Barmstedt, Germany.
3 Gustav Ehlert GmbH & Co. KG, Verl, Germany.
4 GoldMehl ®FM; GePro Geflügel-Protein Vertriebsgesellschaft mbH & Co. KG, Diepholz, Germany.
5 Blood meal; Sonac, Son, Netherlands.
6 Emsland-Stärke GmbH, Emlichheim, Germany.
7 KRÖNER STÄRKE GmbH, Ibbenbüren, Germany.
8 Makana Produktion und Vertrieb GmbH, Offenbach a.d.Queich, Germany.
9 Different food stores, Büsum, Germany.
10 Emsland-Aller Aqua GmbH, Golßen, Germany.
11 Biolys; Evonik Industries AG, Essen, Germany.
12 J. Rettenmaier und Söhne GmbH und Co. KG, Rosenberg, Deutschland.
13 Bentonite: Del Lago Bentonite, Castiglioni Pes y Cía., Buenos Aires, Argentina.
14 CHEMOS GmbH & Co. KG, Regenstauf, Germany.
15 Total carbohydrates=1000−(CP+crude fat+crude ash).
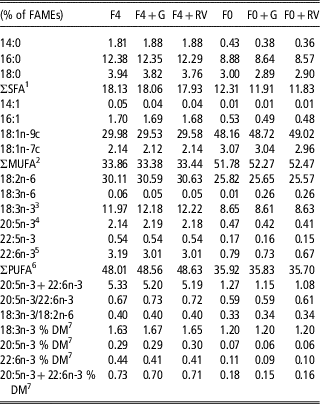
Fatty acid composition (percentage of total fatty acid methyl esters (% of FAMEs) and % of dry matter (DM) of diet) of the experimental rainbow trout diets

F4 and F0 are the basal diets with 4% DM and 0% DM fish oil, +RV and +G indicate supplementation of basal diets with 0.3% DM resveratrol or genistein, respectively.
Values are means of a double measurement from one sample (n=1).
1 ∑SFA is the sum of saturated fatty acids.
2 ∑MUFA is the sum of monounsaturated fatty acids.
3 18:3n-3:α-Linolenic acid (ALA).
4 20:5n-3: EPA.
5 22:6n-3: DHA.
6 ∑PUFA is the sum of n-3 and n-6 polyunsaturated fatty acids.
7 Fatty acids in % DM of diet were calculated based on 13:0 methyl ester as the internal standard and amount of lipid in the diet (Table 1).
Experimental setup
The study was conducted at the facilities of the Gesellschaft für Marine Aquakultur (GMA) mbH in Büsum, Germany. A total of 306 juvenile rainbow trout (Forellenzucht Trostadt GbR, Trostadt, Germany) were acclimated with a commercially available trout feed for 1.5 months in a recirculating aquaculture system (RAS). The RAS (7.6 m3, turnover rate 4 times/h) was equipped with a moving bed bio filter, an additional bead filter (PolyGeyser, Model DF-6; Aquaculture Systems Technologies, LLC, New Orleans, LA, USA) and an UV-light disinfection system. The light regime was set at 14:10 h light:dark cycle during the whole adaptation and the experimental period. The water quality parameters were determined daily and maintained in a suitable range for rainbow trout (7.54 pH, 18.5±0.7°C, 7.84±0.3 mg/l O2, 84.97±3.22% O2, 0.3±0.2 mg/l NH4, 1.3±0.7 mg/l NO2, 2.5±1.1‰ PSU). Before the experimental start, the acclimated rainbow trout (initial BW: 81.6±0.5 g) were stocked in six triplicate groups of 17 individuals in 18 tanks (150 l) of the RAS. During the experimental period lasting 8 weeks, the fish were fed manually twice per day until apparent satiation. Uneaten pellets were recollected from the tanks after each feeding for the calculation of the daily feed intake (DFI).
Sampling
Tissue samples (blood, liver and whole body) were collected before the onset (day 0, initial) and at the end of the feeding trial (day 62). At day 0, five individuals were sacrificed (pooled sample) and stored at −20°C for the determination of the whole body nutrient composition and the whole body FA composition. At day 62, three individuals per tank were sacrificed (pooled samples) and stored at −20°C for the same analysis. Blood was collected for the determination of the haematocrit (HK) using micro HK tubes (diameter=1.15±0.05 mm; Brand GmbH+Co KG, Wertheim, Germany). Haematocrit was determined in a triple approach per individual and five individuals per tank. Individual weight (±0.01 g), length (±0.1 cm) and liver weight (±0.0001 g) were determined from five individuals per tank for the calculation of the Fulton condition factor (FCF) and the Hepatosomatic index (HSI). Based on an additional group weighing of all individuals from each tank, growth, performance and nutrient utilization parameters (specific growth rate (SGR), feed conversion ratio (FCR), protein efficiency ratio (PER) and protein productive value (PPV)) were calculated (see formulas in Table 3).
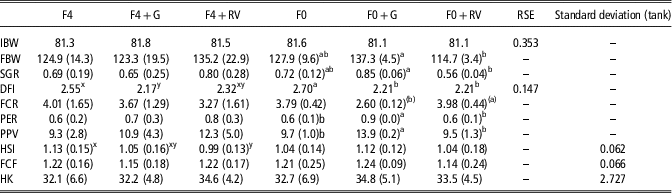
Growth, performance and nutrient utilization parameters of rainbow trout fed with the experimental diets for 8 weeks

IBW=initial BW (g); FBW=final BW (g); SGR=specific growth rate (%/day)=(ln (FBW)−ln (IBW))/feeding day×100; DFI=daily feed intake (%/day); FCR=feed conversion ratio=feed intake (g)/weight gain (g); PER=protein efficiency ratio=weight gain (g)/protein intake (g); PPV=protein productive value (%)=100×((final body protein×final BW)−(initial body protein×IBW))/(protein intake); HSI=hepatosomatic index (%)=(liver weight/FBW)×100; FCF=Fulton condition factor=100×(FBW×final body length−3); HK=haematocrit (%); RSE=residual standard error.
F4 and F0 indicate feeding of the basal diets (4% DM) and 0% DM fish oil; +RV and +G indicate feeding groups that were fed diets supplemented with resveratrol or genistein (0.3% DM), respectively.
a,bMean values (n=3, based on a group weighing of all 17 individuals from one tank; HSI and FCF: n=15, consisting of five individuals from each of three tanks; HK: n=12, consisting of four individuals from each of three tanks) with different superscript letters within one row significantly differ based on ANOVA followed by post hoc tests (P-values<0.05) as described in Materials and Methods section.
x,ySuperscript letters indicate the output based on comparisons of phytochemical type within one fish oil inclusion group (a, b: F0 diets; x, y: F4 diets).
(a),(b)Superscript letters in brackets indicate a tendency towards a statistical difference based on a P-value<0.1.
The RSE are given based on the statistical model used for each parameter: group-RSE (in brackets behind each group) when a statistical model based on generalized least squares (gls) was used; RSE for all groups together when a linear model (lm) was used; standard deviation explaining the tank variation additionally to the group-RSE when a mixed model (lme) with tank as random factor was used (see Material and Methods).
Nutrient composition analysis
The nutrient composition was determined in all experimental diets and the whole body homogenates of the rainbow trout. First, frozen whole body samples were freeze-dried (Alpha 1-2 LDplus and Alpha 1-4 LSC; Martin Christ Gefriertrocknungsanlagen GmbH, Osterode am Harz, Germany) until the weight was stable. All samples were homogenized using a cutting mill (GM 200; Retsch, Haan, Germany) or mortar and pestle and stored at 4°C. Analysis of DM, crude ash, CP, crude lipid, total carbohydrates and gross energy was done according to EU guideline (EC) 152/2009 (European Union, 2009). For the determination of DM, the homogenized samples were dried at 103°C in a drying oven until the weight remained stable. Ash content was determined after 4 h incineration at 550°C in a combustion oven (P300; Nabertherm, Lilienthal, Germany). The Kjeldahl method (InKjel 1225 M, WD30; Behr, Düsseldorf, Germany) was used for the determination of the CP content (nitrogen×6.25). The crude lipid content was quantified following extraction with petroleum ether in a Soxleth extraction system (Soxtherm, Hydrotherm; Gerhardt, Königswinter, Germany). The diet samples were hydrolyzed with hydrochloric acid before the lipid extraction. Gross energy was measured using a bomb calorimeter (C 200; IKA, Staufen, Germany). Total carbohydrates were calculated according to the formula in Table 1.
Lipid extraction and fatty acid measurement
The extraction of total lipids from the whole body homogenates and the diet samples was done according to Folch et al. (Reference Folch, Lees and Sloane Stanley1957) and the measurement of FA methyl esters (FAMEs) was performed using a gas chromatograph with flame ionization detector (Agilent Technologies, Santa Clara, CA, USA). A detailed description is given in Torno et al. (Reference Torno, Staats, de Pascual-Teresa, Rimbach and Schulz2017). FAME standards (13 FAMEs, see Table 2) were used to identify the retention times of the individual FAMEs. Fatty acid composition was calculated as a percentage of single FAME relative to total FAMEs. Fatty acids as %DM of diet were calculated using 13:0 methyl ester as the internal standard.
Statistical analysis
All statistical analysis was performed using R (version 3.1.3) with an RStudio interface. The packages gdata, multcomp, gplots, nlme, SimComp and car were used for the graphical and the statistical analysis. The data evaluation started with the definition of an appropriate statistical model based on a graphical residual analysis of the data: (1) statistical model based on generalized least squares (gls) for normally distributed and heteroscedastic data (final BW (FBW), FCR, SGR, PER and PPV); (2) linear model (lm) for normally distributed and homoscedastic data (DFI, IBW, whole body composition and FA composition); (3) mixed model (lme) for non-normally distributed data (FCF, HSI and HK). All models included the level of dietary fish oil content (4% and 0%) and phytochemical (None, RV, G), as well as their interaction term and lme additionally included tank as random factor. An ANOVA was conducted followed by an appropriate post hoc test: (1) ANOVA based on gls was followed by multiple contrast tests for heteroscedastic data according to Hasler & Hothorn (Reference Hasler and Hothorn2008); (2) ANOVA based on lm was followed by multiple contrast tests (Schaarschmidt and Vaas, Reference Schaarschmidt and Vaas2009); (3) ANOVA based on lme was followed by multiple contrast tests for relative effects (Schaarschmidt and Vaas, Reference Schaarschmidt and Vaas2009).
Results
Resveratrol and genistein affected growth, performance and nutrient utilization
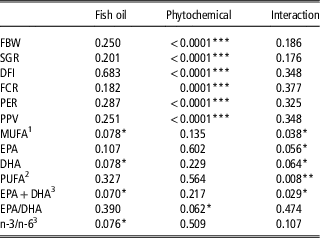
The overall growth of the fish was rather poor (between 41% and 69% weight increase) over the 8 weeks feeding trial with SGR under 0.85%/day and FCR above 2.6 (both F0+G; Table 3). Fish fed the diets with 0% DM fish oil exhibited the strongest response to dietary RV and G as far as growth, performance and nutrient utilization parameters are concerned (Table 3). The FBW and SGR were significantly higher in fish fed the F0+G diet in comparison to F0+RV (P<0.05; Table 3, indicated by letters a, b), but not in comparison to the F0 fed controls. The PER and PPV were generally low (PER<0.9 and PPV<13.9%; both F0+G), but significantly elevated in the fish fed the F0+G diet compared with fish that received the F0 and F0+RV diets (P<0.05; Table 3, indicated by letters a, b). Throughout the whole experimental period, RV and G administration significantly lowered the DFI in comparison to ingestion of both the basal diet F4 and F0, respectively. The HSI was significantly reduced in the F4+RV fed group in comparison to the F4 fed control (P<0.05; Table 3, indicated by letters x, y). The FCF and the HK remained largely unaffected by the dietary treatments. The evaluation of the statistical significance of effects revealed that the effects on FBW, SGR, DFI, FCR, PER and PPV, though more pronounced in fish fed F0-based diets, can be primarily assigned to the dietary phytochemicals RV and G. The dietary fish oil level per se did not alter the outcome of the abovementioned parameters (Table 4).
P-values from the ANOVAs conducted on the effects of different experimental diets on selected performance parameters and fatty acid composition of rainbow trout at the end of the 8-week feeding trial

FBW=final BW; SGR=specific growth rate; DFI=daily feed intake; FCR=feed conversion ratio; PER=protein efficiency; PPV=protein productive value.
The table shows the statistical significance of effects caused by dietary fish oil level, dietary phytochemical supplementation and the interaction of both (dietary fish oil level and phytochemical supplementation).
Statistical significant differences are indicated as: *P<0.05, **P<0.01, ***P<0.001 and (*) for a tendency towards statistical difference based on a P-value<0.1.
1 MUFA is the sum of all monounsaturated fatty acids.
2 PUFA is the sum of n-3 and n-6 polyunsaturated fatty acids.
3 n-3/n-6 is the ratio between all n-3 fatty acids and all n-6 fatty acids measured.
Dietary treatment only slightly affected the body composition
The whole body composition of the rainbow trout marginally differed between the dietary treatments at the end of the feeding trial (Table 5). Crude ash was significantly elevated in fish fed the F0+G and F0+RV diets compared with their F0 fed counterparts (P<0.05; Table 5, indicated by letters a, b). Furthermore, trout fed the F0+RV diet displayed a slightly increased crude ash content in comparison to the F4+RV fed group (P<0.05; Table 5, indicated by letters A, B). Crude lipid slightly tended to a reduction in the F0+RV group compared with the F0 group (P<0.1; Table 5, indicated by (a), (b)). All other parameters investigated remained unaffected by the dietary treatments.
Body composition (percentage of original matter (% OM) or MJ/kg OM) of whole body homogenates of rainbow trout at the beginning (initial) and the end of an 8-week feeding trial

RSE=residual standard error.
F4 and F0 represent results that were obtained from fish fed the basal diets containing 4% and 0% DM fish oil. Supplementation of diets with resveratrol and genistein is indicated by +RV and +G (0.3% DM), respectively.
a,bMean values (n=3, consisting of a pooled sample of three fish from each of three tank; initial n=1, consisting of a pooled sample of five fish) and RSE based on a linear model (lm) and ANOVA as described in Materials and Methods section.
A,BSuperscript letters indicate the output of the post hoc tests (P-values<0.05) based on comparisons of phytochemical type within one fish oil inclusion group (a, b: F0 diets) or fish oil level within one phytochemical supplementation group (A, B: +RV diets).
(a),(b)Brackets indicate a tendency towards a statistical difference based on a P-value<0.1.
Dietary treatment affected whole body fatty acid composition
The FA composition of the experimental diets was equally altered in the basal diets (F4 and F0) and in the corresponding supplemented diets (+RV and +G, Table 2). The amounts of saturated FA (SFA) and PUFA were reduced in the diets with 0% DM fish oil (F0, F0+G, and F0+RV), whereas the amount of monounsaturated FA (MUFA) was increased. Most importantly, the amounts of EPA+DHA were reduced from ~0.72% DM (F4 diets) to ~0.16% DM (F0 diets, Table 2).
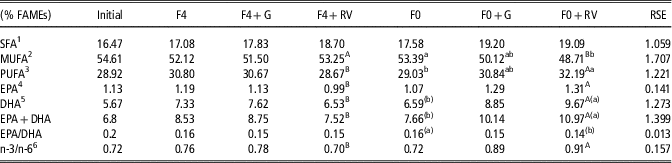
The FA compositions of the whole body homogenates of rainbow trout were neither significantly modified by altering the dietary fish oil level (group F4 in comparison to group F0) nor by dietary administration of G (Table 6). The relative amounts of EPA, DHA, EPA+DHA and PUFA significantly increased in fish fed the diet F0+RV in comparison to F4+RV, whereas the amounts of MUFA decreased (P<0.05; Table 6, indicated by letters A, B). Thus, in the RV-treated individuals, the tissue EPA+DHA levels were significantly increased from 7.52% FAMEs (F4+RV) to 10.97% FAMEs (F0+RV, P<0.05; Table 6, indicated by letters A, B). Hence, the ratio of n-3/n-6 LC-PUFA was significantly elevated in fish fed the F0+RV diet in comparison to the F4+RV fed fish (P<0.05; Table 6, indicated by letters A, B).
Fatty acid composition (percentage of total fatty acid methyl esters (% FAMEs)) of whole body homogenates of rainbow trout before (initial) and at the end of the feeding trial

RSE=residual standard error.
F4 and F0 represent results that were obtained from fish fed the basal diets containing 4% and 0% dry matter (DM) fish oil. Supplementation of diets with resveratrol and genistein is indicated by +RV and +G (0.3% DM), respectively.
a,bMean values (n=3, consisting of a pooled sample of three fish from each of three tanks; initial n=1, consisting of a pooled sample of five fish) and RSE based on a linear model (lm) and ANOVA as described in Materials & Methods section.
A,BSuperscript letters indicate the output of post hoc tests (P-values<0.05) based on comparisons of phytochemical type within one fish oil inclusion group (a, b: F0 diets) or dietary fish oil level within one phytochemical supplementation group (A, B: +RV diets).
(a)(b)Brackets indicate a tendency towards a statistical difference based on a P-value<0.1.
1 SFA is the sum of saturated fatty acids.
2 MUFA is the sum of monounsaturated fatty acids.
3 PUFA is the sum of n-3 and n-6 polyunsaturated fatty acids.
4 EPA:20:5n-3.
5 DHA:22:6n-3.
6 n-3/n-6 is the ratio between all n-3 fatty acids and all n-6 fatty acids measured.
Moreover, RV supplementation to the F0 diet (F0+RV) significantly affected the FA composition of rainbow trout in comparison to sole F0 feeding. The amount of MUFA was significantly reduced in fish fed diet F0+RV than in fish fed diet F0 (P<0.05; Table 6, indicated by letters a, b). The relative amounts of PUFA were significantly higher in fish fed the F0+RV diet (32.19% FAMEs) than in fish fed the F0 diet (29.03% FAMEs, P<0.05; Table 6, indicated by letters a, b). In addition, the amounts of EPA, DHA and EPA+DHA tendentially increased in the fish fed the F0+RV diet in comparison to F0 fed fish (P<0.1; Table 6). The relative levels of PUFA and EPA+DHA were significantly affected by the interaction of the dietary fish oil level and RV supplementation and not the single factors per se, as proven by the evaluation of the statistical significance of effects (Table 4).
Discussion
This study revealed that the DFI was significantly impaired by both, dietary RV and G, which presumably led to the impairment of other parameters. Possibly, the acceptance of supplemented diets was reduced by the sensory impact of the phytochemicals, which has been described for feed additives in various fish species (Francis et al., Reference Francis, Makkar and Becker2001). It is well known that RV and G may act as anti-nutritional factors by reducing the appetite or affecting the taste of the feed (bitterness and astringency), thereby resulting in lower feed and thus energy intake (Kim et al., Reference Kim, Nelson-Dooley, Della-Fera, Yang, Zhang, Duan, Hartzell, Hamrick and Baile2006; Nakata et al., Reference Nakata, Takahashi and Inoue2012). Though the feed intake in G-fed fish was reduced, the utilization of protein (PER and PPV) was significantly enhanced, leading to growth rates comparable to the control-fed groups (Table 3). Estrogen-like secondary plant compounds can affect growth and other physiological parameters in fish depending on the species or developmental stage investigated (Cleveland and Manor, Reference Cleveland and Manor2015; Pastore et al., Reference Pastore, Negrato, Poltronieri, Barion, Messina, Tulli, Ballarin, Maccatrozzo, Radaelli and Bertotto2018). Possibly, the estrogenic properties of G might have caused the slight alterations in nutrient utilization and growth as observed within this study. Depending on the dose administered, RV and G might exhibit either beneficial or detrimental bioactivity in animals (Francis et al., Reference Francis, Makkar and Becker2001; Mukherjee et al., Reference Mukherjee, Dudley and Das2010). Results from our study indicate that the use of 0.3% DM of G has no significant beneficial effect on the fish growth and performance. In contrast, 0.3% DM of RV led to impaired growth parameters under the given experimental conditions. The use of the pure phytochemical RV in the fish oil free diet F0+RV revealed negative effects on the growth performance (FBW and SGR) and nutrient utilization (FCR) in comparison to the F0 fed control fish.
Different mechanisms of how RV possibly reduces the nutrient utilization and the growth rate are currently discussed (Rupasinghe et al., Reference Rupasinghe, Sekhon-Loodu, Mantso and Panayiotidis2016). Polyphenols might form polyphenol-protein-complexes that shield the proteins from digestion (Stojadinovic et al., Reference Stojadinovic, Radosavljevic, Ognjenovic, Vesic, Prodic, Stanic-Vucinic and Cirkovic Velickovic2013) and thus may impair nutrient availability and growth. Furthermore, polyphenols have been shown to inhibit the activity of proteases, pepsin and trypsin and lipases (McDougall et al., Reference McDougall, Kulkarni and Stewart2008; Ozdal et al., Reference Ozdal, Capanoglu and Altay2013; Stojadinovic et al., Reference Stojadinovic, Radosavljevic, Ognjenovic, Vesic, Prodic, Stanic-Vucinic and Cirkovic Velickovic2013), thereby reducing the digestibility of macronutrients. In this study, RV-treated fish had a slightly lower body lipid level compared with controls (Table 5), which might indicate an interaction of RV with the lipid metabolism of rainbow trout. An interaction of RV with the sirtuin pathway and the AMP-activated protein kinase seems likely (Zang et al., Reference Zang, Xu, Maitland-Toolan, Zuccollo, Hou, Jiang, Wierzbicki, Verbeuren and Cohen2006; Ajmo et al., Reference Ajmo, Liang, Rogers, Pennock and You2008). Furthermore, RV-rich wine lees lead to a reduction of lipid content in zebra fish (Danio rerio) embryos (Caro et al., Reference Caro, Sansone, Amézaga, Navarro, Ferreri and Tueros2017). Own investigations revealed that RV and G both potentially reduce the digestibility of crude lipid and gross energy (Torno et al., Reference Torno, Staats, Rimbach and Schulz2018) and thus might have led to the reduced lipid content and impaired growth rates of the experimental fish in the current study. Though exact underlying cellular and molecular mechanisms were beyond the scope of this study, a slight lipid-lowering effect of dietary RV can solely be assumed.
The reduction of dietary fish oil from 4% DM to 0% DM did not affect the growth and performance parameters of rainbow trout, which is in accordance with the common and commercially applied practice of fish oil replacement (Lazzarotto et al., Reference Lazzarotto, Corraze, Leprevost, Quillet, Dupont-Nivet and Médale2015). Nevertheless, the overall growth, performance and nutrient utilization of the fish were rather poor in this study (Table 3). The DFI in this study was adequate (>2.21%/day), but in combination with poor FCR (>2.6) led to low SGR below estimations (>3%/day by Austreng et al. (Reference Austreng, Storebakken and Åsgård1987)). Furthermore, PER and PPV values were rather low and did not reach values as reported in other studies (PER>1.04 (Steffens, Reference Steffens1981)) or indicated by the National Research Council (PPV ~31% (NRC (2011)). An impairment of growth, FCR and protein utilization caused by diets rich in plant-derived components has been previously observed (Drew et al., Reference Drew, Ogunkoya, Janz and Van Kessel2007). We assume that especially the poor performance of the control fed fish indicated an additional systemic effect, which led us to an early termination of the experiment. From experience with bioactive compounds previously used in the RAS from our facility, we may assume that a possible accumulation of RV and G in the holding water might have affected the overall performance of fish in the RAS. Both phytochemicals have a rather low bioavailability and might thus be excreted into the holding water in significant amounts (Walle et al., Reference Walle, Hsieh, Delegge, Oatis and Walle2004; Gontier-Latonnelle et al., Reference Gontier-Latonnelle, Cravedi, Laurentie, Perdu, Lamothe, Le Menn and Bennetau-Pelissero2007).
In this study, the EPA+DHA levels in the diets were reduced from 0.72% DM (F4) to 0.16% DM (F0), which is below the suggested amount of 0.4% to 0.5% DM (NRC (2011)). Simultaneously, the total n-3 LC-PUFA levels in the fish were similar between F4 and F0 fed animals, thus indicating the previously described active in vivo LC-PUFA metabolism in trout (Gregory et al., Reference Gregory, Collins, Tocher, James and Turchini2016) when the dietary supply of EPA and DHA is insufficient. Furthermore, dietary RV led to a decrease of MUFA and an increase of PUFA and EPA+DHA content in the whole body of the fish. The amounts of EPA+DHA were increased by ~29% and 19% (F0+RV and F0+G, respectively) in comparison to the F4 fed control (Table 6). When the phytochemicals were supplemented to diets containing 4% DM fish oil, no difference in FA composition was observed. Thus, the increase in LC-PUFA levels was not solely caused by the phytochemical per se, but the interaction of the elimination of dietary fish oil and simultaneous administration of the phytochemical (Table 4). A similar effect was observed in our previous study, where RV only enhanced the hepatic enzyme production of the ∆6-desaturase, a key enzyme in LC-PUFA synthesis, when trout were fed diets lacking fish oil (Torno et al., Reference Torno, Staats, de Pascual-Teresa, Rimbach and Schulz2017). A bidirectional interaction of RV with the lipid metabolism of zebra fish has been recently investigated (Ran et al., Reference Ran, Ying, Li, Yan, Yi, Ying, Wu and Ye2017). The n-3 LC-PUFA enhancing effects of RV could be additionally mediated through a direct impact on other elongases and desaturases in the FA synthesis (Momchilova et al., Reference Momchilova, Petkova, Staneva, Markovska, Pankov, Skrobanska, Nikolova-Karakashian and Koumanov2014). This mechanism might only be of importance when the endogenous FA synthesis is enhanced in the case of insufficient dietary EPA and DHA supply (Gregory et al., Reference Gregory, Collins, Tocher, James and Turchini2016). The results obtained in this study indicate that RV might be used as a complement for fish oil replacement in terms of modulation of the FA composition of rainbow trout. Furthermore, we were not able to identify significant LC-PUFA enhancing properties of G in rainbow trout.
The assessment of the statistical significance of the effects observed in this study revealed that the phytochemicals significantly affected growth, performance and nutrient utilization (Table 4). The FA composition of rainbow trout was modified by the interaction of the phytochemical RV and the dietary fish oil level. It has been reported that rainbow trout can compensate for the lacking dietary fish oil and lacking dietary n-3 LC-PUFA in a way that the performance remains unaffected (Lazzarotto et al., Reference Lazzarotto, Corraze, Leprevost, Quillet, Dupont-Nivet and Médale2015). In this study, effects of RV on fish growth and performance were only present, when the fish diet completely lacked EPA and DHA (F0 diets). This indicates that the fish oil free diet in combination with the applied concentration of RV challenged the trout beyond their ability to cope with one of both factors.
In conclusion, dietary G exhibited only a slight capability, if any, to affect the growth, performance and n-3 LC-PUFA levels, indicating lacking profitable use in rainbow trout production. Dietary RV led to a significant increase of PUFA and n-3/n-6 ratio in rainbow trout tissue, but adversely affected the growth and the nutrient utilization. A general impairment of the overall fish performance as observed in this study suggests careful considerations regarding the used concentration as well as the potential accumulation of phytochemicals in recirculating systems. The impairment of growth and production parameters overweighs the positive effects of RV and discourages its use in rainbow trout diets.
Acknowledgements
This Article constitutes part of the PhD thesis of Claudia Torno. This work was supported by the DFG – Deutsche Forschungsgemeinschaft (grant nos: RI 884/8-1; SCHU 2308/4-1). The authors would like to thank Michael Schlachter, Laura Schynawa and Petra Rettmann for practical assistance during the trial and in the lab. Furthermore, the authors would like to thank the whole GMA-team for all their support. We are grateful to the Analysis Service Unit facilities of ICTAN for the GC-FID analysis and Spanish Ministerio de Economía, Industria y Competitividad for grant AGL2016-76832-R. Furthermore, the authors are grateful towards Mario Hasler for the statistical advice.
Declaration of interest
None.
Ethics statement
All experiments were carried out according to the EU Directive 2010/63/EU for animal experiments and approved by the Ministry of Energy, Agriculture, the Environment, Nature and Digitalization (MELUND), Kiel, Germany (approved on 15 October 2014; project number: V244-7224.121.9-34).
Software and data repository resources
None of the data sets were deposited in an official repository.