I. THEORY
Graphene was predicted to support a transverse electric (TE) mode, which is not present in a 2D system with parabolic dispersion relation. Considering transverse magnetic (TM) mode in the geometry shown in Fig. 1, where graphene is surrounded with dielectric constants ε1 and ε2, where we consider that ε1 is the dielectric constant of air (∼1.0) and ε2 is the dielectric constant of SiC, a function of frequency.Reference Kittel1
3D view of SPP propagation between two interfaces.

The Maxwell equations are given by Eq. 1.
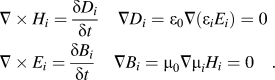 $$\eqalignb{ & \nabla \times {H_i} = {{\delta {D_i}} \over {\delta t}}\quad \nabla {D_i} = {\varepsilon _0}\nabla \left( {{\varepsilon _i}{E_i}} \right) = 0 \cr & \nabla \times {E_i} = {{\delta {B_i}} \over {\delta t}}\quad \nabla {B_i} = {\mu _0}\nabla {\mu _i}{H_i} = 0\quad . \cr}$$
Here the subscript i = m or d attributes the above Maxwell equations for metal and dielectric medium, respectively. ε0 and μ0 are the free space electric permittivity and magnetic permittivity. The solution of the Maxwell equation is divided into two parts:
(i) S-polarized field wave, also called as TE field wave which corresponds to the solution in the case when electric field is parallel to the interface.
(ii) P-polarized field wave, also called as TM field wave which corresponds to the solution in the case when magnetic field is parallel to the interface.
TM modes are found by assuming that the electric field has the form as
 $$\eqalignb{ & {\rm{When}}\;x > 0\quad {E_x} = B{e^{iqz - {Q_1}x}},\;{E_y} = 0\;{\rm{\,and\,}}\;{E_z} = A{e^{iqz - {Q_1}x}} \cr & {\rm{When}}\;x\,\, \lt\, 0\quad {E_x} = D{e^{iqz + {Q_2}x}},\,{E_y} = 0\;{\rm{\,and\,}}\;{E_z} = C{e^{iqz + {Q_2}x}}\quad . \cr}$$
After inserting this ansatz into Maxwell's equations and matching the boundary conditions (which include the conductance of 2D graphene layer), the dispersion relation of TM mode is given as
 $${{{\varepsilon _1}} \over {\sqrt {{q^2} - {{{\varepsilon _1}{\omega ^2}} \over {{c^2}}}} }} + {{{\varepsilon _2}} \over {\sqrt {{q^2} - {{{\varepsilon _2}{\omega ^2}} \over {{c^2}}}} }} = {{\sigma \left( {\omega ,q} \right)i} \over {\omega {\varepsilon _0}}}\quad .$$
By explicitly writing the dependence of the conductivity on the wave vector q, we allow for the possibility of nonlocal effects, where the mean free path of electron would be smaller than q − 1. Our frequency of interest falls within the regime, where  $q \ll {\omega \mathord{\left/ {\vphantom {\omega c}} \right. \kern-\nulldelimiterspace} c}$. Using this boundary condition, the above dispersion relation can be simplified as
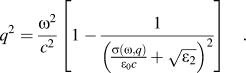 $${q^2} = {{{\omega ^2}} \over {{c^2}}}\left[ {1 - {1 \over {{{\left( {{{\sigma \left( {\omega ,q} \right)} \over {{\varepsilon _0}c}} + \sqrt {{\varepsilon _2}} } \right)}^2}}}} \right]\quad .$$
Detailed mathematical derivation with the MATLAB code is given in Appendix. It is to be noted that a small wave length (large q) leads to a high transverse localization of the modes, which are also accompanied by collective surface charge oscillation, similar to SPP's in metals; however, in contrast to metal here we deal with the 2D collective excitation that propagates along the surface: surface plasmon polariton (SPP)'s.
II. PLASMONIC DISPERSION AND ITS VIABILITY ON EPITAXIAL GRAPHENE (EG)
Electromagnetic dispersion relation of SPP at the EG/SiC interface is shown in Fig. 2 (red dotted line). In this section we plot the dispersion relation with free space dispersion relation (q = ω/c solid blue line). Detailed MATLAB code is at the end of this paper as an Appendix.
Electromagnetic SPP at the EG/SiC interface (when E f = 30 meV) with intra- and interband boundary conditions shows viability of plasmonics in EG.
We also include the boundary condition for intra- and interband scattering regime as per Ref. Reference Hwang and Das Sarma2. From the plot, it is clear that there is an intersection point between SPP dispersion and free space curve at an angle. This intersection point moves along with the change of Fermi energy (Fig. 2). So, there is a possibility to get light back from SPP at the EG/SiC interface if it follows the criteria of interband scattering. In short, it is necessary to have an intersection point between SPP dispersion with the free space dispersion along with interband scattering to get light from SPP. So, this SPP can be used as a light source generation.
There are two scattering mechanisms associated with the material:Reference Mak, Sfeir, Wu, Lui, Misewich and Heinz3–Reference Bohm and Pines5 (a) intraband scattering, which is basically electron–electron scattering where energy is released in terms of heat and (b) interband scattering, which is electron–hole scattering and energy is released in terms of light. Lower SPP propagation length at the metal/air interface because of dominant intraband scattering where energy is lost as heat as well as radiation back to the air. This is the limitation to get light from SPP at the metal/dielectric interface.
However, recent publicationReference Hwang and Das Sarma2 has shown that interband scattering of EG can be moved to the higher energy level by introducing impurity on it. However, on the basis of collective electron excitations developed by Bohm and Pine,Reference Bohm and Pines5 Hwang and Das SarmaReference Hwang and Das Sarma2 developed the boundary condition of single particle excitation (SPE) for intra- and interband electron hole excitation using random phase approximation model. Now we apply this boundary condition to our SPP dispersion curve, we find the following result.
It shows that graphene SPP does not enter into the intraband SPE and exists for all wave vectors. It is clearly visible that SPP at the EG/SiC interface satisfies both the criteria (light to SPP conversion and SPP to light conversion) for plasmonic device application, though there are certain issues to be sorted out in terms of fabrication geometry to confirm that light is from SPP, which we will discuss in the proposed experiment section. In the following section we will describe with our initial result with the plasmon tuning both in theory and experiment. Finally we will describe the list of experiments to be required to realize plasmonic device application on EG.
III. EG GROWTH AND PLASMONIC WAVEGUIDE FABRICATION
Epitaxial growth of large-area graphene by thermal decomposition of commercial <0001> 4H and 6H SiC substrates at high temperature and vacuum produces a few monolayers (ML) to >50 ML thick EG, depending on growth conditions and substrate. In our experiments, EG was grown on commercial, nitrogen doped, 6H–SiC surfaces prepared by chemical mechanical polishing. The 1 cm × 1 cm samples were degreased using trichloroethylene (TCE), acetone, and methanol, respectively. They were then rinsed in deionized (DI) water for three minutes. The samples were finally dipped in HF to remove native oxide and rinsed with DI water before being blown dry. They were then set in a graphite crucible in an inductively heated furnace where high vacuum was maintained (<10−6 Torr) and baked out overnight at 1000 °C. The large amount of graphite foam surrounding the crucible, as well as the large thermal mass of the graphite crucible minimizes the thermal gradients and thermal transients in the system. No graphitization occurs during bake out as confirmed through Raman characterization. The temperature was then slowly raised to the growth temperature (1300–1450 °C), optimized for c-plane Si face growth. In every growth, in addition to the a and m plane samples, witness Si-face and C-face samples were also grown for comparison as these conditions were optimized for growing high quality EG films on Si face SiC. All growths were performed for 60 min before cooling to 1000 °C at a ramp rate of 7–8 °C/min and eventually to room temperature. Slow temperature ramps were utilized to minimize thermal stress on the samples. Raman characterization was used as an indication of G (1585 cm−1), D (1345 cm−1), and 2D (2650 cm−1) peak which are due to in plane vibration, disorder, and double resonant, respectively, and the peak I D/I G (disorder ratio) demonstrates the quality of graphene confirming SP 2 bonded carbon.Reference Daas, Daniels, Sudarshan and Chandrashekhar6–Reference Stauber, Peres and Geim8
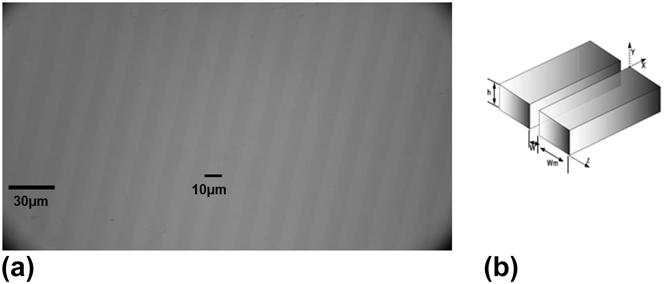
EG waveguide was fabricated in a class-100 clean room with the use of Karl Suss mask aligner that performs photolithography and using reactive ion etching technique. First EG (∼0.66 nm) on SiC was cleaned using TCE, acetone, and methanol. AZ5214 photoresist was deposited using spinner and Karl Suss mask aligner (wave length 432 nm) was used to make the stripe pattern on the sample. Since we fabricated pattern varying from 2 to 16 μm with the stepping of 2 μm in each case, we used different mask every time to make the required pattern. Then we placed the sample in RIE chamber for dry etching. We used oxygen plasma etching to etch exposed graphene where EG was not etched under the photoresist. Oxygen plasma was created using the RIE chamber with pressure control of 300 mTorr and O2:N2 flow was kept 20:80 and 400 MW RF power applied as well. In this case, etch rate is ∼0.7 (nm/min), so we etched it for 2 min to make sure that exposed EG is etched away. After etching, sample was cleaned using acetone and methanol to clean photoresist. Fabricated EG-SiC pattern was confirmed through Raman characterization for the presence of graphene as well. Each pattern has 50% duty cycle, meaning EG width and spacing between the EG is the same in every time. Figure 3(a) shows optical image of fabricated pattern of EG width (Wm ∼10 μm), EG spacing (W = 10 μm), and depth (h ∼1.5 nm), whereas Fig. 3(b) shows a 3D visualization of the dimension as well. Similarly, we fabricated 4, 6, 8…16 μm pattern.
(a) Optical microscope image of experimentally fabricated 10 μm EG-SiC waveguide with 50% duty cycle and depth ∼1.5 nm. (b) Represents a theoretical 3D presentation of waveguide with spacing, width, and depth dimension direction.
As restrahlen band in 8–10 µm regime, we expect that strip width of 8–10 µm can enhance SPP with very low loss in EG. It is to be noted that strip width can be visualized from our extracted parameter for reflection.
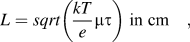
Diffusion length of electron is
 $$L = sqrt\left( {{{kT} \over e}\mu \tau } \right)\;{\rm{in}}\;{\rm{cm}}\quad ,$$
where e is the electron charge. This length is not too short to collect electron–hole pair generation by incident light only, rather it is long enough to propagate SPP within its propagation length without significant decays.
IV. RESULTS AND ANALYSIS
FTIR reflection minimum peak position is an indication of plasmon at the EG/SiC interfaces. So, minimum reflection peak position shift is an indication of plasmon tuning at the EG/SiC interface. In this regard, we also carried out FTIR reflection measurement on the graphene-SiC waveguide stripe while glass is taken as the reference. Figure 4(b) shows the plot of our experimental data where it is clear that minimum reflection peak (maximum absorption) position is blue shifted.
(a) Blue shift in IR reflection minimum peak due to increasing plasmon frequency (theory). (b) FTIR minimum reflection peak shift for different waveguide strip width (experimental data).
From this figure we extract minimum reflection peak position (x-axis value). Please note the y axis difference between experiment and theory due to the background noise. We are collecting only x axis frequency shift which is unaffected by background noise.
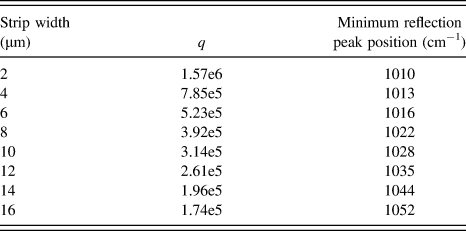
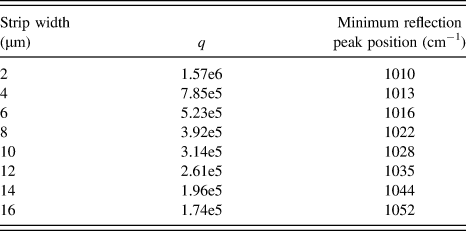
We also convert strip width to q as per Eq. (4). Extracted data are summarized in Table I.
Experimental data that indicates the minimum reflection peak blue shift with increasing strip width.
As plasmon (SPP) arises due to the singularity of SiC dielectric, it is obvious that modification of SiC dielectric function in reflection model is necessary to account this plasmon effect. The modified SiC dielectric function is below
 $$\varepsilon \left( \omega \right) = {\varepsilon _\infty }\left( {1 + {{\omega _L^2 - \omega _T^2} \over {\omega _T^2 - {\omega ^2} - i\omega \Gamma }} - {{\omega _p^2} \over {\omega \left( {\omega + i\gamma } \right)}}} \right)\quad ,$$
where  ${{\omega _{\rm{p}}^2} \over {\omega \left( {\omega + i\gamma } \right)}}$ is the plasmon frequency related change in dielectric function. ωp is the plasmon frequency. Using MATLAB we plot Eq. 6 for different values of ωp.
In this regard we replace SiC dielectric function in our reflection model with Eq. 6. Detailed reflection explanation is given in Refs. Reference Daas, Daniels, Sudarshan and Chandrashekhar6, Reference Stauber, Peres and Geim8, and Reference Korobkin, Urzhumov and Shvets9. We vary ωp to get the minimum reflection peak position shown in Table I in each case and note the plasmon frequency corresponding to the minimum reflection peak position as shown in Fig. 5(a) where theory matches with the experiment. Now if we plot minimum reflection peak position versus plasmon peak, y axis intersection indicates no plasmon shift, SiC phonon peak (972 cm−1) as shown in Fig. 5(b). This also indicates the accuracy of our extracted parameter as well as experimental results. We also plot this tuning with the plasmon dispersion relation and found it to be in good agreement [Fig. 5(c)]. Still there are some discrepancies between the theory and experiment. This might originate due to experimental error and polarization of IR light affecting the conductivity as well as experimental and theory fitting error which needs to be resolved for clear understanding.
(a) Mathematical model fit the experiment for minimum reflection position where plasmon frequency extracted as a fitting parameter. (b) Minimum reflection peak versus extracted plasmon frequency. (c) Experiment and mathematical evidence of SPP propagation.
V. CONCLUSION
In summary, we demonstrated SPP dispersion relation with its boundary condition both from a theoretical and an experimental point of view. We have also explained how to tune this SPP where theory is in good agreement with the experimental result. This technique can be used to tune EG Fermi Dirac point both in the intra- and interband regions as explained in theory with Fig. 2. In interband regime, this can be a new source electron–hole pair recombinationReference Daas10 which finds application greatly in nanophotonics. Apart from this, this SPP can be used as high speed switching for optical computing in next generation VLSI technology.
ACKNOWLEDGMENTS
I would like to thank the University of South Carolina, Columbia for allowing me to do this research. I would like to thank Dr. M.V.S. Chandrashekhar and Dr. T.S. Sudarshan for providing me with the necessary guidelines and suggestions as well.
APPENDIX:CALCULATION OF SPP DISPERSION RELATION

 $$r = {{M - 1} \over {M + 1}}$$
Where  $M = K + \sum {\cos \theta }$,
 $K = {{{\varepsilon _2}} \over {{\varepsilon _1}}}{{K_z^i} \over {K_z^t}}$,
 $\sum ={{{\sigma (\omega )} \over {\sqrt {{\varepsilon _1}} {\varepsilon _0}c}}}$, and
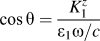 $\cos \theta = {{K_1^z } \over {\varepsilon _1 {\omega \mathord{\left/ {\vphantom {\omega c}} \right. \kern-\nulldelimiterspace} c}}}$ (from the geometry).
Pole of Eq. (A1) is
M + 1 = 0,
M = −1,
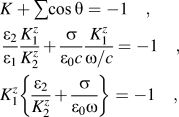 $$\eqalignb{ & K + \sum {\cos \theta } = - 1\quad , \cr & {{{\varepsilon _2}} \over {{\varepsilon _1}}}{{K_1^z} \over {K_2^z}} + {\sigma \over {{\varepsilon _0}c}}{{K_1^z} \over {\omega /c}} = - 1\quad , \cr & K_1^z\left\{ {{{{\varepsilon _2}} \over {K_2^z}} + {\sigma \over {{\varepsilon _0}\omega }}} \right\} = - 1\quad , \cr}$$
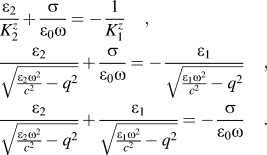 $$\eqalignb{ & {{{\varepsilon _2}} \over {K_2^z}} + {\sigma \over {{\varepsilon _0}\omega }} = - {1 \over {K_1^z}}\quad , \cr & {{{\varepsilon _2}} \over {\sqrt {{{{\varepsilon _2}{\omega ^2}} \over {{c^2}}} - {q^2}} }} + {\sigma \over {{\varepsilon _0}\omega }} = - {{{\varepsilon _1}} \over {\sqrt {{{{\varepsilon _1}{\omega ^2}} \over {{c^2}}} - {q^2}} }}\quad , \cr & {{{\varepsilon _2}} \over {\sqrt {{{{\varepsilon _2}{\omega ^2}} \over {{c^2}}} - {q^2}} }} + {{{\varepsilon _1}} \over {\sqrt {{{{\varepsilon _1}{\omega ^2}} \over {{c^2}}} - {q^2}} }} = - {\sigma \over {{\varepsilon _0}\omega }}\quad . \cr}$$
Let us consider,  $q \ll {\omega \mathord{\left/ {\vphantom {\omega c}} \right. \kern-\nulldelimiterspace} c}$
 $${{\sqrt {{\varepsilon _2}} \sqrt {{\varepsilon _2}} } \over {\sqrt {{\varepsilon _2}} \sqrt {{{{\omega ^2}} \over {{c^2}}} - {{{q^2}} \over {{\varepsilon _2}}}} }} + {{{\varepsilon _1}} \over {\sqrt {{{{\varepsilon _1}{\omega ^2}} \over {{c^2}}} - {q^2}} }} = - {\sigma \over {{\varepsilon _0}\omega }}\quad ,$$
 $${{\sqrt {{\varepsilon _2}} } \over {\sqrt {{{{\omega ^2}} \over {{c^2}}}\left( {1 - {{{q^2}{c^2}} \over {{\varepsilon _2}{\omega ^2}}}} \right)} }} + {{{\varepsilon _1}} \over {\sqrt {{{{\omega ^2}} \over {{c^2}}}\left( {1 - {{{q^2}{c^2}} \over {{\varepsilon _1}{\omega ^2}}}} \right)} }} = - {\sigma \over {{\varepsilon _0}\omega }}\quad ,$$
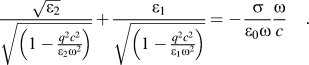 $${{\sqrt {{\varepsilon _2}} } \over {\sqrt {\left( {1 - {{{q^2}{c^2}} \over {{\varepsilon _2}{\omega ^2}}}} \right)} }} + {{{\varepsilon _1}} \over {\sqrt {\left( {1 - {{{q^2}{c^2}} \over {{\varepsilon _1}{\omega ^2}}}} \right)} }} = - {\sigma \over {{\varepsilon _0}\omega }}{\omega \over c}\quad .$$
In our case,  ${\varepsilon _2} \gg {{qc} \over \omega }$ which attributes
 ${{{q^2}{c^2}} \over {{\omega ^2}{\varepsilon _2}}} \ll 1$, so
 $1 - {{{q^2}{c^2}} \over {{\varepsilon _2}{\omega ^2}}} \approx 1$.
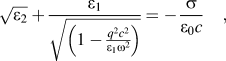 $$\sqrt {{\varepsilon _2}} + {{{\varepsilon _1}} \over {\sqrt {\left( {1 - {{{q^2}{c^2}} \over {{\varepsilon _1}{\omega ^2}}}} \right)} }} = - {\sigma \over {{\varepsilon _0}c}}\quad ,$$
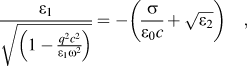 $${{{\varepsilon _1}} \over {\sqrt {\left( {1 - {{{q^2}{c^2}} \over {{\varepsilon _1}{\omega ^2}}}} \right)} }} = - \left( {{\sigma \over {{\varepsilon _0}c}} + \sqrt {{\varepsilon _2}} } \right)\quad ,$$
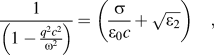 $${1 \over {\left( {1 - {{{q^2}{c^2}} \over {{\omega ^2}}}} \right)}} = \left( {{\sigma \over {{\varepsilon _0}c}} + \sqrt {{\varepsilon _2}} } \right)\quad ,$$
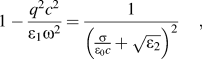 $$1 - {{{q^2}{c^2}} \over {{\varepsilon _1}{\omega ^2}}} = {1 \over {{{\left( {{\sigma \over {{\varepsilon _0}c}} + \sqrt {{\varepsilon _2}} } \right)}^2}}}\quad ,$$
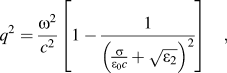 $${q^2} = {{{\omega ^2}} \over {{c^2}}}\left[ {1 - {1 \over {{{\left( {{\sigma \over {{\varepsilon _0}c}} + \sqrt {{\varepsilon _2}} } \right)}^2}}}} \right]\quad ,$$
so the dispersion relation is
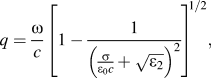 $$q = {\omega \over c}{\left[ {1 - {1 \over {{{\left( {{\sigma \over {{\varepsilon _0}c}} + \sqrt {{\varepsilon _2}} } \right)}^2}}}} \right ]^{1/2}},$$
where 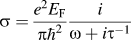 $\sigma = {{{e^2}{E_{\rm{F}}}} \over {\pi {\hbar ^2}}}{i \over {\omega + i{\tau ^{ - 1}}}}$ is called the semiclassical conductivity.