INTRODUCTION
Analyses of species co-occurrences with null models based on randomization tests have been of fundamental importance in community ecology and biogeography (Gotelli, Reference Gotelli2000). Among them, the nested subset pattern analysis has been widely used to identify non-random patterns of species composition in insular biotas (Patterson and Atmar, Reference Patterson and Atmar1986; Patterson, Reference Patterson1990; Rodríguez-Gironés and Santamaría, Reference Rodríguez-Gironés and Santamaría2006). Certain biological assemblages on islands show non-random patterns of species composition, called ‘nested subsets’, in which species-poor assemblages harbour distinct subsets of the species in progressively richer assemblages; this can occur when biotas are shaped by local extinctions as well as by dispersion and colonization events (Patterson and Atmar, Reference Patterson and Atmar1986; Patterson, Reference Patterson1990). Parasites provide interesting models for the study of community structure and organization; individual hosts represent replicated habitats in time and space (Guégan and Hugueny, Reference Guegán and Hugueny1994) that can be considered as units of study in the context of island biogeography theory (Kuris et al. Reference Kuris, Blaustein and Alió1980). These features, and probably the successful finding of predictable nested structure in the first study based on parasites carried out by Guégan and Hugueny (Reference Guegán and Hugueny1994) using the metric N and the algorithms RANDOM0 and RANDOM1 of Patterson and Atmar (Reference Patterson and Atmar1986), has encouraged many investigators to apply nestedness analyses to test whether patterns of parasite co-occurrence depart from null models.
Later studies, however, revealed that departures from random species assembly are the exception rather than the norm: most patterns of species co-occurrence do not differ from those predicted by null models. In fact, several authors have failed to find any evidence of nestedness in numerous host-parasite systems (Guégan and Kennedy, Reference Guégan and Kennedy1996; Worthen and Rohde, Reference Worthen and Rohde1996; Poulin, Reference Poulin1996; Rohde et al. Reference Rohde, Worthen, Heap, Hugueny and Guégan1998; Hayward et al. Reference Hayward, Perera and Rohde1998), whereas other studies, despite finding non-random patterns in some parasite communities (Poulin, Reference Poulin1997; Matĕjusová et al. Reference Matĕjusová, Morand and Gelnar2000; Poulin and Guégan, Reference Poulin and Guégan2000; Poulin and Valtonen, Reference Poulin and Valtonen2001, Reference Poulin and Valtonen2002; Vidal Martínez and Poulin, Reference Vidal-Martínez and Poulin2003; Timi and Poulin, Reference Timi and Poulin2003; Calvete et al. Reference Calvete, Blanco-Aguiar, Virgos, Cabezas-Diaz and Villafuerte2004), including cases of anti-nestedness (Poulin and Guégan, Reference Poulin and Guégan2000; Poulin and Valtonen, Reference Poulin and Valtonen2001; Valtonen et al. Reference Valtonen, Pulkkinen, Poulin and Julkunen2001), failed to detect consistent nested patterns when comparing community structure among different host species, or populations of a single species in different seasons or localities.
The lack of repeatability in community structure is supported by other null models. Gotelli and Rohde (Reference Gotelli and Rohde2002) used null models developed by Gotelli and Graves (Reference Gotelli and Graves1996) to analyse presence-absence matrices for ectoparasites of 45 marine fish host species and found that, as a rule, co-occurrence patterns could not be distinguished from those resulting by random colonization and extinction.
A common feature of the nestedness studies listed above, published over almost 10 years, is that they all used the metric N and the algorithm RANDOM1 of Patterson and Atmar (Reference Patterson and Atmar1986). During that period, however, there was some criticism of this method by researchers who claimed to have developed better alternative metrics (Wright and Reeves, Reference Wright and Reeves1992; Atmar and Patterson, Reference Atmar and Patterson1993; Fischer and Lindenmayer, Reference Fischer and Lindenmayer2002). In fact, Atmar and Patterson (Reference Atmar and Patterson1993, Reference Atmar and Patterson1995) developed a new metric (T) to calculate nestedness, which represents a change of course from their previous paper (Patterson and Atmar, Reference Patterson and Atmar1986), correcting some problems such as the importance given to unexpected presences relative to absences, the equivalent weight given to all absences and the dependence on matrix size. This newer index is related to the concept of system temperature, which represents the degree of order (or disorder) in a presence-absence matrix, and is calculated with the program ‘nestedness temperature calculator’ or NTC (see Wright et al. Reference Wright, Patterson, Mikkelson, Cutler and Atmar1998, for a comparative review of methods).
Probably because T is independent of matrix size, thus allowing comparisons of nestedness between matrices, it was adopted in some parasitological studies to compare different assemblages. Thus it has been applied in a variety of parasite communities parasitizing fish (Carney and Dick, Reference Carney and Dick2000; Simková et al. Reference Simková, Gelnar and Morand2001; Norton et al. Reference Norton, Lewis and Rollinson2004; Zelmer and Arai, Reference Zelmer and Arai2004; González and Poulin, Reference González and Poulin2005a, Reference González and Poulinb), mammals (Fellis et al. Reference Fellis, Negovetich, Esch, Horak and Boomker2003; Bellocq et al. Reference Bellocq, de, Sará, Casanova, Feliu and Morand2003; Krasnov et al. Reference Krasnov, Shenbrot, Khokhlova and Poulin2005) and amphibians (Zelmer et al. Reference Zelmer, Paredes-Calderón, León-Règagnon and García-Prieto2004). Most of these authors found that all studied systems were significantly nested, the exception being flea assemblages on mammal hosts that showed a predominance of random assembly (Krasnov et al. Reference Krasnov, Shenbrot, Khokhlova and Poulin2005). It seems quite surprising that a change in the method used to detect nestedness had such a dramatic impact on the results. The question arises: is the difference between the results of the two groups of studies due to the inherent ecological properties of the parasite communities they investigated, or is it due to one or both measures of nestedness suffering from methodological artefacts? The temperature calculator has been blamed for erroneously detecting nestedness, because it regularly overestimates nestedness and its statistical significance (Fischer and Lindenmayer, Reference Fischer and Lindenmayer2002). However, no comparative studies have been made using both approaches on parasite communities, except for Brooks et al. (Reference Brooks, León-Règagnon, McLennan and Zelmer2006) who found more evidence of nestedness in amphibian parasite communities using the temperature method than when using RANDOM1.
Recently, a new algorithm to calculate the nestedness of presence-absence matrices, the binary matrix nestedness temperature calculator or BINMATNEST, has been proposed (Rodríguez-Gironés and Santamaría, Reference Rodríguez-Gironés and Santamaría2006). According to the authors, it is more robust than the NTC, overcoming some of its difficulties. The launch of yet another new method means that it is time to re-evaluate how common nestedness really is in parasite communities. For this purpose, we first present a comparison of the frequency of positive results for nestedness in parasite communities as a function of the method used, to illustrate how sensitive the conclusions of a study are to the choice of method. Second, both NTC and BINMATNEST, using the metric T, are applied to parasite communities on which the original metric N and algorithm RANDOM1 had already been used to detect either random assemblages, nestedness or anti-nestedness. Although limited in scope, this comparison will highlight the risks of choosing a method to test for nestedness without careful consideration of its biological assumptions. In addition, a different analytical approach is also applied to these communities, which consists of a straightforward comparison between the observed frequencies of co-occurrences of species with those expected from their prevalence under random assembly (Janovy et al. Reference Janovy, Clopton, Clopton, Snyder, Efting and Krebs1995). This alternative approach provides a benchmark for comparisons with the results of the three nestedness analyses, since it provides a simple and basic test for non-random structure.
MATERIALS AND METHODS
Firstly, we surveyed all studies of nestedness in parasite communities. These studies were split into those that used the metric N and the null model RANDOM1 (Guégan and Hugueny, Reference Guegán and Hugueny1994, and all references listed in the second paragraph of the Introduction section) and those that relied on the metric T and the nestedness temperature calculator NTC (all references listed in the fifth paragraph of the Introduction section). For each study, we recorded the number of communities showing significant nested structure and the number of communities not showing nestedness. We then pooled these numbers across studies, and used a Chi-squared test to compare the overall frequency of nested patterns among parasite communities investigated with both methods.
Second, we analysed the presence-absence matrices from 2 previously published studies, both designed to measure predictability of helminth community structure, one of them within different fish species from Finland (Poulin and Valtonen, Reference Poulin and Valtonen2001) and the other within component communities (different host age-classes in 4 populations) of the fish Engraulis anchoita from Argentina (Timi and Poulin, Reference Timi and Poulin2003). Data from Finland fishes included only communities of adult endoparasites of hosts from the Bothnian Bay. The results of nestedness analyses on all these communities using the metric N and the null model RANDOM1 were taken from the original studies. Matrices were maximally packed and the nestedness metric T (Atmar and Patterson, Reference Atmar and Patterson1993) was calculated. For each matrix, the value of T was compared with 1000 randomly generated matrices, and the probability of randomly obtaining a matrix as ordered as, or more ordered than, the observed one was calculated with the NTC of Atmar and Patterson (Reference Atmar and Patterson1995).
Then, the program BINMATNEST (Rodríguez-Gironés and Santamaría, Reference Rodríguez-Gironés and Santamaría2006) was applied to the same data sets. For each matrix the temperature was calculated and compared with 1000 randomly generated matrices. All the other parameters were chosen following the program recommendations. The probability that the temperature of a random matrix is lower than or equal to the temperature of the observed assemblages was calculated according to the null models 2 and 3 (see Rodríguez-Gironés and Santamaría, Reference Rodríguez-Gironés and Santamaría2006).
A third null model of expected frequencies based on the actual prevalence of parasites (species density distributions) instead of on randomizations was generated according to Janovy et al. (Reference Janovy, Clopton, Clopton, Snyder, Efting and Krebs1995) to determine whether co-occurrences of parasite species within the same assemblage were more or less frequent than expected by chance. The expected values were calculated for each species occurring alone, and for all the possible combinations of parasite species within the assemblage.
RESULTS
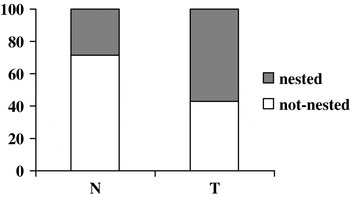
There was a clear difference in the likelihood of detecting significant nested patterns in a parasite community between studies that relied on N and the null model RANDOM1, and those that used instead T and the NTC (χ2=26·5, d.f.=1, P<0·001). The former method typically yields few significant nested patterns, whereas the latter detects significant nestedness in more than half of the communities investigated (see Fig. 1). The fact that studies of nestedness in parasite communities have shifted suddenly over the years from using N and RANDOM1 to using instead T and the NTC has coincided with much more nested patterns being reported in the recent literature.
Percentage distribution of the results of nested subset analyses of parasite communities from literature data, after applying either the metric N and RANDOM1 (N) or the metric T and NTC (T).

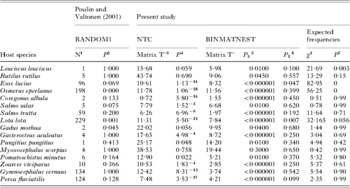
Our re-analyses of 2 sets of previously published datasets supports this finding. Thirteen of the 16 fish species from Finland had parasite communities that showed a nested subset pattern based on NTC (including 2 reported as nested, 3 as anti-nested and 8 as randomly structured when N and RANDOM1 were used), whereas 3 displayed a random assembly (including 2 reported as anti-nested and 1 as nested with N and RANDOM1) (Table 1). An even higher number of nested communities was obtained when BINMATNEST was applied and the p-value was calculated according to the null model 3 of the program (p3), with only 1 host species showing a random assembly, also described as random by NTC, but as anti-nested by N and RANDOM1. However, when the p-value was calculated according to the null model 2 (proposed by Fischer and Lindenmayer, Reference Fischer and Lindenmayer2002) (p2), only the assemblages of Esox lucius and Lota lota remained nested (Table 1). The frequencies of co-occurrence of the different parasite species in each component community did not deviate significantly from the null model based on random occurrences for most fish species, with the exception of Leuciscus leuciscus, Esox lucius and Osmerus eperlanus, all 3 displaying a nested structure according to the algorithms NTC and BINMATNEST (Table 1). However, it must be pointed out that departures from expected frequencies are not a reflection of the community as a whole. Instead, they resulted from a single fish harbouring more species than expected for L. leuciscus and E. lucius, and from 12 more fish than expected harbouring only the cestode Proteocephalus longicollis for O. eperlanus. These minor exceptions affect the overall statistical test, but in reality probably only reflect the occasional acquisition of an ‘instant’ community when ingesting an intermediate host infected by many helminth species, or feeding specialization by individual fishes.
Within component community nestedness analyses for metazoan parasites of several fish species from Finland, measured with three different algorithms, RANDOM1 of Patterson and Atmar (Reference Patterson and Atmar1986), nestedness temperature calculator (NTC) of Atmar and Patterson (Reference Atmar and Patterson1995) and binary matrix nestedness temperature calculator (BINMATNEST) of Rodríguez-Gironés and Santamaría (Reference Rodríguez-Gironés and Santamaría2006), as well as results of the null model of expected frequencies of Janovy et al. (Reference Janovy, Clopton, Clopton, Snyder, Efting and Krebs1995)
(Values of probability are expressed as provided by each software.)

1 Observed index of nestedness; 2 RANDOM1 probability; 3 matrix temperature; 4 probability that T°random<T°; 5 probability that T°random<T°, calculated according to the null model of Rodríguez-Gironés and Santamaría (Reference Rodríguez-Gironés and Santamaría2006); 6 probability that T°random<T°, calculated according to the null model of Fischer and Lindenmayer (Reference Fischer and Lindenmayer2002); 7 probability of random co-occurrence of parasite species.
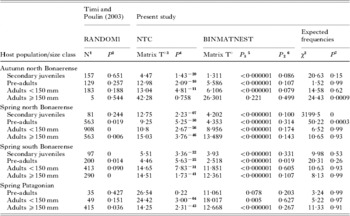
Thirteen of the 15 component communities of parasites of E. anchoita showed a nested subset pattern after applying NTC (including 7 reported as nested and 6 as randomly structured when the metric N and the null model RANDOM1 were used), whereas 2 displayed a random assembly (as when N and RANDOM1 was applied) (Table 2). Exactly the same picture was observed when BINMATNEST was applied using null model 3; however, when the p-value was calculated according to null model 2, only the pre-adults from the spring south Bonaerense population still showed a nested pattern. The frequencies of co-occurrence of the different parasite species in each component community did not deviate significantly from the null model based on random occurrences for most communities, with the exception of the adult fish ⩾150 mm from the autumn north Bonaerense population and the secondary juveniles and pre-adults from the spring north Bonaerense population, all 3 displaying a nested structure according to the NTC and BINMATNEST under null model 3 (Table 2). Once again, these deviations from expected frequencies are merely due to between 1 and 4 fish per population harbouring more parasite species than expected, and not to community-wide patterns.
Within component community nestedness analyses for metazoan parasites of Engraulis anchoita from four host populations, measured with three different algorithms, RANDOM1 of Patterson and Atmar (Reference Patterson and Atmar1986), nestedness temperature calculator (NTC) of Atmar and Patterson (Reference Atmar and Patterson1995) and binary matrix nestedness temperature calculator (BINMATNEST) of Rodríguez-Gironés and Santamaría (Reference Rodríguez-Gironés and Santamaría2006), as well as results of the null model of expected frequencies of Janovy et al. (Reference Janovy, Clopton, Clopton, Snyder, Efting and Krebs1995)
(Values of probability are expressed as provided by each software.)

1 Observed index of nestedness; 2 RANDOM1 probability; 3 matrix temperature; 4 probability that T°random <T°; 5 probability that T°random <T°, calculated according to the null model of Rodríguez-Gironés and Santamaría (Reference Rodríguez-Gironés and Santamaría2006); 6 probability that T°random <T°, calculated according to the null model of Fischer and Lindenmayer (Reference Fischer and Lindenmayer2002); 7 probability of random co-occurrence of parasite species.
DISCUSSION
Our results clearly show that the choice of method used to detect nested patterns in parasite communities has drastic impacts on the results obtained. Over the years, we can see an increase in the likelihood of finding nestedness in parasite communities. Far from representing a biological phenomenon or a paradigm shift, this temporal trend is a simple outcome of a change in the preferred method. The different methods available to detect nestedness all have different underlying assumptions, as well as different strengths and weaknesses (Wright et al. Reference Wright, Patterson, Mikkelson, Cutler and Atmar1998; Rodríguez-Gironés and Santamaría, Reference Rodríguez-Gironés and Santamaría2006). Choosing a method should not be a matter of convenience, but instead the outcome of careful consideration.
After applying the metric N and the null model RANDOM1, both Poulin and Valtonen (Reference Poulin and Valtonen2001) and Timi and Poulin (Reference Timi and Poulin2003) concluded that nestedness is infrequent in parasite communities of fish, and that methodological as well as biological explanations could account for this lack of repeatability. A non-biological cause may be that the power of the algorithm to detect nestedness depends on the matrix fill (i.e. the prevalence of parasite species in a fish population). On the other hand host biology, and not only within-community processes, has an influence on nested patterns; among host features, body size has a great influence on parasite infracommunity structure and composition.
As in most previous studies, a change in the method used to measure nestedness, for example, the application of the NTC, had a dramatic impact on the results, but here on the same data-sets as those analysed with N and RANDOM1. In light of the NTC results, nestedness appears to be the rule instead of the exception in parasite communities; this situation is enhanced further by results obtained with BINMATNEST and the null model 3. However, the totally opposite situation occurs when the null model 2 is used, with nestedness again appearing to be extremely rare. A common feature of these 3 methods, however, is that anti-nestedness was never observed.
The cause for such a huge variation among different methods must reside in the differences among the metrics and the null models against which they are evaluated. The metric N developed by Patterson and Atmar (Reference Patterson and Atmar1986) counts the number of absences from biotas richer than the most depauperate one in which a species occurs, and sums these counts across all species. On the other hand, the metric T of Atmar and Patterson (Reference Atmar and Patterson1993) provides a standardized measure of matrix order (or disorder) by calculating the deviation of a real matrix from one of the same size and fill that is perfectly nested (Wright et al. Reference Wright, Patterson, Mikkelson, Cutler and Atmar1998). The metric implemented in BINMATNEST constitutes a step forward, improving those of the NTC by uniquely defining a line of perfect order and using generic algorithms to determine the ordering of rows and columns, leading to minimum matrix temperature (Rodríguez-Gironés and Santamaría, Reference Rodríguez-Gironés and Santamaría2006). Therefore, it is not surprising that BINMATNEST produces similar results to those of NTC. However, the results of BITMATNEST under the null model 2 were closer to those of N and RANDOM1, indicating that a careful choice of model is necessary when the statistical significance of the results are being evaluated.
In fact, all 3 methods differ also in the null model they employ to determine the probability that the nestedness of a random matrix is higher than, or equal to, the nestedness of the observed data. The choice of model is of great importance because they vary in their inherent degree of constraints. RANDOM1 uses simulations in which species are drawn with the probabilities weighted by their observed prevalence values, until the number of species drawn equals the observed richness, whereas NTC generates null matrices without either row or column constraints, and only the total number of presences is fixed at the observed value (Wright et al. Reference Wright, Patterson, Mikkelson, Cutler and Atmar1998). BINMATNEST provides 3 null models, one equivalent to the NTC (null model 1), a null model 2 as proposed by Fischer and Lindenmayer (Reference Fischer and Lindenmayer2002), which constrains the probability of occurrence, making it higher for more ubiquitous species, and a null model 3 which does not constrain the row and column totals (Rodríguez-Gironés and Santamaría, Reference Rodríguez-Gironés and Santamaría2006). The contrasting results of models 2 and 3 in the analyses made with BINMATNEST prove that the selection of the null model, rather than of the metric, is more important in accounting for the observed differences.
So the question is: which is the most suitable metric and/or null model to measure parasite community structure? A proper comparative test of sensitivity and accuracy of all methods currently available would require the use of simulated communities with different inherent levels of nestedness. This is beyond the scope of the present paper. Choosing the most suitable method should also depend on the biological processes known to be important in the studied system, such as colonization or extinction (Patterson, Reference Patterson1990; Atmar and Patterson, Reference Atmar and Patterson1993; Cutler, Reference Cutler1994; Wright et al. Reference Wright, Patterson, Mikkelson, Cutler and Atmar1998).
Interestingly, the findings based on the model of Janovy et al. (Reference Janovy, Clopton, Clopton, Snyder, Efting and Krebs1995) suggest that most component communities are randomly assembled. The differential probability of infection among species due to their commonness or rarity in the ecosystem explains why frequencies of co-occurrences that do not depart from random assembly can still cause an apparent nested structure. Consider the following example. A community has 2 prevalent species, A which has a 90% prevalence (pa=0·9, qa=0·1), and B with an 80% prevalence (pb=0·8, qb=0·2). The probability of finding a host with no parasites is 0·02 (qa∗qb=0·1∗0·2); the probability of finding a host with only parasite A is 0·18 (pa∗qb=0·9∗0·2); the probability of finding a host with only parasite B is 0·08 (qa∗pb=0·1∗0·8); and the probability of finding a host with both A and B is 0·72 (pa∗pb=0·9∗0·8). Now consider a new parasite species arriving in this system: by passive sampling, it has a 72% probability of infecting a host already parasitized by the first two species, and only a 2% probability of infecting a previously uninfected host. Thus, nestedness can be produced by chance if measured by metrics overly sensitive to very minor deviations from pure randomness. In fact, Fischer and Lindenmayer (Reference Fischer and Lindenmayer2002) found nestedness (using NTC) in purely randomly generated communities.
Although new developments are occurring rapidly in the ecological literature (see Moore and Swihart, Reference Moore and Swihart2007; Ulrich and Gotelli, Reference Ulrich and Gotelli2007), there is still much work needed to resolve methodological issues before we can assess how common nested patterns are in parasite communities, and what they truly mean.
The authors thank Ms Silvia Gorosterrazu for developing the software used to test random expected frequencies of parasite co-occurrence, and Dr M. A. Rodríguez-Gironés for applying the BINMATNEST program to small-sized matrices after some adjustments to the program. Financial support was provided by grants from CONICET (PIP 5996/06) and Universidad Nacional de Mar del Plata (15/E 303).