


Introduction
Blowing-snow particles are known to have an electrostatic charge. Reference Schmidt, Schmidt and DentSchmidt and others (1999) and Reference Gordon and TaylorGordon and Taylor (2009) suggested that the electrostatic force created by charged particles changes the trajectory of its own motion. These trajectory changes could affect the snow-cover redistribution. An extended saltation length of blowing-snow particles contributes to low visibility, and these charged particles can also create snowdrifts and cornices, which can cause disasters such as avalanches (Reference Latham and MontagneLatham and Montagne, 1970). Therefore, the charging phenomenon of blowing-snow particles is an important issue in the precise understanding of their motion and disaster prevention. Since few reports of charge measurements exist, knowledge of the electrification characteristics of blowing-snow particles is insufficient. The relationship between snow-particle charge and various factors, including particle diameter, particle shape, wind velocity and relative humidity, has not yet been clarified.
Mechanism of charge separation of ice
The transportation medium of charge in metals is an electron. In contrast, that in ice is a proton. Reference Latham and MasonLatham and Mason (1961) revealed that the temperature gradient inside ice or between the contact interfaces of ice specimens causes charge separation. The density of ionic defects in ice, H+ and OH– ions, increases rapidly with increase in temperature. The formation of the temperature gradient produces an ionic concentration gradient, and the ions then diffuse to the colder region along this gradient. The ions, H+ and OH–, migrate at different rates. The higher diffusion speed of H+ ions results in a positively charged colder region, while the warmer region of the ice comprises negatively charged OH– ions.
Measurements of electrostatic charge
Field observations of the electrostatic charge of blowing-snow particles have been conducted by Reference Latham and MontagneLatham and Montagne (1970), Reference WishartWishart (1970) and Reference Schmidt, Dent and SchmidtSchmidt and others (1998). A wind tunnel experiment has been conducted by Reference MaenoMaeno and others (1985). Most of the researchers measured the particle charges with a Faraday cage and argued about the charge-to-mass ratios, denoted by Q. The charges were reported as all negative and the absolute values tended to increase with decrease in air temperature. In the field observations, Q was approximately –50 to –10 μCkg–1. In the wind tunnel experiment, Q was approximately –0.7 to –0.1 μCkg–1. Reference MaenoMaeno and others (1985) suggested that the difference in fetch caused the quantitative gaps between them.
Reference Schmidt, Dent and SchmidtSchmidt and others (1998) reported that Q ranged from –208 to +72 μCkg–1. These values were calculated from the amount of orbital variation of individual snow particles that pass through a uniform electric field space. This result indicates the coexistence of positively and negatively charged particles in a blowing-snow event and suggests that the Q values reported by previous researchers were underestimated because of opposite-sign offset.
Experiment outline
During a blowing-snow event, particles of various diameters exist in the atmosphere (Reference Budd, Dingle, Radok and M.J.Budd and others, 1966; Reference SchmidtSchmidt, 1982). However, there are no reports on particle diameter dependency of the charge. In addition, nearly all previous studies of electrostatic charges of blowing-snow particles have been based on charge-to-mass ratios, and the individual values are rarely disputed. The purpose of the experiment presented here was to measure the charge-to-mass ratios of blowing-snow particles, focusing on particle diameter, and to discuss their individual charges.
As described here, charge-to-mass ratios of blowing-snow particles are negative on average. Therefore, the sign of the snow surface is usually considered to be positive. Thus, the sign of an individual particle charge can be determined by the saltation motion pattern. Two simple saltation patterns are considered: in the first case, the snow particle simply rebounds off the snow surface; in the second case, the collision of the particle into the surface generates a new snow particle from the surface. It is assumed that the former particle has a negative charge and the latter has a positive charge. This proposal is supported by the results of Reference MaenoMaeno and others (1985) and Reference Schmidt, Dent and SchmidtSchmidt and others (1998). Thus, our experiment was conducted under hard-snow surface conditions to prevent the generation of new snow particles from the surface, which could lead to an underestimation of the charge-to-mass ratios.
Experiments
Wind tunnel
Our experiment was conducted in the cryogenic wind tunnel in the Cryospheric Environment Simulator (CES) of the Shinjo Branch, Snow and Ice Research Center, National Research Institute for Earth Science and Disaster Prevention in Shinjo City, Yamagata Prefecture, Japan (Fig. 1). The working section of this wind tunnel was 14 m long, 1 m wide and 1 m high. The maximum wind velocity and the lowest temperature of the wind tunnel were 20ms–1 and –30˚C, respectively. Wind velocity was measured with a pitot tube.
Side view of the cryogenic wind tunnel installed in the CES of the Snow and Ice Research Center, NIED. The maximum wind velocity and the lowest temperature of the wind tunnel are 20ms–1 and –30˚C, respectively.

Experimental methods and conditions
We first paved the floor of the working section with compacted snow to form a 2cm thick snow bed with a flat smooth surface. We then coated the snow surface with a thin ice layer using a water spray to prevent surface erosion. This hard surface allowed us to perform all experiments under uniform surface conditions.
The snow particles used in our experiment were spherical, created previously by an artificial snow machine in the CES. After the artificial snow was crushed with a disintegrator, the particles were screened by sieves according to diameter. Blowing snow was created artificially by sieving in the wind tunnel. We measured charge-to-mass ratios using a Faraday cage, an electronic balance and an electrometer, which can measure the electrostatic charge of the snow particles trapped in the Faraday cage. The Faraday cage was installed under the floor of the working section of the wind tunnel (Fig. 2). Where there was no snow cover (see Fig. 2), we paved the surface with an ice layer created by water spray. Therefore, all surfaces around the apparatus can be assumed as equal to snow cover in terms of electrical properties.
We performed our experiments under the following conditions with 32 combinations: four patterns of air temperatures in the range –20˚C to –5˚C and eight patterns of particles with diameters 125 μm to 2 mm. We maintained wind velocity and fetch at 5 ms–1 and 11.5 m, respectively. In this experiment, the temperatures of the air and the snow surface were considered to be equal.
How to trap blowing-snow particles in the Faraday cage. The floor of the wind tunnel and the wall of the funnel are paved with an ice layer and assumed as equal to snow cover in terms of electric properties.

Results and Discussion
Particle diameter distribution
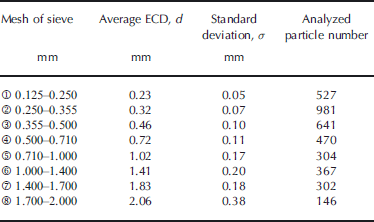
Figure 3 shows an example of a photograph taken with a microscope of snow particles trapped in the Faraday cage. We analyzed the particles with ImageJ software (Reference CollinsCollins, 2007). In this analysis, the equivalent circular diameter (ECD) was calculated for each particle. The sample ECD distributions for –15˚C are shown in Figure 4.We confirmed a similar ECD distribution in the other experiments at all temperatures. The numbers of each group described in Figure 4 correspond to the numbers in the left-hand column of Table 1. Analytical results are shown in the remaining columns of Table 1: the average ECD, d, the standard deviation, σ, and the total number of analyzed particles. Hereafter, d is used mainly in the discussion and calculations.
An example of particles trapped in the Faraday cage.

A sample of equivalent circular diameter (ECD) distribution of snow particles (experiment for –15˚C). The numbers of each group correspond to the numbers in the left-hand column of Table 1.

Results of analysis of snow particles
Charge-to-mass ratios of blowing-snow particles
In agreement with the charge-to-mass ratios measured previously, Q was negative in all cases. In this experiment, the measured values were –3.58 to –0.02 μCkg–1. The negative charge accumulation to the snow particles is assumed to have been caused by asymmetric rubbing with the snow surface (Reference Latham and StowLatham and Stow, 1967). Figure 5 shows the absolute value of Q against d. The absolute value of Q tends to increase with a decrease in d for all temperatures used in this experiment. The main factor of this tendency is assumed to be an increase of the total surface areas of particles per volume with decreasing d. This suggests a higher contribution of electrostatic charge on surface distribution rather than body distribution of ice particles.
Absolute value of charge-to-mass ratio Q against the average equivalent circular diameter (ECD) d. the absolute value of Q tends to increase with decrease in d for all temperatures.

Electrostatic charge of individual snow particles
The individual snow-particle charge, q, was calculated from Q using d of each group. The result for –15˚C is shown in Figure 6. The horizontal error bar indicates ±σ, which is shown in Table 1. The vertical error bar indicates the ranges of q calculated from d±σ values of the diameter which is supposed to occupy the group. Figure 6 shows the correlation between d and the absolute value of q. A power relationship was assumed between them, and the approximation equation is shown in Figure 6. We also confirmed a similar power relationship in all air-temperature conditions of our experimental series. The approximation equations and determination coefficients (R 2) are shown in Table 2.
Absolute value of q against d (–15˚C). Horizontal error bars indicate standard deviation σ shown in Table 1. Vertical error bars indicate the range of q calculated from d±σ. A power relationship was assumed between d and the absolute value of q, and the approximation equation is shown.

Approximation equations and determination coefficients
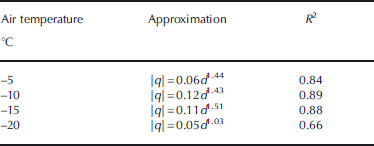
Next, we attempted to create a function to estimate q from d and air temperature, T. We assumed that the coefficient numbers shown in Table 2 are functions of T and approximated the polynomial between them, and those index numbers were averaged. The created function is

where a(T) corresponds to the approximated quadratic polynomial.
To check the consistency of the function, we performed additional experiments under the same experimental conditions: wind velocity of 5ms–1 and fetch of 11.5 m. The particle diameter used in the additional experiment was <500 μm, screened by a 500 μm mesh sieve, as Reference SchmidtSchmidt (1982) reported that almost all blowing-snow particles in nature are <500 μm.
We compared the charge-to-mass ratios Q m, measured using an electrometer, a Faraday cage and an electric balance, with the ratios Q f, calculated using the function
described above. The Q f was calculated according to the following procedures:
-
1. After the Q m was measured, snow particles trapped in the Faraday cage were analyzed and the ECD was calculated for each particle. (The distribution of ECD is shown in Figure 7.)
Fig. 7.Equivalent circular diameter (ECD) distribution of snow particles used by additional experiment (–15˚C).

-
2. The q of each particle was calculated by the function using its respective ECD and air temperature, and the results were totalled.
-
3. The weight of each particle was calculated from its respective ECD, and the results were totalled.
-
4. The total quantity of q was divided by the total particle weight.

Figure 8 shows the comparative result of Q m and Q f. Q s is discussed in the next subsection. This comparative result showed the validity of the function and that the particle diameter and the air temperature could be the key factors of charging of the snow particles.
Comparison of absolute value of charge-to-mass ratios. Q m denotes the values measured using an electrometer, a Faraday cage and an electric balance. Q f denotes the values estimated by the function using the diameter of each particle trapped in the Faraday cage. Q s denotes the values estimated by the function using the diameter of each particle detected by the snow particle counter (SPC).

Estimation of electrostatic charge using a snow particle counter
In these experiments, we discovered that smaller particles were more difficult to collect in the Faraday cage. This indicates that the smaller particles have less contribution to the measurement. Since the smaller particles have bigger charge-to-mass ratios, as shown in Figure 5, the charges measured with the Faraday cage may underestimate actual values.
We used a snow particle counter (SPC) to obtain the particle diameter distribution near the snow surface (Reference Sato and KimuraSato and Kimura, 1992). The SPC is equipped with a luminescent diode sensor. Based on electrical pulse signals that correspond to the sizes of snow particles passing through the sampling area, each signal is classified into one of the 32 classes between 50 and 500 μm. If the diameter of a snow particle is larger than that of the maximum diameter class, i.e. >500 μm, this diameter is also considered to belong to the maximum diameter class: class number 32.
Particle diameter distribution measurement was conducted using particles <500 μm, which were screened by a sieve. The sensor of the SPC was installed at the same altitude as the snow surface and just above the Faraday cage. Measured distribution, which has been calculated based on edge effect correction (Reference SatoSato, 1987; Reference Sato and KimuraSato and Kimura, 1992), is shown in Figure 9. The difference in distribution between Figures 7 and 9 shows the particle diameter dependence of the trapping rate to the Faraday cage. This suggests the possibility of underestimation of the charge-to-mass ratios, which has been reported by previous researchers who used a Faraday cage.
Particle diameter distribution of snow particles (–15˚C). The SPC classifies the snow particle into one of the 32 classes. The black bars denote approximated distribution (>500 μm).

The distribution of particle diameters largert than 500 μm was approximated by linear extrapolation and is shown by a black bar in Figure 9. Using this particle diameter distribution and the function noted ahead, the charge-to-mass ratio Q s was estimated and is shown in Figure 8. The estimation method of Q s was similar to that for Q f. Estimated values of Q s were –1.87 to –0.70 μCkg–1 under the air temperatures of –20˚C to –5˚C. It was confirmed that the Q s charge-to-mass ratios of actual blowing-snow particles are about 1.2–1.9 times larger than the Q f ratios nearly equal to Q m, which are measured using the Faraday cage.
Conclusion
Electrostatic charges of blowing-snow particles were measured, with a focus on particle diameters. The absolute values of charge-to-mass ratios tend to increase with decrease in diameter. Individual snow-particle charges were approximated by the power function of the diameter. The function derived from these results enabled the estimation of the individual snow-particle charge from the particle diameter and the air temperature. Moreover, it was demonstrated that the charges measured by the Faraday cage would be underestimated actual values.
Acknowledgements
We thank T. Machida, T. Katsushima and students of Yamagata Prefectural Shinjo Kamuro Industrial Senior High School. Their cooperation made it possible to obtain many experimental data. We also thank many researchers, technical staff and clerks at the Snow and Ice Research Center, NIED, who supported our experiments and advised us.



