I. INTRODUCTION
There has always been a desire to develop innovative techniques to control emissions from a diesel engine to meet the stringent requirements of regulating authorities. Exposure to diesel exhaust could induce various types of cancer and breathing-related ailment in humans. Catalytic conversion is one of the successful techniques developed over the years for emission control to subside carbon monoxide (CO), unburnt hydrocarbons (HC), and oxides of nitrogen (NO x ). Controlling emission from a combustion ignition engine is more complicated than a spark ignition engine unless there is a precise modification on the engine or the use of a modified fuel. Selective oxidation by catalysts is a widely used and cost-effective technique for emission reduction in light duty vehicles. Nanomaterials, because of their unique size–surface property relationship, exhibit improved properties. Metal oxides have been widely used as catalysts in many fields because of their inertness to several chemical reactions; at the same time, they can act as specific active sites for the reacting species.
Sol–gel method has been an attractive technique for the production of high-purity oxide ceramics. Similarly, electrospinning is a unique technique for the production of high aspect ratio nanofibers, with controlled morphology and diameters. The combination of sol–gel technique with electrospinning followed by calcination of the electrospun fibers results in the formation of high-purity ceramic nanofibers. In a typical sol–gel-assisted electrospinning process of ceramic nanofibers, a spinnable sol is used, which is a mixture of a polymer solution with optimum viscosity, and a metal ion or sometimes many ions (based on the composition of the ceramic fiber) and at times, a catalyst to control the rapid hydrolysis of the solution at the needle tip during electrospinning. Reference Dai, Liu, Formo, Sun and Xia1
Owing to the pertaining applications of 1-D nanostructures, a substantial number of different ceramic nanofibers starting from basic metal oxides such as ZnO, Reference He, Hsin, Liu, Chen and Wang2–Reference Stafiniak, Boratyński, Baranowska-Korczyc, Szyszka, Ramiączek-Krasowska, Prażmowska, Fronc, Elbaum, Paszkiewicz and Tłaczała5 TiO2, Reference Park, Choi, Lee, Hwang, Choi and Lee6–Reference Shengyuan, Nair, Jose and Ramakrishna8 Al2O3, Reference Azad9 In2O3, Reference Li, Li, Zhu, Feng, Chen, Guo and Ruan10 SnO2, Reference Cho, Yang, Jin, Kim, Tuller and Kim11 and Co3O4 (Ref. Reference Choi, Park and Kim12) to complex and composite oxides have been fabricated, and the applications of such nanofibers are being explored by researchers. Among these nanofibers, NiO has its own identity; it is a p-type semiconductor, known for metal–insulator transition and is also a classic example of a “Mott” insulator with a wide d–d energy gap.
Catalytic ability of NiO in oxidizing carbon monoxide has been reported in several pioneering reports in the literature. Reference El Shobaky, Gravelle and Teichner13–Reference Keyer, Semin and Bunina17 NiO as nanofibers is more interesting, because the multiple grains in nanofibers would be oriented in different directions and thus leads to peculiar properties for specific applications, such as electrodes, sensors, catalysts, etc., where the interaction of the surrounding species may vary with the crystal planes, which ultimately determine the performance of the product. In fact, the several superior behaviors of oxide nanomaterials over their bulk counterparts depend on the number of defects on its surface. In the case of nanosized oxide materials, both the surface area and the number of structural defects are high. Reference D’Souza, Richards, Rodríguez and Fernández-García18 Also, it has been proven that the behavior of NiO catalyst is purely dependent on its size and surface structure. Reference Keyer, Semin and Bunina17 The application of NiO nanomaterials is not only limited to catalysis, and also includes sensors, Reference Liu, Zhang, Wang, Li, Wang, Han, Jiang and Wei19 electrodes in supercapacitors, Reference Vijayakumar, Nagamuthu and Muralidharan20,Reference Aravindan, Suresh Kumar, Sundaramurthy, Ling, Ramakrishna and Madhavi21 electrochromic devices, Reference Purushothaman and Muralidharan22 magnetic data storage, resonance imaging, Reference Thota and Kumar23 and so on. Both neat ceramic nanofibers and nanosized-catalyst embedded polymeric nanofibers have been reported to be effective in catalyzing the degradation of harmful organic dyes from effluents of chemical industries. Reference Pei and Leung24
In this study, NiO nanofibers were fabricated by electrospinning a solution containing the mixture of poly(styrene-co-acrylonitrile) (SAN) and nickel acetate tetrahydrate (NACTH) in N,N-dimethylformamide (DMF). The interaction between the nitrile group of SAN and the carbonyl group of nickel acetate could ensure the uniform dispersion of the latter in the polymer solution. Reference Marras, Artal, Otin and Marongiu25 SAN has a good dimensional stability, thus it can sustain the homogeneity in electrospun NACTH/SAN composite nanofiber diameter throughout its length. At the same time, the bulky styrene side groups can reinforce the composite fibers, which will help transform the morphology of the composite fibers to the ceramic fibers during calcination. Also, an attempt has been made to get an insight into the fundamental features of NiO nanofibers prepared by sol–gel-assisted electrospinning by different characterization techniques. The catalytic ability of NiO nanofibers was evaluated by using it in a custom-made filter for the oxidation of carbon monoxide (CO) and hydrocarbons (HC) from the exhaust gas stream of a diesel engine.
II. MATERIALS AND METHODS
A. Materials
SAN [Grade: Santron IMS 1000, acrylonitrile content: 30%, specific gravity: 1.07, viscosity average molecular weight (
 ${\overline M _{\rm{v}}}$
): 2.46 × 10⁶ g mol−1, melt flow index (MFI): 35 g/10 min at 220 °C under a load of 10 kg, ASTM D-1238] obtained from Bhansali Engineering Polymers, Sirohi, India, NACTH (assay >98%) procured from Sigma-Aldrich, Bangalore, India, and DMF purchased from Sisco Research Laboratories Pvt Ltd, Mumbai, India, were used without further purification for producing the precursor nanofibers by electrospinning.
B. Preparation of electrospinning solution
Two grams of SAN were dissolved in 10 mL of DMF in a stoppered glass vial by continuous stirring for 4 h, and 2 g of NACTH were added into it. The mixture was stirred vigorously for 6 h to ensure uniform mixing of NACTH in SAN/DMF solution. A few drops of acetic acid were also added to the precursor solution to inhibit the sudden gelation of the mixture, and this mixture formed a spinnable sol. The ratio between SAN and NACTH was maintained as 1:1 in this study.
C. Fabrication of precursor nanofibers
Electrospinning technique was used to fabricate the precursor composite nanofibers of SAN/NACTH. The precursor sol was loaded to a 10-mL syringe attached with a hypodermic needle [inner diameter: 0.5 mm and outer diameter: 0.8 mm] chamfered at the tip. The syringe with the sol was loaded to a vertical electrospinning unit (E-Spin Nano, Physics Equipments Co, Chennai, India), and the needle was connected to a +ve DC potential. At first, the syringe pump was switched on, and then progressively increasing DC voltages were applied between the needle and a grounded metallic collector plate. The stable droplet of sol at the needle tip got accumulated with electrical charges. The synergic action of the +ve charges on the sol droplet and the high applied voltage resulted in the deposition of ultrafine fibers on the collector surface. The applied voltage was varied as 15, 17, 20, and 22 kV to obtain the minimum fiber diameter and a maximum yield of fibers. Optimum electrospinning conditions reported for SAN in the literature were used; the tip-to-collector distance was 17 cm, and the flow rate was 1000 μL h−1. Reference Senthil and Anandhan26 The grounded collector plate was wrapped with a clean aluminum foil.
D. Synthesis of NiO nanofibers
A programmable high-temperature furnace (Technico, Chennai, India) with a controllable heating rate was used to obtain the ceramic nanofibers from the electrospun precursor fibers. The precursor fiber mat that was peeled off from the aluminum foil was calcined. The heating rate was adjusted to 4 K min−1, the calcination temperature was varied as 773, 873, and 973 K, and the annealing period was fixed as 2 h. The minimum calcination temperature was based on the pyrolysis temperature of the precursor composite fibers during their thermogravimetric analysis (TGA) (EXSTAR 6000 TG/DTA 6300, Japan) in a nitrogen atmosphere at a heating rate of 10 K min−1.
E. Characterization of electrospun fibers
A scanning electron microscope (JEOL SEM, JSM-6380LA, Japan) was used to examine the morphology of the electrospun fibers before and after calcination. Energy dispersive x-ray spectroscopy (EDS) (Link ISIS-300 Micro-analytical System, Oxford Instruments, UK) attached to the scanning microscope was used for analyzing the composition of the ceramic fibers. The gold-sputtered samples (sputtered by JFC 1600 autofine coater EOL, Japan) were analyzed in SEM and their diameters were measured by an image processing and analysis program, Image-J. 27 A transmission electron microscope (TEM, CM12 PHILIPS, Netherlands) was also used to image the finer morphological features of the fibers. High-resolution TEM (HRTEM) images were obtained at an accelerating voltage of 120 kV. Fourier transform infrared (FTIR) spectra (Jasco FTIR-4200, Japan) of SAN, precursor fibers, and the calcined fibers were recorded in transmission mode by KBr pellet method in a wave number range of 400–4000 cm−1 for an average of 32 scans. The x-ray diffraction patterns (XRD) (JEOL x-ray diffractometer, DX-GE-2P, Japan) were obtained for NiO nanofibers calcined at 3 different temperatures, using Cu Kα radiation within a range of 10–80°, at a scanning rate of 0.5° min−1. UV-NIR spectra (Varian, Cary 5000 UV-NIR) of the ceramic fibers were recorded in the diffused reflectance mode in the range of 215–2400 nm. The magnetization–demagnetization curves of NiO nanofibers were recorded at 25 °C by a vibrating sample magnetometer (7404, Lake Shore Cryotronics, Inc.). Micro Raman spectra (inVia, Renishaw, UK) were collected for the samples prepared at different calcination temperatures, in the wave number range of 60–2000 cm−1 using an argon ion laser source with a power of 100 mW and a wave length of 514 nm. Specific surface area values of the NiO nanofibers were measured by the BET method, after degassing the samples for 12 h at 200 °C in a Quantachrome Autosorb Automated Gas Sorption System (Florida) at high vacuum.
F. Fabrication of catalytic filter
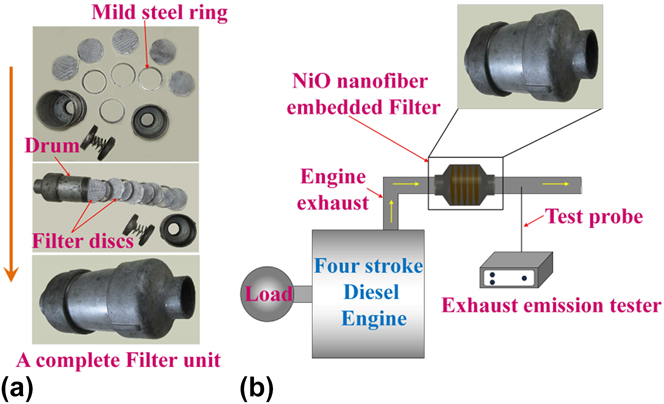
The catalytic filter disks were fabricated by the direct electrospinning of precursor fibers on thin silicate glass fibrous mats of 3-inch diameter. Silicate glass fibrous mat was used as a support for the brittle NiO nanofibers, and it is not reactive with NiO at the calcination temperatures used in this study. Reference Woo, Lee and Jung28 Spinning was performed for a constant time of 1 hour on all the mats, which resulted in a deposition of ∼200 mg of NiO nanofibers after calcinations on each mat. Five such glass mats were stalked together and sandwiched between a pair of stainless steel mesh. Finally, a filter disk was made by combining 4 such stainless steel sandwiched glass fibers. The filter disk with the precursor fibers was calcined at 773, 873 and 973 K, respectively. For a single test, 5 such filter disks were assembled in a drum of 3-inch diameter and an L/D ratio of 4, which was made of mild steel. The filter disks were placed equidistantly in the drum with the help of mild steel rings, and the last ring was attached with 2 springs to secure the disks in position as shown in Fig. 1(a), and the drum was open and threaded at both the ends and a threaded converging section enabled connection to the engine exhaust pipe. The filter unit was attached to the exhaust pipe of a 4-stroke diesel engine (DA-10, Kirloskar, Pune, India), which was connected to an AC alternator (KIRGEN, KGA-105, Kirloskar, Pune, India) to vary the load applied [Fig. 1(b)]. The catalytic behavior of the NiO nanofibrous filters was studied at different loads to mimic the on-road conditions of the engine. The exhaust gas was analyzed with the help of AVL DiGas 444 exhaust gas analyzer, Austria. All the tests were performed at 1500 rpm and at an air:fuel ratio of 14:1. The diesel fuel used was obtained from Indian oil corporation, New Delhi, India, which had a cetane number of 51.
(a) Components of the catalytic filter. (b) Schematic of the experimental setup used for the catalytic reduction.

The efficiency of a catalyst will be optimum if the residence time of exhaust gas stream is substantially high. The design of the filter module with several filter plates placed equidistantly ensures longer exposure of the gases to the catalyst. The efficiency of the NiO catalyst depends on its surrounding temperature, the adsorption sites on its surface, the duration of its exposure to the exhaust gas, the availability of oxygen, and sometimes the other species that is present in the exhaust gas, which may either promote catalysis by active interaction with the pollutant species or demote it by occupying the active sites on the catalyst. Considering the design of our catalytic filter, understanding the oxidation of individual species and the interaction of species present in the exhaust gas is difficult, and such a study cannot replace the real scenario, because the exhaust from a conventional engine has a number of species that one cannot account. Therefore, we had limited our study to estimate the extent of oxidation of CO and HC present in the diesel engine exhaust.
III. RESULTS AND DISCUSSION
A. Characterization of precursor composite fibers
1. SEM micrographs
Figure 2 shows the SEM images of the SAN/NACTH precursor composite fibers electrospun at different voltages at a constant flow rate of 1000 μL h−1 and a tip-to-collector distance of 17 cm. A continuous network of bead-free composite fibers was obtained at all the applied voltages. The least average fiber diameter (AFD) and standard deviation (SD) were observed for fibers obtained at an applied voltage of 22 kV. Also, this spinning voltage resulted in maximum collection of fibers on the collector plate per unit time. A narrow diameter distribution of fibers in the histogram was an important criterion for the selection of operating conditions for electrospinning. Coefficient of fiber uniformity (C FU) is also a measure of fiber diameter distribution, and it approaches unity when the distribution is uniform, Reference Yener and Jirsak29
 $${C_{{\rm{FU}}}} = {{{A_{\rm{w}}}} \over {{A_{\rm{n}}}}}\quad {\rm{,}}$$
where,
 $${A_{\rm{n}}} = {{\sum {{n_{\rm{i}}}{d_{\rm{i}}}} } \over {\sum {{n_{\rm{i}}}} }}\quad {\rm{,}}$$
 $${A_{\rm{w}}} = {{\sum {{n_{\rm{i}}}} d_{\rm{i}}^2} \over {\sum {{n_{\rm{i}}}{d_{\rm{i}}}} }}\quad {\rm{.}}$$
Secondary electron micrographs and histograms (40 fibers) of electrospun SAN/NACTH composite fibers obtained at different applied voltages (15, 20, and 22 kV). The micrographs are at ×5000 magnification in a 5-μm scale. The AFD, SD in fiber diameter (SD), CFU, and percentage fibers with diameter less than 200 nm are also shown.

d i is the fiber diameter and n i is the number of fibers with a diameter d i. At higher applied voltages, C FU values get closer to unity and SD of fiber diameter is the minimum (Fig. 2). A decrease in the AFD and the SD occurred with an increase in applied voltage. The applied voltage induces electric charges to the solution droplet at the needle tip, which in turn results in the drawing of nanofibers. When applied voltage is increased, more charges get accumulated at the liquid jet surface, which results in thin fibers because of swifter drawing.
When the applied voltage is increased above 22 kV, thinner fibers were obtained, but fewer fibers were collected on the collector plate. At high voltages, several points adjacent to the collector plate inside the electrospinning chamber got negatively charged and acted as collector points and the reproducibility of fibers collected on those points was not feasible because such fibers do not satisfy the operating conditions. Thus, 22 kV, 1000 μL h—1, and 17 cm tip-to-collector distance were chosen as the optimum process conditions for the production of precursor composite fibers.
2. Thermogravimetric analysis (TGA)
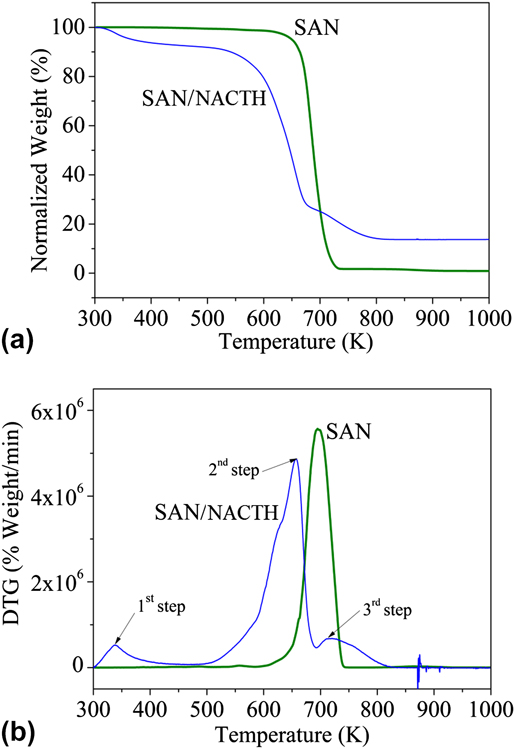
The TGA and DTG plots of SAN and SAN/NACTH are shown in Figs. 3(a) and 3(b), respectively. SAN exhibits single-step degradation, whereas SAN/NACTH composite exhibits 3-step degradation before it is completely transformed to NiO. For SAN, the onset of degradation is at 663 K and the degradation is completed at 773 K. The reduction in weight at 473 K in the SAN/NACTH composite is due to the removal of water from NACTH, and the degradation of SAN is accelerated in the presence of NACTH. This is because of the release of acetic acid at the early stages of degradation of NACTH as in Eq. (4) and its catalytic effect in degrading SAN. Reference Scheirs30 The final step in the degradation of the composite that has an onset temperature 700 K can be linked to the conversion of NiCO3 to NiO as in Eq. (6). The overall conversion of NACTH to NiO is briefed in the following equations [Eqs. (4)–(6)] Reference De Jesus, González, Quevedo and Puerta31 :
 $${\rm{Ni}}{\left( {{\rm{C}}{{\rm{H}}_3}{\rm{COO}}} \right)_2} \cdot 4{{\rm{H}}_2}{{\rm{O}}_{({\rm{s}})}} \to \,\,0.86{\rm{Ni}}{\left( {{\rm{C}}{{\rm{H}}_3}{\rm{COO}}} \right)_2} \ .0.14{\rm{Ni}}{\left( {{\rm{OH}}} \right)_{2({\rm{s}})}} + 0.28{\rm{C}}{{\rm{H}}_3}{\rm{COO}}{{\rm{H}}_{({\rm{g}})}} + 3.72{{\rm{H}}_2}{{\rm{O}}_{({\rm{g}})}}\quad {\rm{,}} \cr}$$
 $${\rm{Ni}}{\left( {{\rm{C}}{{\rm{H}}_3}{\rm{COO}}} \right)_2}{({\rm OH})_{2({\rm{s)}}}} \to {\rm{NiC}}{{\rm{O}}_{3({\rm{s)}}}} +\; {\rm{C}}{{\rm{H}}_3}{\rm{COC}}{{\rm{H}}_{3({\rm{g}})}} + {{\rm{H}}_2}{{\rm{O}}_{({\rm{g}})}}\quad {\rm{,}}$$
 $${\rm{NiC}}{{\rm{O}}_{3({\rm{s)}}}} \to {\rm{Ni}}{{\rm{O}}_{({\rm{s}})}} + {\rm{C}}{{\rm{O}}_{2({\rm{g}})}}\quad {\rm{.}}$$
(a) TGA and (b) DTG plots of SAN and SAN/NACTH composite fibers.

3. FTIR spectroscopy
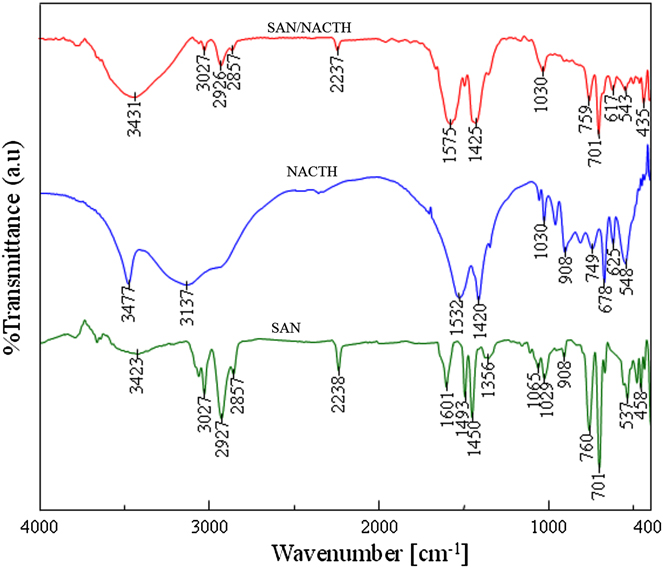
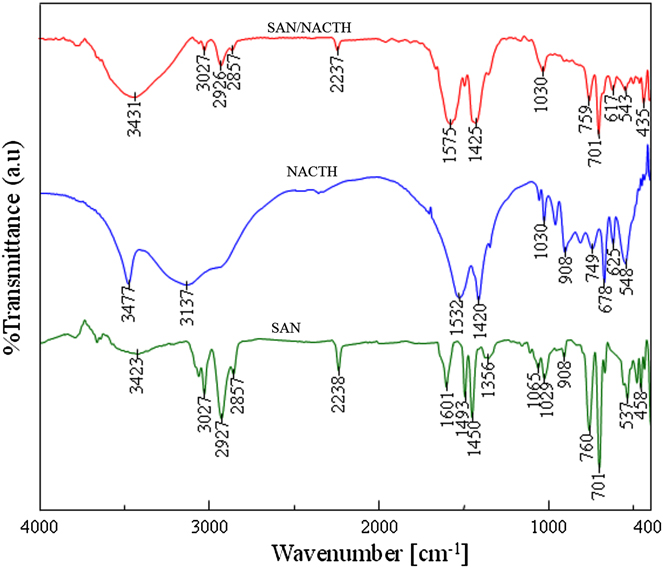
The interaction between SAN and NACTH in the xerogel fiber is important in the formation of NiO fibers. FTIR spectra of SAN, NACTH, and SAN/NACTH composite fibers, shown in Fig. 4, were used to ascertain the interaction between the precursors. In SAN, the peaks at 3423, 3027, 2927, and 2857 cm−1 are attributed to the OH stretching of physisorbed water, C–H stretching in styrene ring, symmetric, and symmetric vibrations of C–H in CH2 and CH3, respectively. The peak at 2238 cm−1 is assigned to C≡N stretching. The peaks at 1601 and 1450 cm−1 correspond to C=C vibration and stretching in styrene ring, respectively. The peaks at 1493 and 1356 cm−1 are due to –CH2– and CH3 deformation, respectively. The peaks 1065, 1029, and 908 cm−1 are due to −C–H in-plane deformation, and those at 760, 701, 537, and 458 cm−1 are due to −C–H out-of-plane deformation in styrene ring, respectively. Reference Mistry32 In NACTH, the peaks at 3477 and 3137 cm−1 are due to OH stretching of crystallized water and a combined peak of OH stretching and CH stretching in the acetate, respectively. The peaks at 1532 and 1420 cm−1 are attributed to C=O in ionized acetate and C–H deformation in the acetate, respectively. The numerous peaks between 1030 and 548 cm−1 are due to CH deformation. In comparison with the FTIR peaks of pure SAN and NACTH, the peaks in SAN/NACTH composite were contributed by SAN and NACTH. It is worthwhile to note that the peak corresponding to C=O (1532 cm−1) in NACTH was shifted to a higher wave number (1575 cm−1) in SAN/NACTH composite, and intensity of the peak corresponding to C≡N stretching was reduced remarkably in the latter as compared with pure SAN. Therefore, the interaction between nitrile group of SAN and the carbonyl group of nickel acetate in the precursor composite fibers is confirmed.
FTIR spectra of SAN and SAN/NACTH composite fibers.
B. Characterization of nickel oxide (NiO) nanofibers
1. SEM micrographs
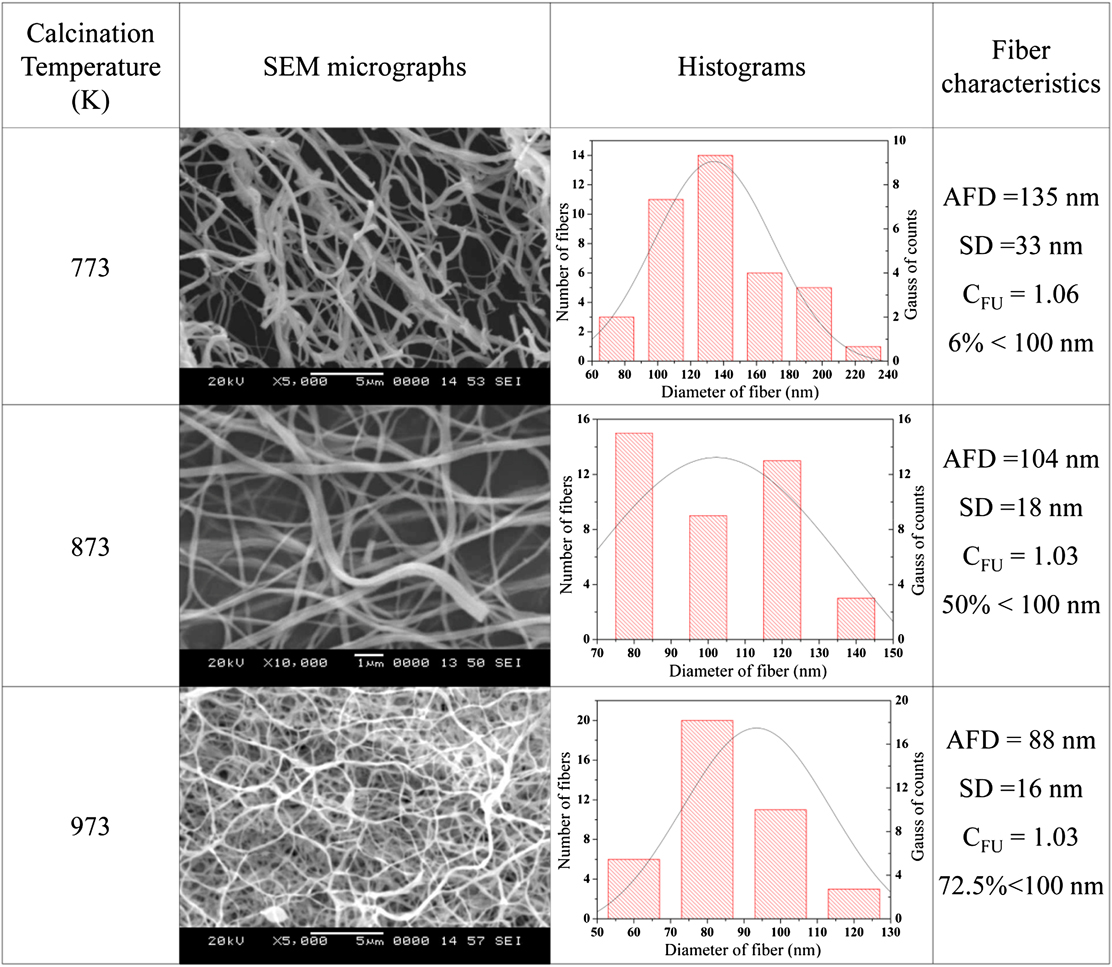
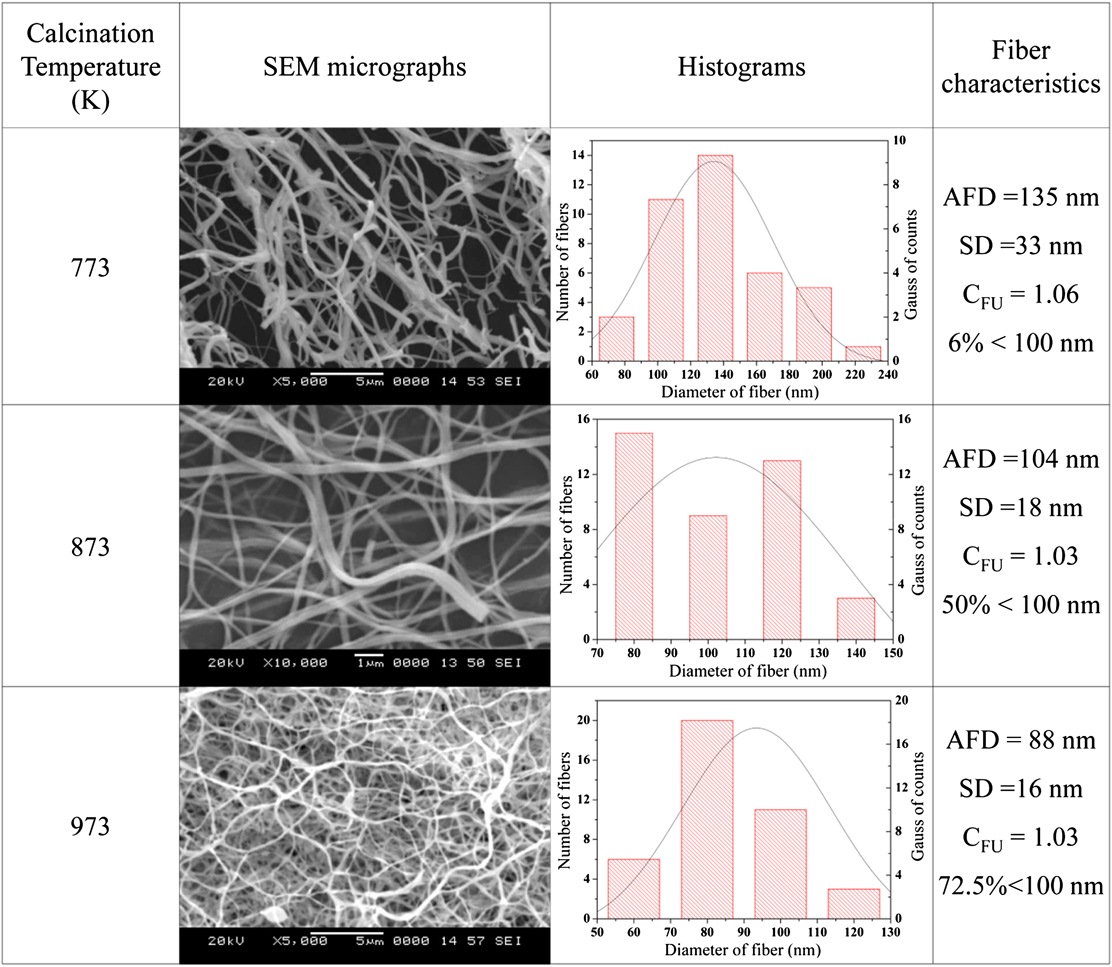
Figure 5 shows the SEM images and the corresponding histograms of NiO ceramic nanofibers obtained at different calcination temperatures. The AFD values of the ceramic fibers are lower than those of the precursor composite fibers because of the removal of the base polymer and organic part of NACTH. AFD of NiO nanofibers tends to decrease with an increase in the calcination temperature because of the thermally induced grain growth and densification of the NiO fibers. The AFD of the ceramic nanofibers were 134, 104, and 88 nm when the annealing temperatures were 773, 873, and 973 K, respectively. Of note, 72.5% of the ceramic fibers calcined at 973 K had diameters less than 100 nm. The C FU of the nanofibers at different calcination temperature were calculated and are shown in Fig. 5.
SEM micrographs of NiO fibers obtained after calcination at 773, 873, and 973 K and the corresponding histograms for a count of 40 fibers.
2. FTIR spectroscopy
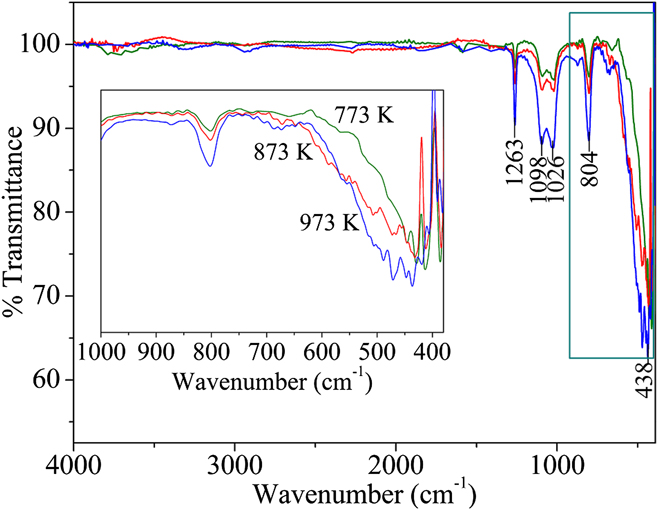
In Fig. 6, the peaks in the rage 480–400 cm−1, which originate from the stretching vibrations of the Ni–O covalent bond, confirm the formation of NiO. Also, it should be noted that there were no peaks corresponding to organic groups, indicating the complete elimination of the organic components during calcination. But the presence of other peaks corresponds to the adsorbed O2 species (O2 −) on NiO (1263, 1094, 1023, and 804 cm−1). Reference Platero, Spoto, Coluccia and Zecchina33 It is important to note that these peaks, which appeared in the FTIR spectra of NiO, were not seen in the FTIR spectrum of SAN/NACTH composite fibers.
FTIR spectra of NiO nanofibers obtained after calcination at 773, 873, and 973 K, respectively.

In general, nickel oxide cannot be obtained in its pure form when it is produced by heating in atmospheric conditions. In the real scenario, pure stoichiometric NiO has a light green color, but the NiO nanofibers obtained by us were black and the reason being the presence of nonstoichiometric excess oxygen in NiO. Reference Dong, Suk and Hosun34 Peak widening with calcination temperature is also clear in the FTIR peak corresponding to Ni–O, and it is due to the thermally induced grain growth in fibers.
3. EDS analysis
Table I shows the SEM-EDS results of NiO nanofibers obtained by calcining the SAN/NACTH composite fibers at 773, 873, and 973 K, respectively. The atomic and mass percentages of nickel and oxygen in NiO nanofibers were compared with their theoretical values as shown in Table I. As per the molecular structure of NiO, theoretical atomic percentages of both oxygen and nickel are 50%, and the corresponding mass percentages are 21.42 and 78.58%, respectively, for oxygen and nickel.
Measured values of mass percentage and atomic percentage of NiO in the nanofibers calcined at 773, 873, and 973 K along with their theoretical values.

From Table I, it is evident that nickel and oxygen content in the fibers approach their theoretical values at a calcination temperature of 973 K. The deviations in atomic and mass percentages of elements from the theoretical values are appreciable at each calcination temperature, and especially this is true at lower calcination temperatures.
4. XRD analysis
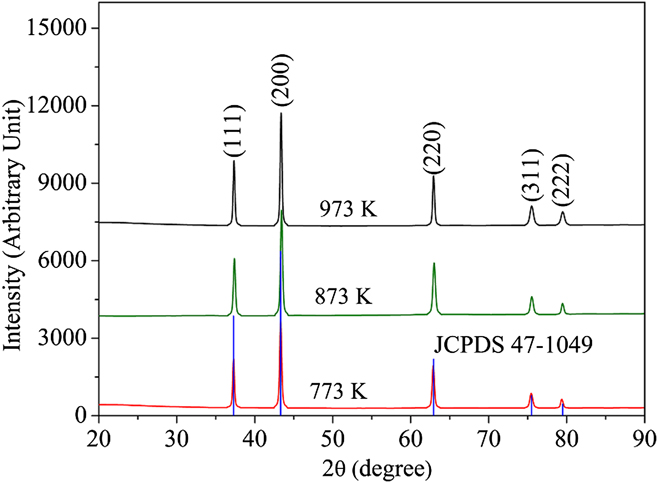
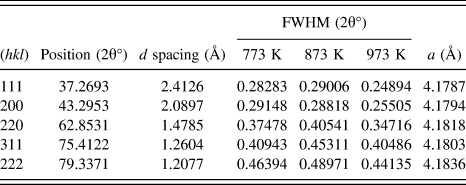
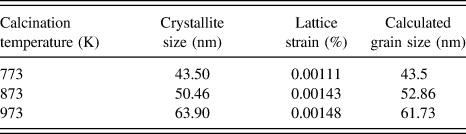
Figure 7 shows the XRD diffraction patterns of NiO obtained at calcination temperatures of 773, 873, and 973 K along with the line diffraction pattern of NiO from the JCPDS database. The characteristic crystallographic peaks of NiO are seen in the XRD diffraction patterns because the complete combustion of organic phases and conversion to NiO took place at the calcination temperatures used in this study. NiO adopts a halite (NaCl) structure. The crystallinity of NiO is substantiated by the sharp peaks in the XRD patterns, which are at the Bragg's angles, 37.2, 43.3, 62.9, 75.5, and 79.5° assigned to the (111), (200), (220), (311), and (222) planes of reflection of NiO, respectively. The d-spacing and FWHM with respect to the angles are given in Table II, for different calcination temperatures.
X-ray diffractograms of NiO calcined at 773, 873, and 973 K and JCPDS 47-1049 line plot of NiO. The planes corresponding to each peak are shown in brackets.

Crystalline parameters of NiO nanofibers calcined at 773, 873, and 973 K.

The lattice parameter was calculated using the formula
 $${1 \over {{d^2}}} = {{\left( {{h^2} + {k^2} + {l^2}} \right)} \over {{a^2}}}\quad {\rm{.}}$$
The lattice parameter value of NiO calculated from XRD results matches with its theoretical value for NiO with cubic structure. The approximate crystallite or grain sizes and microstrain induced in the crystallites of the NiO fibers were calculated by the Williamson–Hall method. In Williamson–Hall method, strain-induced broadening arising from crystal imperfections and distortion are also considered. Reference Zak, Abd Majid, Abrishami and Yousefi35 Therefore, the peak width at half-maximum intensity in Williamson–Hall method is
 $${\beta _{hkl}} = {\beta _{\rm{s}}} + {\beta _{\rm{D}}}\quad {\rm{,}}$$
 $${\beta _{hkl}} = \left( {{{k\lambda } \over {D\cos \theta }}} \right) + 4\varepsilon \tan \theta \quad {\rm{.}}$$
Rewriting Eq. (9),
 $${\beta _{hkl}}\cos \theta = \left( {{{k\lambda } \over D}} \right) + 4\varepsilon \sin \theta \quad {\rm{.}}$$
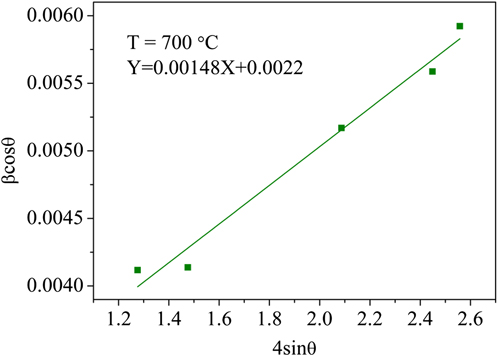
The plot of βcosθ versus 4sinθ for the NiO nanofibers obtained at 973 K is shown in Fig. 8. From the y intercept of the linear fit, the crystallite size was calculated; lattice strain was obtained from the slope of the linear fit. The lattice strain and the crystallite sizes were calculated for each calcination temperature, and their values are presented in Table III.
Williamson–Hall plot for determining crystallite size and lattice strain in the NiO nanofiber obtained at 973 K.

Crystallite size and lattice stain from XRD diffraction patterns and calculated grain sizes of NiO nanofibers.

5. TEM analysis
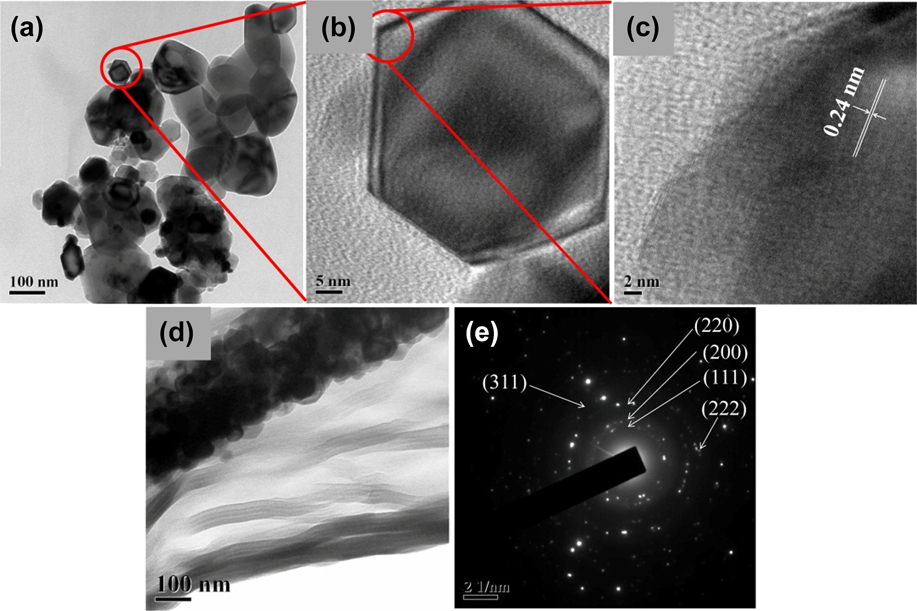
TEM [Figs. 9(a) and 9(b)] and HRTEM images [Figs. 9(c) and 9(d)] of the fibers reveal that the NiO nanofibers comprised nanoparticles produced during the calcination process at 773 K; the surface smoothness of precursor nanofibers was lost and the calcined nanofibers had rough surfaces [Fig. 9(d)]. It is also clear that the particles, which make up the fibers, were irregular in shapes. Some of them were polygonal, some were elliptical, and some others possessed intricate shapes also. It is interesting to note that some of these crystals are perfectly hexagonal; it is due to the NiO crystals derived from β-Ni(OH)2 crystals. The formation of Ni(OH)2 was depicted in Eq. (4), and the β-Ni(OH)2 crystals exist as hexagonal platelets because β-Ni(OH)2 has a hydrotalcite structure with a hexagonal symmetry that has a low system energy. Reference Qi, Qi, Li and Lu36 During the thermal decomposition of β-Ni(OH)2 to NiO, the hexagonal shape was retained. The scattered diffracted speckles and the discontinuity in ring-type diffraction pattern of the fibers in Fig. 9(e) revealed the polycrystalline nature of these fibers. The diffracted rings in the selected area electron diffraction (SAED) pattern are assigned to various planes as shown in Fig. 9(e), which correspond to a typical NiO crystal.
(a) Individual grains in a NiO nanofiber after ultrasonication. (b) A single hexagonal grain. (c) High-resolution image of (b) showing the d-spacing corresponding to (111) plane. (d) A single NiO nanofiber and (e) SAED pattern of the NiO nanofiber (All these images are for a nanofiber calcined at 773 K).

a. Mechanism of fiber formation and grain growth
We propose a plausible mechanism for the formation of nano NiO fibers with grains of different shapes and size as interpreted from the XRD and TEM results. At first, the degradation of NACTH takes place to form NiO nucleates, and these NiO nucleates, in turn, grow further by the addition of ions into them. At a certain point, the crystals are grown to their full-fledged size, where they are in contact with each other and cannot grow any further. Because the sizes of these crystals are in the range of few nanometers, they will sinter at low temperature. During the sintering process, material transport takes places from a surface of high chemical potential or positive curvature to a surface of low chemical potential or negative curvature. As sintering progresses, the shape of the crystals changes, and at the core of the fiber, it will attain a polygonal shape and elliptical or other intricate shapes at the surface of the fibers as we have observed in the TEM micrographs.
The crystallite size increases with the calcination temperature as shown in Table III. Temperature is the driving force for the grain growth in NiO nanofibers. At nanoscale, the atoms at the grain boundaries are loosely bound because of the misfit among the crystallographic orientation between 2 lattices. Reference Gleiter37 During thermal activation, ions or atoms diffuse across the grain boundaries of the crystals, and the diffusion takes place within interatomic distances. The growth of larger grains happens at the expense of the smaller ones because the diffusion of atoms takes place from a grain with high surface energy to that with a low surface energy. Smaller grains have high surface energies than bigger ones. Temperature-assisted grain-growth process involves diffusion, which can be explained by Arrhenius equation Reference George and Anandhan38 as shown in Eq. (11):
 $$D = A\exp \left( {{{{E_{\rm{a}}}} \mathord{\left/ {\vphantom {{{E_{\rm{a}}}} {RT}}} \right. \kern-\nulldelimiterspace} {RT}}} \right)\quad {\rm{,}}$$
where, D is the average grain size, A is the pre-exponential factor, E a is the activation energy for atomic/ionic diffusion around the grain boundary, R is the universal gas constant, and T is the absolute temperature. In general, nanomaterials have high a surface energy, and there is always a tendency for them to reduce it. When calcination temperatures are above the formation temperature of NiO, its rate of grain growth is significant than that of its chemical reaction with the surrounding gases because the activation energy for grain growth is lower than that of any other chemical reaction. It is also important to note that at nanoscale, the activation energy for grain growth is very small (10.94 kJ mol−1) than in the bulk state (110 kJ mol−1). Reference Iida39 Considering E a as 10.94 kJ mol−1 (Ref. Reference Choi, Park and Kim40) and R as 8.314 J K−1 mol−1 for a calcination temperature of 773 K, which has a crystallite size of 43.5 nm, the value of the constant A in Eq. (11) was calculated as 238.65 nm K−1. The value of A was used to calculate the crystallite sizes for the samples calcined at 873 and 973 K (Table III). The dependence of grain size on calcination temperature is proved from the values in Table III.
6. Magnetic properties
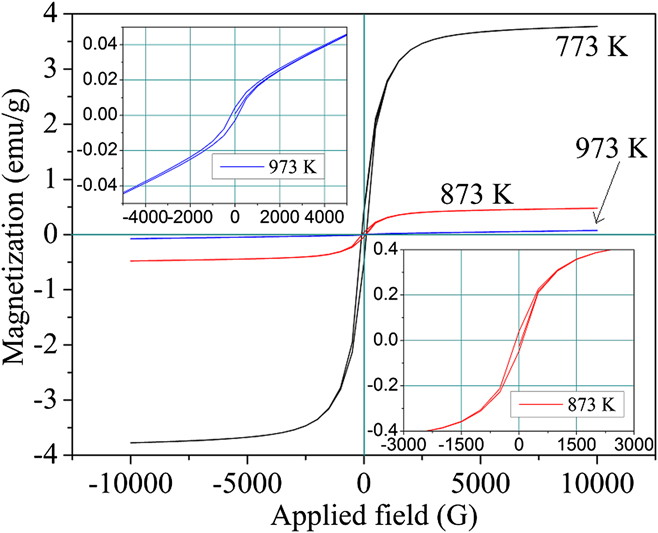
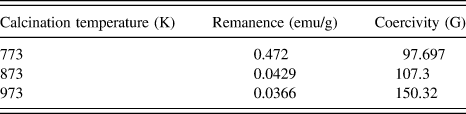
The magnetization–demagnetization curves of the NiO nanofibers obtained at different calcination temperatures are shown in Fig. 10. A high surface area of nanofibers indeed affects their magnetic behavior as compared with bulk, because in nanomaterials, the percentage of atoms on the surface is appreciably higher than that in a bulk material. Thus, atoms at the surface of a nanomaterial determine the overall electronic, magnetic, and structural properties of the material, and the uncompensated spins arising from the surface determine the magnetic property of a material at nanoscale. All the NiO fibers exhibited soft ferromagnetic behavior (Fig. 10, Table IV) because their hysteresis loops are narrow; and the maximum size of hysteresis loop was observed in the sample calcined at 773 K and the size of hysteresis loop was waning as the calcination temperature was increased. The magnetic behavior of the nanofibers calcined at 973 K closely matched with that in previous reports on the nanoparticles with similar grain sizes prepared by a method akin to the current method. Reference Thota and Kumar23 The anomalous improvement in the magnetic properties of samples calcined at 773 and 873 K from that of fibers obtained at 973 K is due to the nonstoichiometry in the Ni and O elements in the fiber prepared at those temperatures. In other words, this is due to the cation defect in the crystal structure of NiO, as evidence by the EDS results of these fibers (Table I). This is similar to defect engineering, where vacancies are created intentionally and they give rise to magnetic moments, as the vacancy of a cation is ferromagnetic in nature. Reference Zhang, Ogale, Yu, Gao, Liu, Ghosh, Das, Wee, Greene and Venkatesan41 In addition to that, the magnetic behavior manifested by Ni2+ ions in their regular lattice sites increases the magnetism atypically in nanofibers with cation defects. Reference Zhang, Yu, Yu and Tang42
Magnetization–demagnetization curves at 25 °C of the NiO nanofibers calcined at 773, 873, and 973 K in a varying applied field.

Saturation magnetization of NiO nanofibers at 25 °C.

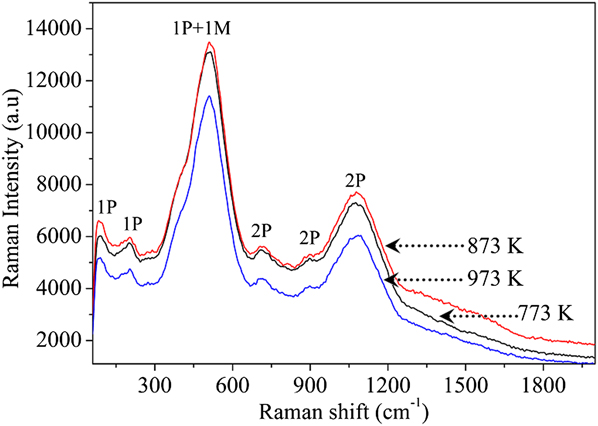
7. Raman spectroscopy
The Raman spectra of (Fig. 11) NiO nanofibers obtained at different calcination temperatures were compared with those of a single crystal NiO reported elsewhere. Reference Mironova-Ulmane, Kuzmin, Steins, Grabis, Sildos and Pärs43 The bands correspond to 1-phonon (1P) TO and LO modes (at ∼85, 196, and 508 cm−1), 2-phonon (2P) 2TO modes (at ∼714 cm−1), TO + LO (at ∼892 cm−1), and 2LO (at ∼1078 cm−1) modes. The 2P vibrations were dominant in the case of stoichiometric NiO single crystal, but the vacancies could influence the intensity of the vibration frequencies. The vacancies in the nanofibers would decay the 2P intensities, and thus, improvement was observed in the intensity of peaks corresponding to the 1P bands. Also, the new peaks (at ∼85 and ∼196 cm−1) corresponding to the 1P vibrations in the NiO fibers, which were absent in the bulk NiO, were due to the cation vacancies in the former. Reference Wipf, Klein and Williams44 The broad 2-magnon band, which often appears at ∼1500 cm−1 because of the antiferromagnetic nature of NiO, Reference Mironova-Ulmane, Kuzmin, Grabis, Sildos, Voronin, Berger and Kazantsev45 has vanished in the case of NiO nanofibers in this study because of the nonstoichiometric ratio of nickel and oxygen. Reference Bazhenov, Maksimov, Pronin, Tartakovskii and Timofeev46 Ultimately, the disappearance of the 2-magnon band leads to the transition of antiferromagnetic to ferromagnetic behavior of the fibers at room temperature.
Raman spectra of NiO fibers calcined at 773, 873, and 973 K.

8. UV-Vis-NIR spectral analysis
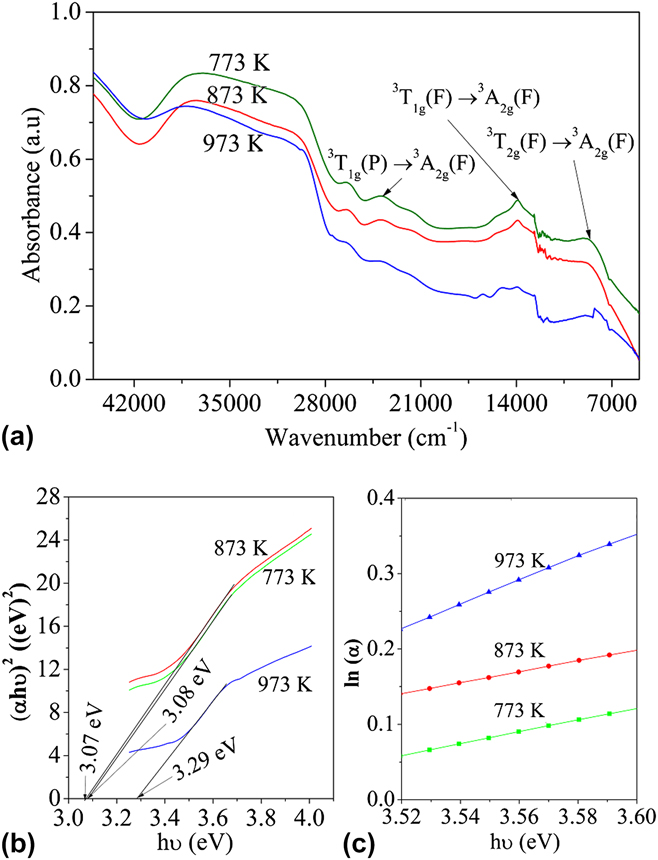
The UV-Vis-NIR absorbance spectra of NiO nanofibers calcined at different temperatures are shown in Fig. 12(a). The d–d transitions in Ni2+ in octahedral coordination are shown in Fig. 12(a). Reference Platero, Spoto, Coluccia and Zecchina33
 $$^3{T_{2{\rm{g}}}}(F){ \to ^3}{A_{2{\rm{g}}}}(F)\quad 8700 {\rm{c}}{{\rm{m}}^{ - 1}}\quad ,$$
 $${}^3{T_{1{\rm{g}}}}(F) \to {}^3{A_{2{\rm{g}}}}(F)\quad 14,900{\rm{ c}}{{\rm{m}}^{ - 1}}\quad ,$$
 $${}^3{T_{1{\rm{g}}}}(P) \to {}^3{A_{2{\rm{g}}}}(F)\quad 24,000{\rm{ c}}{{\rm{m}}^{ - 1}}\quad .$$
(a) UV-NIR spectra of fibers calcined at 773, 873, and 973 K. (b) Tauc plots of NiO nanofibers. (c) Calculation of Urbach energy of NiO nanofibers.

The band gap energy values of the NiO nanofibers calcined at different temperatures were obtained by finding the intercept of the liner part in the Tauc plot of (αhν)2 versus hν [Fig. 12(b)]. Where, α is the absorption coefficient, h is the Planck's constant, and ν is the frequency of the photon.
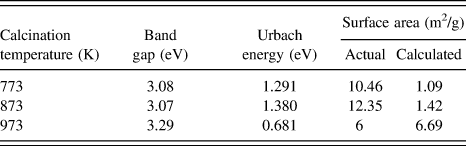
The band gap energies of the fibers calcined at 773 and 873 K are smaller than those of the fibers calcined at 973 K. The changes in the band gap energy of the fibers are attributed to the cation vacancies in the fibers obtained at low calcination temperature, which was also observed in the EDS results and magnetic property measurements. The presence of defects in NiO fibers leads to the formation of Urbach tail, a modification of the band gap due to the existence of defects. In the presence of defects, the energy of the conduction band is dwindled and that of the valance band is increased. Reference Choudhury, Dey and Choudhury47,Reference Boubaker48 The Urbach energy was calculated by finding the reciprocal of the slope of the linear region in the plot of ln(α) versus hν [Fig. 12(c), Table V]. The increase in Urbach energy for the samples with low band gap confirms the postulate on defect-induced reduction in band gap in those samples.
Band gap energy, Urbach energy, and actual and calculated surface area values of the NiO nanofibers calcined at 773, 873, and 973 K.

9. BET surface area
The specific surface area values of the fibers obtained at different calcination temperatures are presented in Table V. The least surface area was observed for the fibers calcined at 973 K. The specific surface area values of the fibers obtained at 773 and 873 K were higher than those obtained at 973 K. As the grain size increases, the surface area obviously decreases because the number of grains per unit gram of the fibers is low for the fibers with larger grains; moreover, at high calcination temperatures, the degree of sintering of grains is more, and the thus obtained fibers will be dense.
The specific surface area values of the NiO nanofibers were calculated by mathematically assuming that the fibers have a smooth surface, and the calculated surface area values are shown in Table V. Therefore, the theoretical density of a crystalline material is,
 $$\rho = {{nM} \mathord{\left/ {\vphantom {{nM} {v{N_{\rm{0}}}\quad {\rm{,}}}}} \right. \kern-\nulldelimiterspace} {v{N_{\rm{0}}}\quad {\rm{,}}}}$$
where, n is the number of atoms per unit cell, M is the molecular weight, v is the volume of the unit cell, and N 0 is the Avogadro's number.
Theoretical density of NiO (ρ) from Eq. (12) is 6.79 g cm−3. Considering the theoretical density, and assuming a minimum nanofiber length of 100 μm from the SEM micrographs of NiO nanofibers, the surface area was calculated as follows: The mass of a random fiber (m) (with a known AFD is ρ × v, where v is the volume of the fiber) is 4.13 × 10⁻¹² g. Therefore, the surface area of a nanofiber is 2.76 × 10⁻⁷ cm2, and the surface area per gram of fiber is 6.69 × 104 cm2 g−1.
The actual and calculated values of the surface area of the ceramic fibers calcined at 973 K are very close, whereas the actual surface area values of the fibers calcined at 773 and 873 K are higher than the corresponding calculated values. Therefore, it can be concluded that because of the grain growth and densification of fibers at 973 K, the fiber surface became smooth and its surface area is matching with the surface area of smooth fibers. In the case of fibers obtained at 773 and 873 K, the fibers are not dense and the pores between the grains increase the surface area of the fibers 10 times greater than that of smooth fibers.
C. Evaluation of the catalytic behavior of NiO nanofibers
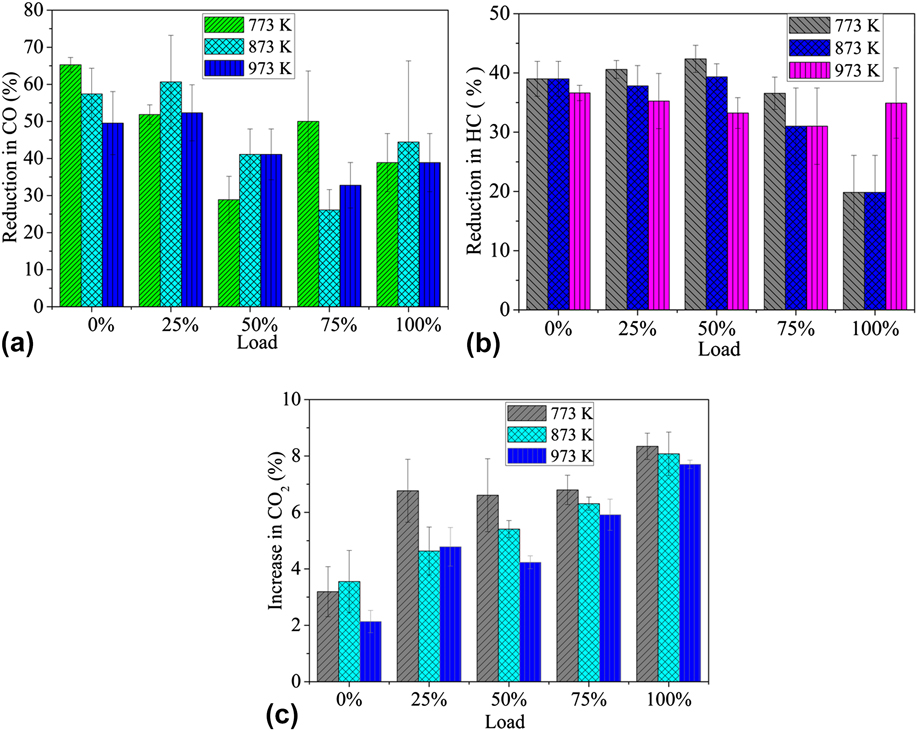
Figure 13 shows the percentage conversions of carbon monoxide (CO) and hydrocarbons (HC) and the increase in CO2 in the exhaust emission of a diesel engine when the NiO nanofiber loaded filters were used as a catalyst bed. The % conversions were calculated by comparing the change in CO, HC, and CO2 emissions from the engine with and without the filter unit attached. The subsequent reduction in CO and HC is appreciated with a simultaneous increase in the emission of CO2. During the catalytic activity study, the temperature of the exhaust gas was 80 °C, and ∼5 g of NiO nanofibers were present in the whole filter. The percentage reduction in CO and HC was considered as the preliminary proof for the catalytic behavior of NiO nanofibers in reducing the exhaust emission from a diesel engine. The overall maximum CO reduction was observed in the sample calcined at low temperature, where the numbers of hypothesized defects are more to accommodate more quantity of oxygen rather that the NiO fibers obtained at 973 K. Also, the samples calcined at low temperature have a high surface area, but an increase in the surface area does not play a significant role on the catalytic behavior of the nanofibers as observed here. Maximum conversion was observed for fibers calcined at 773 K, whereas maximum surface area was observed for the fibers calcined at 873 K, as in Table V.
Percentage conversion of (a) CO and (b) HC (c) percentage increase in CO2 in emission when the filters with NiO nanofibers calcined at different temperatures are used.

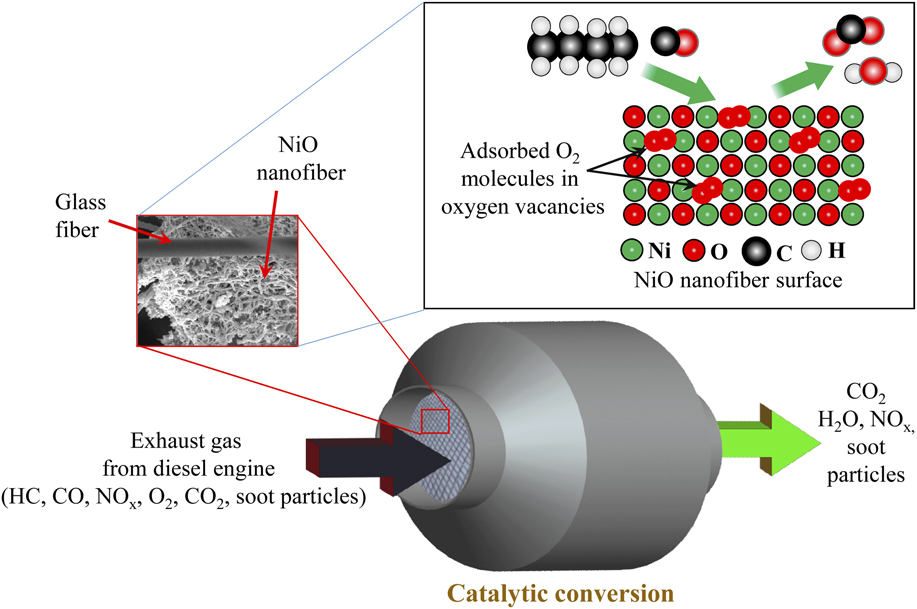
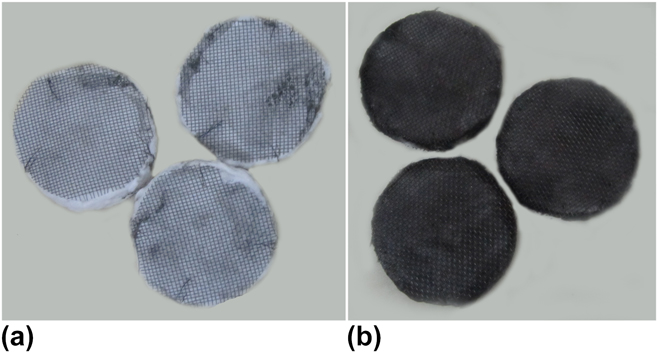
The catalytic ability is dependent on the surface defects and the energy distribution of the adsorption sites. The adsorption sites increase dramatically with the surface area of the catalyst, when it is brought down to nanoscale from bulk. The calcination temperature is another factor that determines the number of active sites for adsorption. In this study, the irreversible adsorbed oxygen increases with the calcination temperature as it is proven from FTIR studies. Nonstoichiometric excess oxygen in NiO detected at low calcination temperature is released as the calcination temperature is increased, which may not be removed further so as to form a stable compound, leading to reduction in number of vacant sites to accommodate oxygen in the lattice. Also, the maximum defects were observed in the fibers calcined at low temperature, from the UV band gap analysis. In brief, the catalytic behavior of nanofibers in reducing the harmful components from exhaust emissions is dependent on the defective sites on the fiber surface, which enables the active adsorption of the species, which is enhanced by the calcination temperature. Eventually, the CO and hydrocarbon react with the adsorbed oxygen on the NiO catalyst surface. In diesel engine, fuel is burned in excess of air; therefore, there is always presence of oxygen in the exhaust gas, which can be adsorbed on the catalyst surface for the upcoming CO and HC oxidation. The oxidation of these gases also results in an increase in CO2 emission. Oxidation catalysts are usually accompanied by an oxygen storage medium such as ceria or alumina. Reference Gandhi, Graham and McCabe49 But, in this study, the NiO nanofibers themselves acted as oxygen storage medium and, at the same time, as oxidative catalyst for CO and HC. The oxidation of CO and unburnt HC on the surface of the NiO nanofibers is schematically represented in Fig. 14. Unfortunately, NiO nanofibers are ineffectual in reducing NO x and soot particles, but the carbonaceous soot particles from the exhaust gas were entrapped in the filter disks, which in turn changes the color of the filter disk as shown in Fig. 15.
Schematic showing the oxidation of CO and unburnt HC on the surface of NiO nanofibers.

Photographs of filter disks (a) before the test and (b) after the test.

From this study, it is worthwhile to note that NiO nanofibers are potential materials for the catalytic oxidation of CO and HC. The catalytic efficiency of the NiO nanofibers is less as compared with the commercial catalytic converters with noble metal or rare earths as catalyst, Reference Gandhi, Graham and McCabe49,Reference Shelef and McCabe50 but efficient use of noble metals in automotive catalyst is always challenging. Maximum possible efficiency by NiO nanofibers can be achieved by optimizing the quantity of the NiO nanofiber used; also, the NiO nanofiber–based convertor is cost effective, and it explores the possibility of using other metal oxide nanofibers for such applications.
IV. CONCLUSIONS
In summary, magnetic NiO nanofibers were successfully fabricated through a sol–gel combined electrospinning process. The composite fibers with smallest AFD were obtained at an applied voltage of 22 kV, tip-to-collector distance of 17 cm, flow rate of 1000 μL h−1, and a solution concentration of 20 wt%. After calcination, the NiO nanofibers diameter was reduced significantly as compared with precursor composite fibers. The presence of cationic defects in the fibers made a difference in band gap energy as obtained from UV spectra analysis, changed the room temperature magnetic property of NiO, and resulted in the appearance of new vibrational bands in Raman spectra. TEM images revealed the crystals with different shapes that constitute the NiO fiber, and a mechanism was successfully proposed for the occurrence of these shapes. The nanofibers exhibited high surface area in BET surface area analysis. The supported NiO nanofibers were capable in oxidizing the hazardous gases such as CO and HC from the exhaust gas from a diesel engine. The defects on the NiO nanofiber surface act as the adsorption sites for the reacting species. Average catalytic conversion efficiencies of ∼50% for CO and ∼40% for HC were achieved in this study.
ACKNOWLEDGMENTS
G.G. would like to thank the Department of Metallurgical and Materials Engineering, National Institute of Technology of Karnataka (NITK), India, for the research fellowship. The authors thank Ms. U. Rashmi and Mr. T. Senthil for their kind assistance in scanning electron microscopy and x-ray diffraction, respectively. CIF, Pondicherry University, India, is acknowledged for its kind assistance in Raman spectra and VSM studies of the samples. The authors are very grateful to STIC, Cochin, India for the UV-Vis-NIR analysis of the samples. Authors would like to thank Dr. G.N. Kumar and his research student Mr. Parasuram Bedar, Department of Mechanical Engineering, NITK, India, for providing support for the catalytic filtration studies. The authors also thank Dr. I. Regupathi, Department of Chemical engineering, NITK, for providing the TGA facility and Mr. Ranbir Bosu, Central Research Facility, IIT Kharagpur, for the TEM analysis of the samples.
Funding information: This research received no specific funding from any funding body.