1. Introduction
The Kyoto Protocol and the Marrakech Accords (an agreement that completes the Protocol) treat Land Use, Land Use Change and Forestry (LULUCF) alternatives in Annex I countries (mainly the OECD members in 1992 and Russia) and in non-Annex I countries (the developing countries) completely differently by not accepting avoided deforestation in developing countries as a valid alternative to meet the abatement targets (although emissions from deforestation account for more than 20 per cent of anthropogenic emissions). After the Marrakech Accords were signed, avoided deforestation was soon put back on the agenda by Papua New Guinea and Costa Rica. It was then that it became clear that excluding avoided degradation made little sense, and now the debate focuses on the best tools for reducing emissions from deforestation and degradation (REDD). However, this debate has largely neglected the convenience of establishing, in the mid-term, a similar system for Annex I countries and for non-Annex I countries, as well as the need to include all types of LULUCF activity under the same umbrella to allow for adequate economic optimisation to take place (Plantinga and Richards, Reference Plantinga and Richards2008).
In this paper we first review the rules in the Kyoto Protocol – Marrakech Accords for LULUCF in Annex I and non-Annex I countries – as well as the literature proposing different carbon accounting methods, initially bearing in mind forest management and reforestation and, more recently, focusing on REDD. We try to find a common ground in these proposals and suggest possible future paths for carbon sequestration in a post-Kyoto world. We then move on to apply this discussion to micro-applications in an Annex I country (Spain) and in a non-Annex I country (Tunisia), comparing avoided degradation with reforestation alternatives. In both areas we focus on Mediterranean forest, one of the world's hotspots of biodiversity (Myers et al., Reference Myers, Mittermeier, Mittermeier, Da Fonseca and Kent2000; Merlo and Croitoru, Reference Merlo and Croitoru2005). These ecosystems have suffered important degradation and/or deforestation processes in both areas over the last decades and, at least in Spain, reforestation programmes have also been important during this period. We calculate CO2 break-even prices (BEP) for different LULUCF activities, including in our analysis not only commercial values, but also existing subsidies where they are relevant (Spain). We finally investigate social preferences for avoided degradation and reforestation using stated preference methods (focusing on public visitors to one of the case studies considered in Spain).
2. A review of different carbon accounting methods
2.1. Carbon accounting in the Kyoto Protocol and the Marrakech Accords
A fundamental characteristic of the Kyoto framework is the distinction between Annex I and non-Annex I countries. Based on the principle of ‘common but differentiated responsibilities’, the former are the only ones to have quantitative emissions abatement targets and, partly as a result of this, carbon accounting rules are different between these two groups of countries (Höhne et al., Reference Höhne, Wartmann, Herold and Freibauer2007). For Annex I countries article 3.3 states that ‘human-induced’ land-use change and forestry activities, limited to afforestation, reforestation and deforestation since 1990, should be taken into account and article 3.4 allows parties to consider other additional ‘human-induced’ activities related to changes in greenhouse gas emissions by sources and removals by sinks in the agricultural soils and the land-use change and forestry categories. However, given the difficulty of constructing a baseline for non-human-induced activities, the Marrakech Accords followed a pragmatic approach. Each country can take into account all the increases (eventually decreases) in its carbon stocks (including those mentioned in article 3.3. and those pools mentioned in article 3.4 that it has chosen to consider), without the need to pay too much attention to the distinction between human-induced and non-human-induced activities. The counterpart is that each country has a ‘cap’ on sinks or on ‘forest management’ activities since other LULUCF activities are free of this limitation (Caparrós and Jacquemont, Reference Caparrós and Jacquemont2003). In other words, although the precise mechanism is complicated, the system is based on national inventories with a cap.
In addition, under the Kyoto Protocol's Clean Development Mechanism (CDM) (Article 12), Annex I countries may generate credits by making investments in developing countries. In terms of LULUCF-related activities, only those concerning afforestation and reforestation are permitted. For credits earned by CDM projects, two carbon accounting methods have been accepted within the Kyoto–Marrakech framework: the temporary credits (t-CERs) and the long-term credits (l-CERs). The main difference between the two alternatives available to the project participants is the lifetime of the credit. Both schemes require verification every five years, and the liability rests on the buyer side. In short, the carbon accounting system pays for the stock of carbon, not for growth, and the approach is project based.
2.2. Carbon accounting methods proposed in the literature on forest management or afforestation and reforestation
Most of the carbon accounting methods proposed in the literature on forest management or afforestation and reforestation can be classified into three major types: payment for carbon growth, payment for the stock of carbon or payment for land conversion.
The ‘Carbon Flow Method’ (CFM) was proposed in the early literature on the impact of carbon sequestration on optimal rotations (Englin and Callaway, Reference Englin and Callaway1993; or Van Kooten et al., Reference Van Kooten, Binkley and Delcourt1995) and essentially implies that the land owner (or forest owner) gets paid when carbon sequestration takes place and has to pay when carbon is released. The amount to be paid is set equal to that of the carbon price associated with CO2 emissions. Payment can come from government (with a subsidy for sequestration and a tax on liberation) or from an efficient carbon trading system. Van't Veld and Plantinga (Reference Van't Veld and Plantinga2005) use this method and Feng et al. (Reference Feng, Zhao and Kling2002) call it ‘pay-as-you-go’. This is a reasonable incentive mechanism to be set up by Annex I governments within the Kyoto framework since, as shown above, what counts at the international level is the total carbon budget of the country (the average during the commitment period). Richards et al. (Reference Richards, Sampson and Brown2006) also present this method as one of the best alternatives to be used in the United States.
Another set of methods propose paying the forest owner a smaller amount for each ton of carbon sequestered for a given period of time. Feng et al. (Reference Feng, Zhao and Kling2002) use the term ‘variable length contract’ and apply it to the conversion of land for a given period of time (see also Caparrós, Reference Caparrós2009). The carbon ‘rental fee’ used in Sohngen and Mendelsohn (Reference Sohngen and Mendelsohn2003), where the forest owner gets paid a fee for each ton of carbon stored, is another variation of this set of methods (setting the sequestration period considered to one year). The price paid is in both cases based on the increase in carbon prices and is always lower than the carbon price associated with CO2 emissions. Another variation is known as the Ton Year Accounting Method (TYAM), and was proposed by Moura-Costa and Wilson (Reference Moura-Costa and Wilson2000). With this variation, the sequestration period considered is always one year, as in the ‘rental fee’ method, but instead of reducing the price to be paid, what is reduced is the quantity of carbon credited (by an equivalence factor that captures the benefit associated with sequestering one ton of CO2 in the forest biomass for one year; this equivalence factor is estimated based on the cumulative radiative forcing of an emission of CO2 over a 100-year time horizon). The carbon accounting methods for the CDM discussed above are variations of this set of methods, setting the time period equal to five years for the t-CER method and equal to 30 years for the l-CER method. Although the agreement obviously does not say how the price should be reached, it is easy to show that the price will be established in accordance with the increase in carbon emission prices (Olschewski and Benítez, Reference Olschewski and Benítez2005).
Stavins (Reference Stavins1999) and Lubowski et al. (Reference Lubowski, Plantinga and Stavins2006) propose a Land Conversion Subsidy (LCS) for converting arable/grazing land to forest and a tax on forest that is converted to arable/grazing land. A second feature of the policy is a requirement that afforested lands remain as forest for a specified period of time. As stated by Lubowski et al. (Reference Lubowski, Plantinga and Stavins2006), this method is similar to the Conservation Reserve Programme in the United States, established by the Food Security Act of 1985, which provides annual rental payments to landowners voluntarily retiring environmentally sensitive land from crop production under 10- to 15-year contracts. The current subsidies for reforestation in the European Union are also a variation of this method (see below). Thus, this method is a reasonable way of encouraging carbon sequestration in practical terms, given the experience gained with previous programmes.
Under the ‘carbon annuity account’ method, proposed in Feng et al. (Reference Feng, Zhao and Kling2002), the generator of a sink is paid the full value of the carbon emission price (the full value of a permanent reduction). However, instead of being paid to the forest owner it is put directly into an annuity account. As long as the sink remains in place, the owner can access the earnings of the annuity account but not the principal. When the carbon is released, the principal is reduced by the on-going carbon emissions permit price. This method has received less attention, probably because the scheme proposed is relatively complex in practical terms.
Caparrós et al. (Reference Caparrós, Campos and Martín2003) propose to separate ‘permanent sequestration’ from ‘temporary sequestration’ in a managed forest, and to pay the full carbon price only to permanent carbon sequestration while temporary sequestration would only obtain a fraction of the value of the carbon price. The main drawback of this method is that it needs a large amount of information, even at the micro-scale.
2.3. Carbon accounting methods proposed for REDD
Several accounting methods have been proposed recently to incorporate avoided deforestation in tropical zones into future climate agreements (avoided deforestation was only included in the Kyoto framework for Annex I countries). The initial focus was exclusively on avoided deforestation but soon the convenience to include avoided degradation (AD) as well became clear and now the debate is over REDD.
Santilli et al. (Reference Santilli, Moutinho, Schwartzman, Nepstad, Curran and Nobre2005) propose the concept of ‘compensated reductions’ that is a nationwide approach which sees that developing countries obtain compensations for voluntary reductions in deforestation rates. A group of researchers of the Joint Research Centre of the European Commission proposes another method based on reduced conversion rates (Mollicone et al., Reference Mollicone, Achard, Federici, Eva, Grassi, Belward, Raes, Seufert, Stibig, Matteucci and Schulze2007). The key feature of this method is that only if global deforestation is reduced compared to global historical deforestation rates will funds be liberated and distributed (the distribution mechanism is different for ‘high’ conversion rate and ‘low’ conversion rate countries). This basic idea, with different distribution mechanisms, has also been proposed by Strassburg et al. (Reference Strassburg, Turner, Fisher, Schaeffer and Lovett2008) and Woods Hole Research Center (WHRC) and Instituto de Pesquisa Ambiental da Amazonia (IPAM) (2008), although these two proposals do not differentiate between high and low conversion rate countries. Nevertheless, in all cases the proposals assume a nationwide approach. Plantinga and Richards (Reference Plantinga and Richards2008) also argue in favour of a national inventory approach, compared in their proposal not to historical emissions from deforestation but to negotiated baselines. Another key message of their discussion is the need to unify the methods for all the LULUCF activities in any post-Kyoto agreement. The upshot is that all the approaches presented above and most of those discussed in the current United Nations Framework Convention Climate Change negotiations (2008) propose to use national inventories.
2.4. Carbon accounting methods for a post-Kyoto world
The project-by-project approach favoured in the CDM under the Kyoto Protocol has not been very successful, as the very limited number of afforestation and reforestation projects that have been approved so far shows. The main reason is the extremely complex system that was set up in the Marrakech Accords for afforestation and reforestation in the CDM. Therefore, the future of carbon sequestration in any post-Kyoto agreement should be based on national inventories. This has the obvious advantage of allowing the accommodation of different LULUCF activities under one single accounting method. An additional advantage is that this would essentially imply the same method that has been currently approved for Annex I countries to be used for non-Annex I countries. The baseline to which national net emissions are compared could try to separate ‘non-human-induced’ emissions, as proposed by the Kyoto Protocol. Nevertheless, the Marrakech Accords finally gave up this difficult task by only including a cap on forest management (see above). This is essentially a form of ‘negotiated baseline’ in line with the one proposed by Plantinga and Richards (Reference Plantinga and Richards2008), although they seem to have in mind a negotiation that sets the level of emissions above which credits can be obtained. Given the uncertainties surrounding all existing measurements of global forest stocks, Plantinga and Richards’ proposal would include the risk that a mistake in defining the negotiated baseline could actually flood the carbon market, an outcome much feared by all those opposing the incorporation of REDD into the system. Therefore, a national inventory approach tied in with historical baselines and a cap, following exactly the approach in the Kyoto Protocol–Marrackech Accords for Annex I countries, is probably the most convenient way to integrate REDD into future agreements. With this alternative, the final outcome would be common systems for Annex I countries and for non-Annex countries.
However, even if we assume that nationwide accounting is the rule and that at the international level only national aggregates matter, governments will still need to set up incentives for forest owners to obtain significant results. The most obvious choice would be the CFM discussed above, since it is based on flows as are the current Annex I accounting method, and most national level proposals. Nevertheless, payments for stock and therefore for the standing forest have proven to favour biodiversity (Caparrós et al., Reference Caparrós, Cerdá, Ovando and Campos2009) and have also been recently proposed in the REDD debate (WHRC and IPAM, 2008). A simple method such as the TYAM described above is therefore also a reasonable alternative. Finally, the experience gained with the aforementioned LCS suggests that simply paying a lump sum upfront and forgetting the complex task of measuring carbon is also a pragmatic alternative to be considered.
In the application below we will focus on micro-applications and therefore on the different methods available to the governments to foster AD and reforestation at the national level (we will present our results for the CFM, the TYAM and the LCS). There is a wealth of literature that focuses on tropical forests at the macro level, but there is relatively little research on avoided deforestation or avoided degradation for other regions. However, if we want to move to a universal system we should know the implications in different regions. Furthermore, we need to compare REDD activities with reforestation activities since, as already mentioned, future regimes should treat them as alternative options to obtain an ‘optimal’ sequestration portfolio to add to other energy abatement strategies.
3. Micro-applications in Spain and Tunisia
In this section we compare AD alternatives with afforestation and reforestation (AR) options within an Annex I country (Spain) and AD alternatives in a non-Annex I country (Tunisia). In both cases we focus on Mediterranean forests. This type of forest is relatively similar on both shores of the Mediterranean basin, highlighting another reason to favour a similar treatment for forests in Annex I and non-Annex I countries. In Spain, pure, dense and sparse mixed cork oak stands cover about 714,000 ha, while holm oaks cover about 1,867,000 ha (Dirección General de la Conservación de la Naturaleza, 1998). In the period 1993–2000, reforestation within the framework of the Common Agricultural Policy accounts for more than 83,000 ha of new mixed and pure cork oak stands and more than 197,000 ha of holm oaks on pasture (55 per cent), cropland (35 per cent) and scrubland (10 per cent) (Ovando et al., Reference Ovando, Campos, Oviedo, Montero, Aronson, Pereira and Pausas2009). However, different studies have shown that there is a lack of natural regeneration because of overgrazing problems in Spanish open oak woodlands (Plieninger, Reference Plieninger2007). For example, the number of cork oaks has declined by about 20 per cent in the Aljibe region over the last 30 years (one of our case studies below). In Tunisia, the cork oak is one of the main tree species of north-western forests, but its surface area has decreased greatly from more than 127,000 ha in 1950 (Boudy, Reference Boudy1952) to 70,000 ha in 2003 (Centre National de Télédetection/Direction Generale des Forets, 2005).Footnote 1 The situation in the rest of the Maghreb countries is similar (Merlo and Croitoru, Reference Merlo and Croitoru2005). Over the last few decades, about one third of cork oak forests have disappeared, declining to a total of 632,000 ha in recent years (Harfouche et al., Reference Harfouche, Nedjahi, Ellatifi and Daly-Hassen2005).
We start by comparing the commercial costs and benefits associated with the different options mentioned above and by calculating the prices of CO2 that would be needed to see any of these activities actually taking place. We assume in all cases that our deterministic models are based on perfect information, therefore neglecting all the uncertainties inherent in any long-term analysis. For the Spanish case, we then investigate social preferences for avoided degradation and reforestations.
3.1. Avoided degradation and reforestation break-even CO2 prices
We compare break-even CO2 prices for two alternative investments: reforesting pasture or scrubland with slow growing native species (afforestation and reforestation in the Kyoto jargon) or avoiding degradation by facilitating natural regeneration of slow growing native species. Natural regeneration is a measure for avoiding ancient Mediterranean oak woodlands degrading where overgrazing currently hinders the growth and development of seedlings. Facilitated natural regeneration includes a set of forestry treatments (Montero et al., Reference Montero, Martín, Cañellas, Campos, Pulido, Campos and Montero2003, Reference Montero, López, Campos, Sánchez, Sánchez, Ruiz-Peinado, Ovando, Caparrós, Bachiller and Zapata-Blanco2009; Chaar et al., Reference Chaar, Stiti, Montero, Khaldi and Zapata-Blanco2009) such as grazing restriction for 15–20 years and regeneration felling (cutting a large percentage of aging oak trees to encourage on-site seeding under the tree canopy).
In Spain, cork oaks grow both in flat lands (called dehesas) and mountain areas (called monte cork oak woodlands), which determines a different stand structure and management. Dehesa woodlands represent the most extended type of holm and cork oak groves in Spain, which are mainly spread throughout Extremadura and western Andalusia (West-Southwest). Monte cork oak woodlands normally maintain higher tree densities and are found in the south-west mountains bordering the provinces of Cadiz and Malaga (Andalusia). On the other hand, cork oak is the most common native tree species in north-western Tunisia, occurring especially throughout the Kroumerie–Mogod mountain range. In this study, the holm and cork oaks of the Monfragüe Plain (Caceres, Extremadura) characterise west–south-western dehesa oak woodlands management, while the Aljibe Massif (Cadiz, Andalusia) exemplifies the South-western monte cork oak lands and Ain-Snoussi shows an example of the Kroumerie–Mogod cork oak woodlands in Tunisia.
We use four idealised silviculture models to simulate the evolution of even-aged holm or cork oak groves on which natural regeneration is induced. We compare these four scenarios with the corresponding ‘non-investment scenarios’, where non-investment refers exclusively to the lack of holm or cork oak regeneration treatments. In all cases we assume that the initial situation is an even-aged oak woodland of species i in site j that is Tij years old, where Tij is the age at which facilitated natural regeneration should start according to the silvicultural models that we consider (i.e., Martín et al., Reference Martín, Campos, Montero and Cañellas2001, Montero et al., Reference Montero, Martín, Cañellas, Campos, Pulido, Campos and Montero2003, Reference Montero, López, Campos, Sánchez, Sánchez, Ruiz-Peinado, Ovando, Caparrós, Bachiller and Zapata-Blanco2009, for Spanish holm and cork oaks and Chaar et al., Reference Chaar, Stiti, Montero, Khaldi and Zapata-Blanco2009, for the Tunisian cork oaks). Density is also assumed to be given by these silvicultural models. That is, we are assuming that the piece of land where the intervention will take place has only old oaks, a reasonable assumption in our case studies (see Montero et al., Reference Montero, Martín, Cañellas, Campos, Pulido, Campos and Montero2003; Plieninger, Reference Plieninger2007). The results of this scenario are compared with the lack of those treatments. Under the non-investment scenarios, the holm and cork oak will disappear in the future, mainly because of over-grazing (Martín et al., Reference Martín, Campos, Montero and Cañellas2001; Campos et al., Reference Campos, Daly-Hassen and Ovando2007; Ovando et al., Reference Ovando, Campos, Oviedo, Montero, Aronson, Pereira and Pausas2009). We also compare the results of this facilitated natural regeneration with those of reforestation, by using the raw data from Chaar et al. (Reference Chaar, Stiti, Montero, Khaldi and Zapata-Blanco2009) and Montero et al. (Reference Montero, Martín, Cañellas, Campos, Pulido, Campos and Montero2003, Reference Montero, López, Campos, Sánchez, Sánchez, Ruiz-Peinado, Ovando, Caparrós, Bachiller and Zapata-Blanco2009) models to simulate the evolution of those oaks stands. We further assume that the reforestation is carried out on scrubland in Aljibe and Ain Snoussi and on pasture on the Monfragüe Plains.
In our reforestation scenario, we assume that pasture is replaced by a forest that will grow following this function (assuming that after 144 years, natural regeneration will be facilitated). In our facilitated natural regeneration scenario, we assume that the forest is already 144 years old and that we are facing the decision to let it degrade or facilitate regeneration as discussed above from the year 144 onwards (see figure A1 in the online Appendix, available at http://journals.cambridge.org/EDE).
The amount of carbon that is accumulated in the tree biomass of one hectare of holm or cork oaks is estimated considering the functions of Montero et al. (Reference Montero, Ruiz-Peinado and Muñoz2006) that relate the diameter at chest height of an oak tree with the dry weight of its aboveground and root biomass. We further consider a carbon content of 475 mg g−1 for holm oak and 472 mg g−1 for cork oak.
Carbon decline in forestry products and residues from silviculture treatments are estimated considering three stocks for live biomass: (i) non-commercial aboveground biomass residues, (ii) commercial biomass and (iii) root biomass. We assume that the carbon stored in forestry products and residues declines at a constant rate kj (0 ≤ kj ≤ 1) which differs according to the origin of the carbon pool. For all pools we assume a carbon decay of the type yjt = xjs(1 − kj)t − s, where yjt represents the carbon in pool j in period t and xjs represents the carbon in the corresponding living stock at period s when the biomass was extracted from the forest. The parameter k takes value 1 for commercial biomass (for oaks this is mainly firewood and we assume that it is burned in the same year), 0.15 for the remaining aboveground biomass (Rovira and Vallejo, Reference Rovira and Vallejo1997) and 0.05 for roots.
We further consider that the use of a metric tonne of firewood as a substituteFootnote 2 for fuel oil generates carbon emission savings of 9.81 × 10⁻² t of Carbon (own estimations based on International Energy Agency, 1997). Emissions due to the use of fossil fuels in oak woodlands forestry operations are estimated considering fossil fuel consumption and Sims et al. (Reference Sims, Hastings, Schlamadinger, Taylor and Smith2006) CO2 emission factors.
The different assumptions enumerated above allow us to construct the non-parametric growth function for living biomass for species i in site j that we denote Gij(t), already in CO2 units, and the decline function for all the different pools of dead biomassFootnote 3 Rij(t). The carbon flow (for the CFM) in one hectare of oak woodland at the period t is given by

where wij represents the tonnes of firewood extracted from the woodland in period t and zij represents the use of fossil fuel (in MJ) in period t. Parameters β, y and γ are, in that order, the conversion factor for estimating emission savings due to the use of firewood to offset fossil fuels and the carbon emission due to the use of fossil fuels in oak woodland forestry management.
For the TYAM, the relevant estimate is the equivalent carbon that is stored in the forest biomass for one year. Equivalent carbon is estimated considering the total carbon tonnes that are stored in the forest biomass (Gij) and products (Rij) and an equivalence factor (ɛ) that captures the benefits associated with sequestering one tonne of CO2 in the forest biomass for one year (as stated above, this equivalence factor is estimated based on the cumulative radiative forcing of an emission of CO2 over a 100-year time horizon). This allows us to give a ‘flow-equivalent’ measure for the carbon stock to which we can add the flows associated to wij and zij. Thus

The additional carbon mitigation for a 100-year period of the avoided degradation scenario, compared to the non-regeneration scenarios, can be found in table A1 in the online Appendix (available at http://journals.cambridge.org/EDE). The formulas to obtain these values for the CFM and the TYAM respectively are as follows:


where CP(0) is the amount of carbon in pasture/scrubland at time 0 and Dij the non-parametric function describing how the carbon in the biomass in an aging oak stand declines.
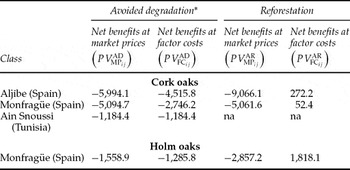
The total amount of land to which the per hectare values in table 1 (and table 2 and table A.1 in the online Appendix) can be applied is 167,767 ha in the Aljibe area, 136,619 ha in Monfragüe and 3,230 ha in Ain Snoussi (the figures shown in tables 1 and 2 are averages, see Caparrós et al. (Reference Caparrós, Cerdá, Ovando and Campos2009) for an application in the Aljibe area that takes into account spatial variations in productivity and reforestation costs).
Present values of avoided degradation and reforestation of oak woodlands (2002 euro per hectare)

Note: Discount rate (r) 4 per cent.
* Facilitated natural regeneration.
na: not available.
Source: Campos et al. (Reference Campos, Daly-Hassen and Ovando2007); Ovando et al. (Reference Ovando, Campos, Oviedo, Montero, Aronson, Pereira and Pausas2009) and own elaboration based on Martín et al. (Reference Martín, Campos, Montero and Cañellas2001).
Break-even CO2 prices

Note: Discount rate (r) 4 per cent; na: not available.
*Facilitated natural regeneration.
Facilitating natural regeneration of Mediterranean oaks is a costly investment, especially when we consider the long period of cash losses prior to obtaining commercial revenues from cork or holm oak management (more than 15 year in the best case scenario). In this study, we use the stream of costs and benefits estimated by Ovando et al. (Reference Ovando, Campos, Oviedo, Montero, Aronson, Pereira and Pausas2009) for the Monfragüe and Aljibe cork oaks, by Campos et al. (Reference Campos, Daly-Hassen and Ovando2007) for the Ain Snoussi cork oaks and by Martín et al. (Reference Martín, Campos, Montero and Cañellas2001) for the Monfragüe holm oaks. The reference year for those studies is 2002, except for Martín et al. (Reference Martín, Campos, Montero and Cañellas2001), in which case results were updated to 2002. In all cases, costs and benefits are based on in-depth interviews with local agents and our own field data. Unfortunately, we do not have enough independent observations to perform an econometric analysis. We consider two types of economic indicators: net benefits (revenues minus costs) at market prices (B MP(t)), without subsidies and taxes, and net benefits at factor cost (B FC(t)), considering net operating subsidiesFootnote 4 as an additional revenue for the land owner (we use the superscript AD to denote the scenario with facilitated regeneration, NI for the non-investment scenario, AR for reforestation and P for pasture/scrubland). Table 1 shows the present values of the two investments: a reforestation scheme (where the opportunity costs are given by pasture/scrubland) and avoided degradation (where the opportunity costs are given by a declining oak stand):


As table 1 shows, the net benefits of natural generation are negative, since the revenues (including net subsidies) are not enough to compensate for the cash losses that landowners suffer from natural regeneration forestry treatments and, especially, from the revenues lost due to grazing exclusion. This table also gives the BEP for the LCS, with a 4 per cent discount rate. If the amount shown in table 1 is negative for a particular scenario and a particular location, the BEP for the LCS is the absolute value of the figure shown; if the amount shown in table 1 is positive, the BEP under the LCS is zero since no additional incentives are needed.
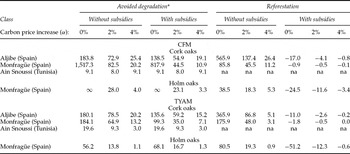
BEP for the CFM and the TYAM can be found in table 2. We estimate these values for a 4 per cent discount rate (r) and simulate three carbon prices scenarios: carbon prices remaining constant and increasing at a yearly rate (α) of 2 or 4 per cent. Table 2 shows the prices for carbon (Pc) that check the following functions for reforestation and AD respectively:


The first relevant message to come out of table 2 is that, although with some exceptions,Footnote 5 the results using the CFM are relatively similar to those obtained using the TYAM. This shows that in these particular applications the choice between these two methods is not too important. Focusing on the results without subsidies, we see that, as is to be expected, BEPs for avoided degradation in Tunisia are clearly below those in Spain. However, BEPs for holm oaks in Monfragüe are relatively close to expected market values for carbon, even without subsidies for both avoided degradation and reforestation. This is a relatively surprising result given that Spain is a country with high costs and oak stands grow very slowly. Nevertheless, the main point that we would like to stress is that if subsidies are not included in the analysis, BEPs for avoided degradation are generally lower than those for reforestation in our case studies in Spain.
If subsidies are taken into account, the picture changes dramatically, due to the large amounts of subsidies that the European Union offers for reforestation using oaks. Reforestation, and not AD, now has lower BEPs in Spain, and reforestation in Spain even beats AD in Tunisia since BEPs for reforesting in Spain are actually negative.
That is, the market would first favour AD in Tunisia, then AD in Spain and only then reforestation in Spain. However, given the system of subsidies in place, the private investor would prefer reforestation in Spain over the other two options. This preferential treatment, in terms of subsidies, for reforestation over AD raises the question as to whether public opinion in Spain really supports this option. In the next section we report the results of a survey of visitors to one of the case studies considered above (Aljibe, Spain).
3.2. Social preferences on avoided degradation and reforestation
The relevant population to evaluate the different policies under consideration would be the public as a whole. Nevertheless, due to data and budget constraints, we focus on visitors, acknowledging that visitors may not be a fair representation of the public as a whole. To estimate the economic values of the environmental services associated with a cork oak AR/AD programme in the Alcornocales Natural Park, we applied a choice experiment in a survey of public visitors (about 90 per cent of the area of this reserve is in the Aljibe Massif analysed in one of the case studies above). In the survey, visitors were given a booklet explaining the potential AR/AD programmes and their consequences. After reading the booklet, they were asked to complete the choice experiment.
The choice experiment consisted of eight choice situations, each one presenting two alternatives (an AR or AD programme) and the status quo. Apart from the AR/AD attributes, the alternatives included a one-time payment as an increase in taxes in that year only (the status quo implied no payment). In each choice situation, respondents had to state the alternative they would choose. Actually, half of the sample was given a ranking exercise, that is, they had to rank the alternatives from the most preferred to the least preferred. However, we use all observations as if they were a choice experiment, since Caparrós et al. (Reference Caparrós, Oviedo and Campos2008) demonstrate that in this experiment, the ‘one you would choose’ question and the ‘your most preferred’ question yield statistically indistinguishable results.
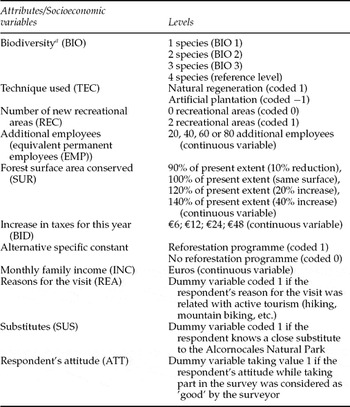
The interviews, held from June 2002 to May 2003, were face to face with 900 public visitors. Previously, two focus groups identified the attributes of an AR/AD programme and evaluated the extent to which the information presented in the survey was understood. A preliminary design for the choice situations was tested as well. We used the focus group information to create a pretest whose main objective was to obtain the vector of monetary values to be offered in the main survey. An open-ended willingness to pay (WTP) question was used to obtain a value for a complete AR/AD programme, followed by six open-ended WTP questions corresponding to the six different attributes selected using the focus group (the five used in the final version plus ‘number of birds protected’, not included in the final version). The pretest was performed with 115 visitors. The focus group and the pretest allowed us to select the attributes presented in table 3 (see also figure A2 in the online Appendix, available at http://journals.cambridge.org/EDE).
Attributes and socioeconomic variables used in the choice experiment

Note: The status quo levels were: no trees, no technique, no additional recreational areas, no employees, 80 per cent of the current forest surface conserved (20 per cent reduction), no additional taxes and no reforestation programme.
a Number of native tree species used, always including cork oaks.
Given these attributes and their levels, we chose 16 treatments from the universe of 1,024 possible combinations (44 × 22) of attributes, forming a main effects design for attributes. Then, we placed the 16 treatments in pair-wise combinations in order to obtain a full set of pair-wise comparisons among treatments, yielding 120 choice sets.
The booklet shown to each respondent presented a brief description of the Alcornocales Natural Park and its current land uses. Respondents were informed about the problem of natural regeneration that the reserve has suffered over the last few years. They were told that between 1969 and 1996 the number of cork oak trees was reduced by 16 per cent, with the reduction being greater (26 per cent) among young oaks. This originates a decrease in the forested area that is gradually being converted to scrubland and pasture. Thus, respondents were faced with the following status quo situation: ‘If we do not act today, it is expected that in the next 30 years the cork oak area in the Alcornocales Natural Park will be reduced by approximately 20 per cent’.
They were then presented with the possibility of a cork oak AR programme through artificial plantation that could potentially avoid this situation. This programme would avoid the 20 per cent reduction mentioned above or even increase the cork oak area (table 3). Since the lost forestry surface is gradually being replaced by pastures and scrublands, it was explained that reforestation was to be carried out on these types of terrain.
The respondents were also informed about the possibility of performing an AD programme through facilitated natural regeneration (avoided degradation). Using AD, the initial visual impact can be ameliorated, avoiding the crop-like appearance of the artificial plantation during the first years. Natural regeneration is achieved by fencing off the area of aging cork oaks to avoid grazing and the initial aspect would not differ from that of a forest. The landscape resulting from the AR or the AD programme would be similar after about 60 years. The different stages were illustrated using photographs (see figure A3 in the online Appendix, available at http://journals.cambridge.org/EDE).
The main difference between the AR and the AD programmes was, therefore, their appearance during the first decades. We did not include a description of additional benefits of AD in terms of biodiversity or other ecological benefits due to the difficulties of explaining them in an objective manner in a booklet. Nevertheless, we acknowledge that it would have been desirable to do so.
The respondents also had to choose how many species they want to be planted. The more the species, the higher the future forest biodiversity and the greater the natural appearance of the forest in the long term. This attribute included up to four species, with the cork oak always being the main one of these. The additional species were other oak types, meaning the visual effect on the landscape would not vary much. Another consequence of the reforestation project is the generation of permanent employees in the local communities. These permanent employees would be generated during the first 30 years of the programme. Finally, the programme also included the possibility of creating recreational areas for public visitors.
For the data analysis, a first model (model I) includes the attributes of the AR/AD as explanatory variables (see table 3). The BIO and TEC attributes are effect-coded. In BIO, one species (BIO1), two species (BIO2) and three species (BIO3) take value 1 when present in the alternative and value 0 otherwise, while four species are selected as the reference level taking BIO1, BIO2 and BIO3 values (−1) when four species is the level. The TEC attribute takes value 1 for facilitated natural regeneration (AD) and value (−1) for artificial plantation (AR) to differentiate the effect of choosing any of the two possible techniques from the status quo. The REC attribute is dummy-coded since there is only one level (two recreational areas created) apart from the level associated with the status quo (no recreational areas). EMP and SUR are coded as continuous variables with quadratic terms (EMP2 and SUR2) to identify non-linear effects. BID is coded as a continuous variable. We also include an alternative specific constant (ASC) for AR/AD alternatives as an attribute (taking value 1 for the AR/AD alternatives and value 0 for the status quo alternative).
In addition to the attributes, a second model (model II) includes interactions of socio-economic variables with TEC (the main variable of interest in this paper). A third model (model III) includes interactions of socio-economic variables with all attributes. The selected variables (table 3) are the respondent's monthly family income (INC), a variable taking value 1 if the respondent's reason for visiting is related with active tourism (hiking, mountain biking, etc.) and value 0 otherwise (REA); a variable taking value 1 if the respondent knows a close substitute to the Alcornocales Natural Park and value 0 otherwise (SUS); and a variable taking value 1 if the respondent's attitude while taking part in the survey is considered as ‘good’ by the surveyor and value 0 otherwise (ATT). Other variables are rejected due to correlation. We report the preferred models after non-significant (>10 per cent) variables have been removed.
Our models assume a linear-in-parameters utility function for the ith consumer's utility, choosing alternative j with a systematic (Vij) and a random component (εij): Uij = Vij + ϵij. The systematic component can be decomposed, Vij = β′ijXijh, where β′ij is the regression coefficient vector for individual i and for the alternative j and Xijh is the value for individual i of the attribute h for the alternative j.
For the regression analysis, we use a random parameter logit model (Train, Reference Train1998; Layton, Reference Layton2000) to relax the independence of irrelevant alternative assumptions and the independence of observation assumptions for the choice sets completed by each respondent in the same questionnaire. This model is based on a modification of the multinomial logit that allows the parameters β to vary within the population instead of being constant as in the multinomial logit. This allows the model to incorporate unobserved heterogeneity. Thus, the probability of individual i choosing alternative j is

where λi is an individual-specific random disturbance of unobserved heterogeneity and S is the set of all alternatives in a choice situation. The coefficient vector for individual i is β′ij = β + σ λi, where β is the population mean for the parameter, σ is the standard deviation of the marginal distribution of β and λi is a random term which, in our application, is assumed to be normally distributed with mean zero and unit standard deviation. When σ = 0, the random parameter model is equivalent to the multinomial logit. We consider that the random parameter model is a more advantageous model since it incorporates random effects introduced by the panel-data nature of our data set (Lusk and Schroeder, Reference Lusk and Schroeder2004).
Once the parameters for the proposed models are estimated, we calculate a point estimate of the mean (median) WTP for a marginal increase in the level of an attribute (mWTP) dividing the β associated with the attribute (βk) by the β associated with the payment vehicle (β BID), with negative sign. Using the Wald procedure (Greene, Reference Greene2007), we calculate the variance and standard error for the mWTP and, invoking Cramer's theorem, we construct the 95 per cent confidence interval. We also generate an empirical distribution of this mWTP for each attribute through the Krinsky and Robb (Reference Krinsky and Robb1986) bootstrapping technique with 1,000 replacements. In this case, the mean, median and the standard error of the distribution is the mean, median and standard error of the mWTP for each attribute. We obtain the 95 per cent confidence interval through the percentile approach (Efron and Tibshriani, Reference Efron and Tibshirani1993).
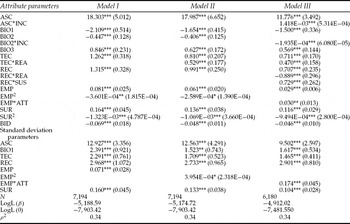
Table 4 shows the three regression models for the choice experiment. In model I, all attributes are significant at 99 per cent, but EMP2 is significant only at 95 per cent. For the standard deviation parameters, we find no significance for the BIO2, BIO3, EMP2 and SUR2 attributes, with the remaining ones being significant at the 99 per cent level.
Random parameters logit models

Note: Standard errors are shown in brackets; N: number of observations; Asterisks (e.g., *, ** and ***) denote significance at the 10 per cent, 5 per cent, and 1 per cent level respectively.
In model II, only the interaction of the TEC attribute with the socio-economic REA variable turns out to be significant. The positive sign indicates that those respondents visiting for reasons of active tourism (hiking, mountain biking, climbing, etc.) are willing to pay more for using natural regeneration instead of artificial plantation than those who do not visit for these reasons. The attributes parameters are all significant, as in model I, although in this case, EMP2 is significant only at the 90 per cent level.
In model III, BIO2 and EMP2 are the only attributes to lose their significance. In the case of BIO2, all the explanatory power for this attribute is now captured by the interaction of BIO2 and INC. The positive interaction between TEC and REA is also maintained. We also find new positive interactions between the ASC and INC, between REC and SUS and between EMP and ATT. However, the interaction found between REC and SUS is negative.
Based on the results of these models, and using the parametric and bootstrapping techniques described above, table A2 in the online Appendix shows the mWTP per attribute of the reforestation programme. The mWTP for the technique employed in reforestation clearly favours natural regeneration. The increase in the WTP for a reforestation programme when using natural regeneration is about €18 in model I, €17 in model II and €16 in model III, with €11 and €10 being added in model II and model III respectively, if the respondent's reason for visiting is active tourism (see above). All other attributes show a positive effect in the WTP with non-linear effects found in EMP2 and SUR2 (only found in SUR2 for model III) as well as the significance and sign of the interactions described previously.
Since we are mainly interested in the differential benefits between AD and AR, we define two alternative programmes: one with artificial reforestation and one with natural regeneration. What both programmes have in common is that only cork oaks are used, that no additional recreational areas are created and that the aim is to maintain the current cork oak woodland surface. The employment generated is given for the two programmes designed and implies 49 permanent employees for the AD scenario and 51 permanent employees for AR scenario.
Table A.2 in the online Appendix (available at http://journals.cambridge.org/EDE) shows the estimations of the Hicksian surplus for these programmes. The median is €336 for the AD programme and €301 for the AR programme when using model I for both parametric and bootstrapping measures. When using model II, the median differs for parametric and bootstrapping measures. For the former, the median is €453 for AD and €415 for AR, while for the latter, the median is €460 for AD and €422 for AR. In model III, the AD programme shows a median of €371 and €370 for parametric and bootstrapping measures respectively, and for the AR, the median is €335 for both measures.
Having said this, which measure do we use for aggregation? Since the performance of all models is fairly similar, we prefer model III because it captures the heterogeneity of the respondents better and almost all attributes and their interactions are significant at the 99 per cent level. We further prefer bootstrapping measures because they have the advantage of not assuming an a priori distribution for the WTP. Thus, for aggregation purposes, we use €370 as the median for the AD programme and €335 for the AR programme.
We then estimate the total revenues that could be obtained if the relevant population (visitors) pays the additional tax. That is, we assume that the tax would be set at the limit accepted by 50 per cent of the population but that all the population (visitors) would pay the tax (a one-off payment). Oviedo et al. (Reference Oviedo, Caparrós and Campos2005) estimated that in 2002, Alcornocales Natural Park was visited by 49,216 people (or 0.29 visitors/ha). Multiplying this amount for the median values selected, we obtain a total exchange value of €18,215,334 (€107.13/ha) for the AD programme and of €16,480,470 (€96.93/ha) for the AR programme.
Thus, the environmental benefits are larger for the AD programme than for the AR programme. We assume that this difference comes from the initial visual impact associated with the artificial plantation since this was the only significant difference explained in the booklet about using both techniques. The more natural forest appearance obtained with natural regeneration is providing higher environmental benefits (although confidence intervals overlap), with an estimated value of €10.20/ha or €35.25/visitor, and a total of €1,734,864.
The per-hectare amounts obtained in the previous paragraphs are well below the amount offered for AR programmes and even for AD programmesFootnote 6 (even without taking into account that hypothetical payments tend to be higher than real ones). It is, however, true that the relevant figure is the general population's willingness to pay, since any attempt to implement payments to support these programmes would most likely use tax-payer money (and not only visitors would contribute). Nevertheless, our figures suggest that social preferences probably favour AD over AR programmes.
In addition, AD is less costly (see above) and generally a preferable option in terms of biodiversity conservation (Standiford et al., Reference Standiford, Mccreary and Frost2002). Although beyond the scope of this paper, linking these programmes with biodiversity conservation policies would therefore probably also favour AD programmes. Despite all that, European Union subsidies have until now been focused mainly on AR, although recent developments suggest that this focus may be changing.Footnote 7 Our results provide additional evidence to support avoided degradation over reforestation programmes.
4. Conclusions
This paper has compared AD and reforestation programmes in Spain and AD programmes in Tunisia. We have discussed the convenience of common carbon accounting methods for Annex I countries (Spain) and for non-Annex I countries (Tunisia). Several case studies have permitted us to show that markets would favour AD in Tunisia followed by AD in Spain, with reforestation in Spain coming in third. However, we have also shown that given the system of subsidies in place in the European Union, which were not related to carbon sequestration when the data for our applications were collected,Footnote 8 the private investor would prefer reforestation in Spain over the other two options. We have also investigated whether this preferential treatment for reforestation in the current system of public aid is supported by social preferences, focusing on the preferences of visitors to one of the case studies analysed. Our results have shown the opposite preference, since visitors have a higher willingness to pay for AD programmes.
However, as in most cases of AD, design and monitoring issues remain open. But this could represent more of an opportunity than a problem since fostering AD in woodlands within the European Union can help gain experience when it comes to proposing more ambitious international programmes. Furthermore, given other preferential agreements between the European Union and the Maghreb countries, Tunisia or other countries in the region could be natural candidates for additional pilot studies.
One of the main caveats of our analysis is that we did not explicitly analyse the impacts of the different programmes in terms of biodiversity. Analysing the links of any climate policy with biodiversity policies is a relevant issue that deserves to be investigated further.