1. Introduction
The application of classical time series methods to data on epidemics is relatively undeveloped. Most of the emphasis has been on building models to simulate the path of an epidemic under different assumptions about behaviour and policies, and the forecasting performance has often been unimpressive; see Avery et al. (Reference Avery, Bossert, Clark, Ellison and Ellison2020) and Ioannidis et al. (Reference Ioannidis, Cripps and Tanner2020). Here, we show how a new class of time series models can be used to track the progress of an epidemic and forecast key indicators. The methods draw much of their inspiration from econometrics, but take into account the special characteristics of time series for epidemics.
The univariate time series model described in Harvey and Kattuman (Reference Harvey and Kattuman2020a)—hereafter HK—fits a trend to the logarithm of the growth rate of the cumulated series of the target variable, which is usually new cases, hospital admissions or deaths. Allowing this trend to be time-varying introduces flexibility which, in the context of an epidemic, enables the effects of changes in policy and population behaviour to be tracked. Such stochastic trend models are a standard econometric tool, and they are easily handled within a state-space framework. Application of the Kalman filter (KF) enables nowcasts and forecasts of variables of interest, such as the growth rate of the daily number of cases and the instantaneous reproduction number, to be made. Estimation of the models is by maximum likelihood and goodness of fit can be assessed by standard statistical test procedures.
This article describes our experience tracking the progress of the COVID-19 epidemic in the UK in early 2021. This period is of considerable interest, because a new variant of the virus appeared in the south-east of England in December 2020 and started to spread throughout the country. The lockdown of 5 January 2021 was partially in response to this new variant. The number of new cases quickly rose to a peak around the beginning of the new year and then started to fall. The ability of models to respond to these movements in a timely fashion is clearly important. Here, we investigate how our models fared by showing how the response, as captured by both nowcasts and forecasts, adapted to observations available on a daily basis.Footnote 1
We first examined the results for the country as a whole before moving on to monitor the regions. Regional variation is significant, because in October, some areas of the country, such as north-west England, were particularly hard hit, whereas the big rises in December came primarily from the new variant and were mainly in the south-east. There are systematic movements in daily observations according to the day of the week with the figures for the weekend tending to be lower. Our model is able to take account of these movements without using 7-day moving averages (MA7s) which tend to result in a delayed response when there are rapid upward or downward movements.
Multivariate state-space models can combine information in different series. There are two data sources for new COVID cases. One is the figure published each day, whereas the other is by specimen date. The second series is subject to substantial revisions as new data are processed and the series only settles down after about 3 days. However, it may be a better indicator of the spread of the epidemic, and so the question arises as to whether the information it contains can be combined with that in the published data. This is essentially a question of combining different ‘vintages’, something which is often done with economic data. Sometimes, the observations are made in a different way and at different frequencies, for example, by surveys; see Harvey and Chung (Reference Harvey and Chung2000) and, more recently, Anesti et al. (Reference Anesti, Galvão and Miranda-Agrippino2021). Our treatment of published and specimen data owes much to this literature, but there are some novel features, primarily concerned with time-varying slopes and the notion of balanced growth. The methods may be generalised to deal with leading indicators as in Harvey (Reference Harvey2020).
Section 2 of the paper reviews the model and explains how estimates of the growth rate of daily numbers can be made and how these yield corresponding estimates of instantaneous reproduction number,
 $ {R}_t. $
Our experience with UK data in January is reported in Section 3, and the multivariate models are described and implemented in Section 4.
2. Forecasting and nowcasting with the dynamic Gompertz model
The observational model uses data on the time series of the cumulated total of confirmed cases or deaths,
 $ {Y}_t, $
 $ t=0,1,\dots, T, $
and the daily change. HK show how the theory of generalised logistic growth curves suggests models for
 $ \ln {y}_t, $
where
 $ {y}_t=\Delta {Y}_t={Y}_t-{Y}_{t-1} $
, and the logarithm of the growth rate of the cumulated series,
 $ \ln {g}_t $
, where
 $ {g}_t={y}_t/{Y}_{t-1} $
or
 $ \Delta \ln {Y}_t. $
For the special case of the Gompertz growth curve, the implication is that
 $ \ln {g}_t $
follows a downward linear trend. However, additional flexibility is needed to cope with situations where there are recurrent waves. This may be achieved by a stochastic, or time-varying, trend, so that
 $$ \ln {g}_t={\delta}_t+{\varepsilon}_t,\kern1em {\varepsilon}_t\sim NID\left(0,{\sigma}_{\varepsilon}^2\right),\kern2em t=1,2,\dots, T, $$
whereFootnote 2
 $$ {\displaystyle \begin{array}{ll}{\delta}_t={\delta}_{t-1}+{\gamma}_{t-1}+{\eta}_t,& {\eta}_t\sim NID\left(0,{\sigma}_{\eta}^2\right),\\ {}{\gamma}_t={\gamma}_{t-1}+{\zeta}_t,& {\zeta}_t\sim NID\left(0,{\sigma}_{\zeta}^2\right),\end{array}} $$
and the normally distributed irregular, level and slope disturbances,
 $ {\varepsilon}_t, $
 $ {\eta}_t $
and
 $ {\zeta}_t $
, respectively, are mutually independent. When
 $ {\sigma}_{\zeta}^2 $
is positive but
 $ {\sigma}_{\eta}^2=0 $
, the trend is an integrated random walk (IRW). HK found the IRW trend to be particularly useful for tracking an epidemic, and it will be adopted in the applications here. The speed with which a trend adapts to a change depends on the signal–noise ratio, which for the IRW is
 $ q={\sigma}_{\zeta}^2/{\sigma}_{\varepsilon}^2; $
the trend is deterministic when
 $ q=0. $
Allowing
 $ {\gamma}_t $
to change over time means that the progress of the epidemic is no longer tied to the proportion of the population infected as it would be if
 $ {Y}_t $
followed a deterministic growth curve. Instead, the model adapts to movements brought about by changes in behaviour and policies. If
 $ {\gamma}_t $
falls to zero, the growth in
 $ {Y}_t $
becomes exponential, whereas a positive
 $ {\gamma}_t $
means that the growth rate is increasing.
Stochastic trend models can be estimated using techniques based on state-space models and the KF; see Durbin and Koopman (Reference Durbin and Koopman2012) and Harvey (Reference Harvey1989). The computations for the multivariate model were performed using the STAMP package of Koopman et al. (Reference Koopman, Lit and Harvey2020), whereas the results reported in Section 3 were obtained with a new program in the R language specifically written for this project. The KF outputs the estimates of the state vector
 $ {\left({\delta}_t,{\gamma}_t\right)}^{\prime }. $
Estimates of the state at time
 $ t $
, conditional on information up to and including time
 $ t $
, are denoted
 $ {\left({\delta}_{t|t},{\gamma}_{t|t}\right)}^{\prime } $
and given by the contemporaneous filter while the predictive filter outputs
 $ {\left({\delta}_{t+1|t},{\gamma}_{t+1|t}\right)}^{\prime }. $
The smoother estimates the state at time
 $ t $
based on all
 $ T $
observations in the series and is denoted
 $ {\left({\delta}_{t|T},{\gamma}_{t|T}\right)}^{\prime } $
. Estimation of the unknown variance parameters is by maximum likelihood. Tests for normality and residual serial correlation are based on the one-step ahead prediction errors,
 $ {v}_t=\ln {g}_t-{\delta}_{t|t-1}, $
 $ t=3,\dots, T. $
Additional components, such as day of the week effects, can be added to (1). These may be deterministic or stochastic. Stationary autoregressive or ARMA components may also be included as may explanatory variables, including interventions. However, isolated outliers are most easily handled by treating them as missing observations.
Remark 1. When the observations on daily cases or deaths are small, a negative binomial distribution for
 $ {y}_t, $
conditional on past observations including
 $ {Y}_{t-1}, $
may be appropriate. HK show how the model may be modified to deal with this possibility for a univariate time series. Software can be found in Lit et al. (2020). Estimates of the state based on small numbers are likely to be unreliable, but if the KF is to operate during periods when numbers are small, as they were for COVID-19 cases in the summer of 2020, it may be better to set
 $ {v}_t={g}_t\exp \left(-{\delta}_{t|t-1}\right)-1 $
rather than to treat the observation as missing.
2.1. Forecasting and nowcasting the growth rate of daily observations and R
The direction in which an epidemic is moving is best tracked by nowcasts and forecasts of
 $ {g}_{y,t} $
, the growth rate of
 $ {y}_t $
. Harvey and Kattuman (Reference Harvey and Kattuman2020b) construct the nowcast of
 $ {g}_{y,t} $
from the filtered estimates in the state-space model [(1) and (2)]. Thus,
 $ {g}_{y,t\mid t}={g}_{t\mid t}+{\gamma}_{t\mid t} $
. These estimates can be translated into estimates of the instantaneous reproduction number
 $ {R}_t $
, in a number of ways, as described in Wallinga and Lipsitch (2007). Harvey and Kattuman (Reference Harvey and Kattuman2020b) argue that the most useful for COVID-19 are
 $$ {\tilde{R}}_{t,\tau }=1+\tau {g}_{y,t\mid t}\kern1.5em \mathrm{and}\kern1em {\tilde{R}}_{\tau, t}^e=\exp \kern-1.5pt \left(\tau {g}_{y,t\mid t}\right), $$
where
 $ \tau $
= 4; τ is the generation interval, that is, the number of days that must elapse before an infected person can transmit the disease. The nowcasts of
 $ {y}_t $
peak when
 $ {g}_{y,t\mid t}=0 $
, corresponding to
 $ {\tilde{R}}_{t,\tau }={\tilde{R}}_{\tau, t}^e=1. $
For tracking and forecasting the epidemic, all that is needed are estimates of
 $ {g}_{y,t}. $
The estimates of
 $ {R}_t $
are a by-product. Despite being dependent on assumptions about the generation interval, estimates of
 $ {R}_t $
have become the main metric for reporting the state of the epidemic.
Predictions of
 $ {g}_{y,t}, $
and hence of
 $ {R}_t, $
are given by
 $$ {g}_{y,T+\mathrm{\ell}\mid T}=\exp {\delta}_{T+\mathrm{\ell}\mid T}+{\gamma}_{T+\mathrm{\ell}\mid T}=\exp \left({\delta}_{T\mid T}+{\gamma}_{T\mid T}\mathrm{\ell}\right)+{\gamma}_{T\mid T},\kern2.5em \mathrm{\ell}=1,2,.\dots $$
If
 $ {\gamma}_{T\mid T} $
is zero, the growth of
 $ {y}_t $
is exponential, and it is helpful to characterise it by the doubling time,
 $ \ln 2/{g}_{y,T\mid T}=0.693\exp \left(-{\delta}_{T\mid T}\right). $
When
 $ \exp {\delta}_{T\mid T}+{\gamma}_{T\mid T}>0, $
so that the nowcast
 $ {\tilde{g}}_{y,T\mid T} $
is positive and the estimates of
 $ {R}_T $
given by (3) are greater than one, there is still a saturation level so long as
 $ {\gamma}_{T\mid T} $
is negative; correspondingly, as
 $ \ell \to \infty, $
 $ {\tilde{R}}_{\tau, T+\mathrm{\ell}\mid T}^e\kern2.5pt \to \kern4pt \exp \left({\tau \gamma}_{T\mid T}\right)<1. $
Hence, a negative
 $ {\gamma}_{T\mid T} $
signals a flattening of the curve and an upcoming peak in
 $ {y}_t. $
Remark 2. The basic forecasts are made with the estimates of
 $ {\delta}_T $
and
 $ {\gamma}_T $
. However, alternative scenarios in which
 $ {\gamma}_t $
is assumed to evolve in a certain way, perhaps to reflect changing behaviour and policies, may also be envisaged. If a future scenario arises in terms of a time path for
 $ {R}_{T+\mathrm{\ell}\mid T}, $
it can easily be translated into one for
 $ {\gamma}_{T+\mathrm{\ell}\mid T} $
. The time path for
 $ {\gamma}_{T+\mathrm{\ell}\mid T} $
leads directly to the forecasting equations of
(10)
, and so no simulations are needed for the predictions of
 $ {y}_{T+\mathrm{\ell}} $
.
2.2. Sampling variability of nowcasts and forecasts
Harvey and Kattuman (Reference Harvey and Kattuman2020b) show that the conditional distribution of nowcasts of
 $ {g}_{y,t} $
can be approximated by the conditional distribution of
 $ {\gamma}_t, $
which is normal with mean
 $ {\gamma}_{t\mid t} $
and variance
 $ {\sigma}_{\gamma, t\mid t}^2, $
both of which are produced by the KF.
When
 $ {\tilde{R}}_{t,\tau } $
is defined as
 $ 1+\tau {g}_{y,t}, $
its distribution, conditional on current and past observations, can be treated as
 $ N\Big({g}_{y,t\mid t} $
,
 $ {\tau}^2{\sigma}_{\gamma, t\mid t}^2\Big) $
. On the other hand, the conditional distribution of
 $ {\tilde{R}}_{\tau, t}^e $
is lognormal with mean
 $$ {E}_t\left({\tilde{R}}_{\tau, t}^e\right)=\exp \left(\tau \left({g}_{t\mid t}+{\gamma}_{t\mid t}+\left(\tau /2\right){\sigma}_{\gamma, t\mid t}^2\right)\right) $$
and standard deviation
 $$ {SD}_t\left({\tilde{R}}_{\tau, t}^e\right)={E}_t\left({\tilde{R}}_{\tau, t}^e\right)\sqrt{\left(\exp {\tau}^2{\sigma}_{\gamma, t\mid t}^2-1\right)}. $$
Note that
 $ \exp {\tau}^2{\sigma}_{\gamma, t\mid t}^2-1\simeq {\tau}^2{\sigma}_{\gamma, t\mid t}^2 $
, so when
 $ {E}_t\left({\tilde{R}}_{t,\tau}\right) $
is close to one,
 $ {SD}_t\left({\tilde{R}}_{\tau, t}^e\right)\simeq {SD}_t\left({\tilde{R}}_{t,\tau}\right). $
The probability that
 $ {R}_t $
exceeds one is
 $ \Pr \left({g}_{y,t\mid t}>0\right) $
, and this does not depend on
 $ \tau $
or the formula used to estimate
 $ {R}_t $
from
 $ {g}_{y,t\mid t} $
.
Remark 3. For the Spanish flu data Chowell et al. (
Reference Chowell, Nishiura and Bettencourt
2007
), discuss two approaches to estimating
 $ {R}_t $
based on Susceptible-Exposed-Infectious-Removed models, the more complex one having eight nonlinear differential equations. They also use the Bayesian method of Bettencourt and Ribeiro (2008). Estimates of
 $ {R}_t $
obtained from the model discussed at the end of this section are not out of line with those reported by Chowell et al. (
Reference Chowell, Nishiura and Bettencourt
2007
), and they are simpler, more transparent and open to diagnostic checks on the statistical assumptions.
As with nowcasts, the predictive distribution of
 $ {g}_{y,T+\mathrm{\ell}} $
, and hence of
 $ {R}_{T+\mathrm{\ell}} $
, can be approximated from the conditional distribution of
 $ {\gamma}_{T+\mathrm{\ell}} $
given observations up to and including time
 $ T. $
This is Gaussian with mean
 $ {\gamma}_{T\mid T} $
and variance
 $ {\sigma}_{\gamma, T+\mathrm{\ell}\mid T}^2. $
These estimates are produced by the predictive equations of the KF as in Harvey (Reference Harvey1989, eq. 3.5.5, p. 147). For an IRW trend, it can be shown that
 $$ {Var}_T\left({g}_{y,T+\mathrm{\ell}}\right)\simeq {Var}_T\left({\gamma}_{T+\mathrm{\ell}}\right)={Var}_T\left({\gamma}_T\right)+\mathrm{\ell}{\sigma}_{\zeta}^2={\sigma}_{\gamma, T\mid T}^2+\mathrm{\ell}q{\sigma}_{\varepsilon}^2 $$
when the effect of the daily component is not included. The factor by which the variance of an
 $ \mathrm{\ell} $
step ahead forecast of
 $ {R}_t= $
 $ 1+\tau {g}_{y,t} $
is inflated above that of the variance of the corresponding nowcast is the same as it is for
 $ {g}_{y,t}. $
For example, when
 $ q=0.005 $
,
 $ {\sigma}_{\gamma, T\mid T}^2= $
 $ 0.001 $
and
 $ {\sigma}_{\varepsilon}^2=0.02, $
expression (7) indicates that the SDs of
 $ {g}_{yt} $
and
 $ {R}_t $
will increase by 30 per cent for
 $ \mathrm{\ell}=7 $
and 55 per cent for
 $ \mathrm{\ell}=14. $
The probability that
 $ {R}_{T+\mathrm{\ell}}>1 $
is
 $ \Pr \left({g}_{y,T+\mathrm{\ell}}>0\right)\simeq \Pr \left(z>-{g}_{y,T+\mathrm{\ell}\mid T}/{SD}_{y,T+\mathrm{\ell}\mid T}\right) $
, where
 $ z\sim N\left(0,1\right) $
and
 $ {SD}_{y,T+\mathrm{\ell}\mid T} $
is the square root of (7). Thus, for new cases in England by date of publication, the nowcast made on 18th January was
 $ -0.048 $
, whereas the 14-day forecast was
 $ -0.054 $
. The value of
 $ {\sigma}_{\gamma, T\mid T}^2 $
for
 $ q=0.005, $
and a daily effect included, was
 $ 0.0004, $
while
 $ {\sigma}_{\varepsilon}^2 $
was estimated to be
 $ 0.014. $
These values give
 $ \Pr \left({R}_T>1\right)\simeq \Pr \left(z>0.048/\sqrt{0.0004}\right)=\Pr \left(z>2.40\right)=0.008 $
and
 $ \Pr \left({R}_{T+14}>1\right)\simeq \Pr \left(z>1.30\right)=0.10. $
The ability to make predictions offers a way to deal with reporting delay, as described in Abbott et al. (2020, pp. 3–4). If the observation for time
 $ t-k $
is not available until time
 $ t $
, the current
 $ {R}_t $
is better estimated by a
 $ k $
-step ahead forecast. Taking the parameter values of the previous paragraph gives an increase in the SD of 14 per cent for
 $ k=3. $
2.3. Moving averages
In the UK, the current level of new infections or deaths is usually reported together with the MA7, which is more stable than the daily figure and irons out the daily effects. The moving average figure is often divided by 100,000 so as to give a standardised measure. Estimates of
 $ {g}_{y,t} $
and
 $ {R}_t $
can be calculated directly from the moving average. For example,
 $$ {\hat{R}}_{t,k,\tau }=\frac{\sum_{\kern0pt j=0}^{k-1}{y}_{t-j}}{\sum_{\kern0pt j=\tau}^{k+\tau -1}{y}_{t-j}}=\frac{\sum_{\kern0pt j=0}^{k-1}{y}_{t-j}}{\sum_{\kern0pt j=0}^{k-1}{y}_{t-\tau -j}}=1+\tau {\hat{g}}_{y,t}, $$
where the sum in the denominator starts at a lag of τ and the sums in the numerator and denominator may overlap. The lag of
 $ \tau $
reflects the generation interval, which is number of days that elapse before an infected person can transmit the disease. The Robert Koch Institute (RKI) estimatorFootnote
3 has
 $ \tau =4, $
and
 $ k=4 $
or
 $ 7 $
; setting
 $ k=7 $
has the advantage of smoothing out the daily effect.
Following on from (8), estimates of
 $ {g}_{y,t} $
can be calculated directly from the moving average. However, because the observations are best captured by a location/scale model in which the level is proportional to scale, estimates formed from the level have poor statistical properties. A better approach would be to take logarithms before averaging. Harvey and Kattuman (Reference Harvey and Kattuman2020b, Section 3.3) show that doing so would give a result much closer to that obtained from the model.
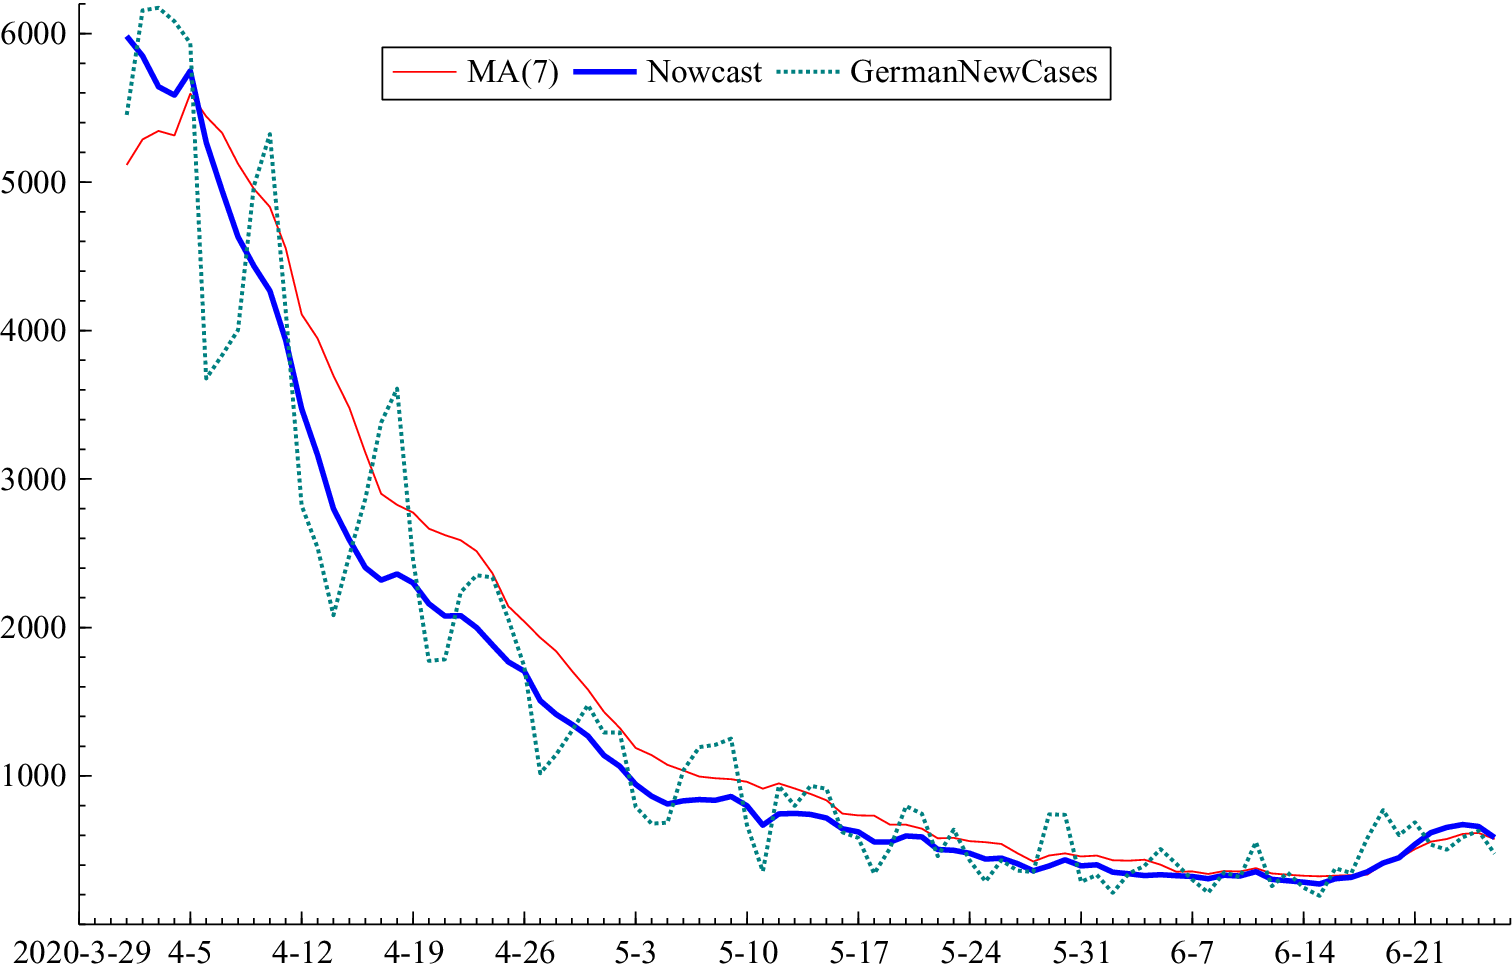
A disadvantage of using simple moving averages to track the epidemic is that they give the last seven observations equal weights and so can be slow to respond to upward or downward movements. By contrast, the model deals directly with day of the week effects and so is able to gradually discount past observations. Hence, it can respond more quickly. Figure 1 shows the nowcasts of the underlying trend in new cases produced by the model for Germany (European Centre for Disease Prevention and Control [ECDC] data), together with the MA7. The attraction of the model is clear, and, of course, it also has the advantage of being able to produce forecasts. Lagging the MA7 so it is centred at
 $ t-3 $
would shift it more in line with the observations but at the cost of losing the last three observations.
(Colour online) German new cases from 29th March to 26th June (data sourced from ECDC) showing nowcasts from model and 7-day moving averages

2.4. Forecasting the trend in future observations
The forecasts of the trend in future values of
 $ \ln {g}_t $
in the dynamic Gompertz model are given by
 $ {\delta}_{T+\mathrm{\ell}\mid T}={\delta}_{T\mid T}+{\gamma}_{T\mid T}\mathrm{\ell}, $
 $ \mathrm{\ell}=1,2,\dots, $
where
 $ {\delta}_{T\mid T} $
and
 $ {\gamma}_{T\mid T} $
are the KF estimates of
 $ {\delta}_T $
and
 $ {\gamma}_T $
at the end of the sample. Forecasts of the trend in the daily observations,
 $ {y}_t, $
may be obtained from a recursion for the trend in their cumulative total,
 $ {Y}_t $
, namely
 $$ {\mu}_{T+j\mid T}={\mu}_{T+j-1\mid T}\left(1+{g}_{T+j\mid T}\right)={\mu}_{T+j-1\mid T}\left(1+\exp {\delta}_{T+j\mid T}\right),\kern2.5em j=1,2,\dots, \mathrm{\ell},\kern1.5em $$
with
 $ {\mu}_{T\mid T}={Y}_T $
. The trend in the daily figures is then
 $$ {\mu}_{y,T+\mathrm{\ell}\mid T}={g}_{T+\mathrm{\ell}\mid T}{\mu}_{T+\mathrm{\ell}-1\mid T}\kern0.5em ,\kern2em \mathrm{\ell}=1,2,.\dots $$
Combining the above equations gives
 $$ {\displaystyle \begin{array}{l}{\mu}_{y,T+\mathrm{\ell}\mid T}={Y}_T\exp {\delta}_{T+\mathrm{\ell}\mid T}\prod \limits_{j=1}^{\mathrm{\ell}-1}\left(1+\exp {\delta}_{T+j\mid T}\right),\kern1.5em \mathrm{\ell}=2,3,\dots, \\ {}{\mu}_{y,T+1\mid T}={Y}_T\exp {\delta}_{T+1\mid T}.\end{array}} $$
Daily effects can be added to
 $ {\delta}_t. $
In this case, forecasts of the observations themselves, that is,
 $ {\hat{y}}_{T+\mathrm{\ell}\mid T} $
and
 $ {\hat{Y}}_{T+\mathrm{\ell}\mid T}, $
are given by adding the filtered value of the daily component to the trend component,
 $ {\delta}_{T+\mathrm{\ell}\mid T} $
.
The conditional distribution of future values of the trend,
 $ {\delta}_{T+\mathrm{\ell}}, $
in
 $ \ln {g}_{T+\mathrm{\ell}} $
is Gaussian. The conditional distribution of
 $ \exp {\delta}_{T+\mathrm{\ell}} $
is therefore lognormal, but, for more than one-step ahead, the distribution of the corresponding trend in the observations is not lognormal because of the presence of the unknown cumulative total in our equation for the underlying trend which is
 $ {\mu}_{y,T+\mathrm{\ell}}= $
 $ {g}_{T+\mathrm{\ell}}{Y}_{T+\mathrm{\ell}-1}, $
 $ \mathrm{\ell}=2,3,.\dots $
However, since
 $ {Y}_t $
changes relatively slowly, it may be possible to ignore its effect by treating it as fixed.
An alternative to working with the distribution of the trend of the observations is to convert a prediction interval for
 $ \ln {g}_{T+\mathrm{\ell}} $
into one for
 $ {\mu}_{y,T+\mathrm{\ell}} $
by replacing
 $ {\delta}_{T+j\mid T} $
in (9) by
 $ {\delta}_{T+j\mid T}\pm z.{\sigma}_{\delta, T+j\mid T}, $
where
 $ {\sigma}_{\delta, T+j\mid T}^2 $
is the conditional variance of
 $ {\delta}_{T+j} $
and
 $ z $
is a constant such as one or two. Again, with
 $ {Y}_t $
changing slowly, there may be a case for simply constructing a prediction interval from (10) by replacing
 $ {\delta}_{T+\mathrm{\ell}\mid T} $
by
 $ {\delta}_{T+\mathrm{\ell}\mid T}\pm z.{\sigma}_{\delta, T+j\mid T} $
for
 $ \mathrm{\ell}=\mathrm{1,2,3},\dots . $
If a prediction interval for the observations themselves is wanted, the standard deviation
 $ {\sigma}_{\delta, T+j\mid T} $
may be replaced by
 $ \sqrt{\sigma_{\delta, T+j\mid T}^2+{\sigma}_{\varepsilon}^2} $
in the preceding formulae. Allowance may also need to be made for a daily component.
2.5. Nowcasts of the trend in daily observations
The nowcast for the trend in
 $ {y}_t $
is
 $$ {\mu}_{y,t\mid t}={Y}_{t-1}\exp {\delta}_{t\mid t},\kern3em t={t}^{\prime },\dots, T. $$
Using the current rather than the lagged cumulative total, that is,
 $ {Y}_t\exp {\delta}_{t\mid t}, $
makes virtually no difference once
 $ {Y}_t $
has become relatively large. Since
 $ {\delta}_t $
is conditionally Gaussian,
 $ \exp {\delta}_t $
is lognormal, and a credible interval may be produced if required.
Example Daily cases of influenza
Footnote
4 in San Francisco during the worldwide outbreak of Spanish flu in 1918 show exponential growth in the upward phase; see Chowell et al. (
Reference Chowell, Nishiura and Bettencourt
2007
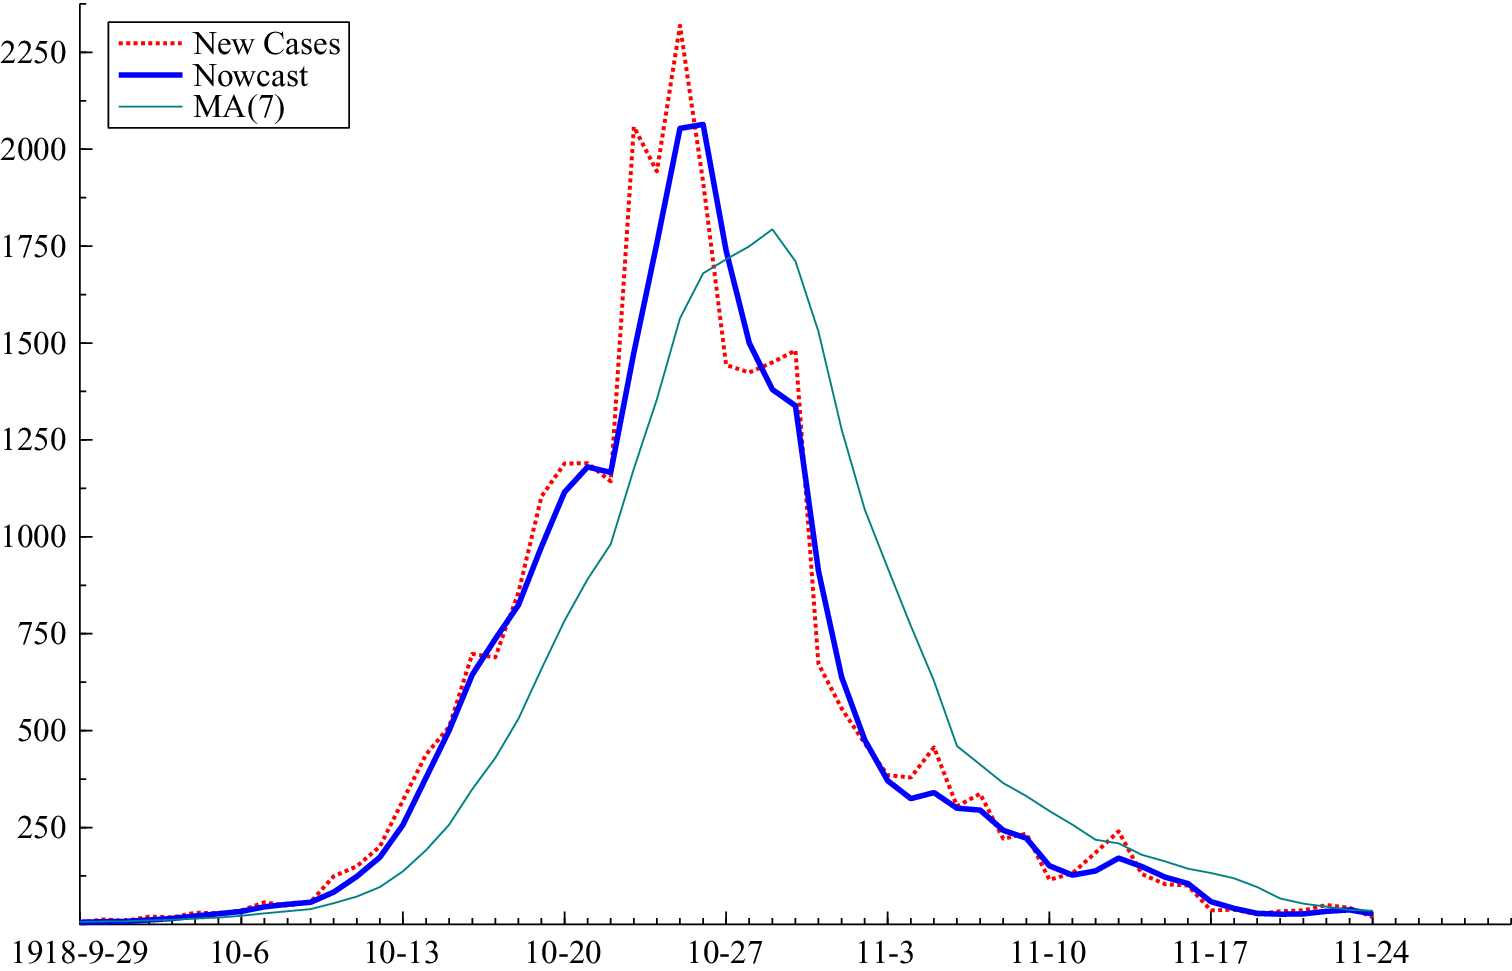
). Consequently, a plot of the logarithm of the growth rate (LDL) shows very little downward movement at first. Fitting the Gaussian dynamic Gompertz to the whole series gives
 $ q=0.05. $
The slope in LDL adapts, so it is close to zero in early October and then falls so as to capture the downward phase.
Figure 2 contrasts the nowcasts with an MA7, which lags behind the observations throughout.
(Colour online) Nowcasts and 7-day moving averages for San Francisco flu from 29 September to 24 October 1918

3. COVID-19 in the UK and regions
Our empirical focus is on trends in new cases in the UK, its nations and English regions. We concentrate on early 2021, when the new strain of COVID-19 was the leading cause of increase in infection rates, initially in the south-east of England.
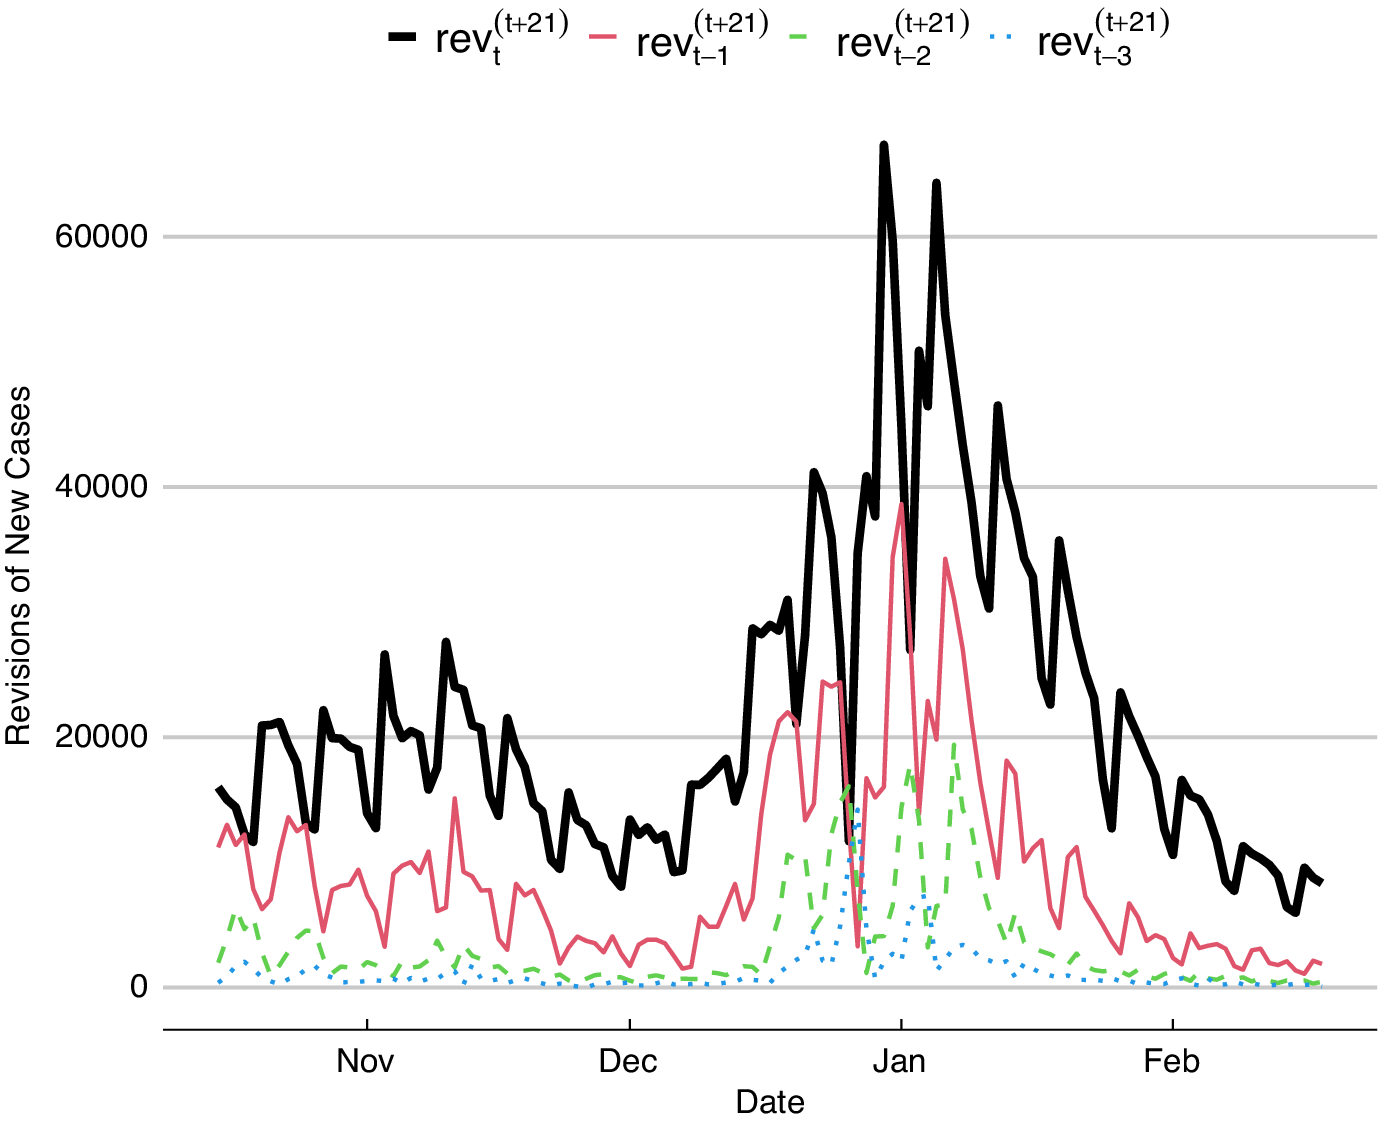
The daily counts of COVID-19 cases are based on the results of laboratory-based or swab tests for the presence of SARS-CoV-2 virus in specimens taken from people, as well as results of antibody serology tests. The new cases’ data are available by the date the specimen was collected (the specimen date series) and by the date the testing process was completed and the case was first included in the published totals (published date series). A key issue is how information in the specimen date series can be combined with that in the published date series. There are pronounced daily effects in the specimen date series, which, however, can be accommodated in a model with seasonal effects. More importantly, the specimen date series is subject to substantial reporting delays and revisions. Figure 3 illustrates the extent of revisions over time of the specimen date series, with reference to the same data as revised 3 weeks in the future by when revisions are almost complete and very small. To be precise, let
 $ {y}_t^{(v)} $
denote the
 $ v $
-day ahead update (or vintage) for
 $ {y}_t $
, the specimen cases recorded on date
 $ t $
. Thus, the current vintage of the data is given by the series:
 $ {y}_t^{(t)} $
,
 $ {y}_{t-1}^{(t)},\dots, {y}_1^{(t)} $
. The date
 $ r $
revision to the current vintage of specimen cases for date
 $ i $
is defined as:
 $ {rev}_i^{(r)}={y}_i^{(r)}-{y}_i^{(t)} $
. Figure 3 presents the revisions 3 weeks ahead for the last four entries of the current vintage,
 $ {rev}_t^{\left(t+21\right)},\dots, {rev}_{t-3}^{\left(t+21\right)} $
. It is evident that except in the neighbourhood of Christmas day and New Year’s day when data quality was very poor, revisions were substantially complete within 3 days.
(Colour online) Differences between new cases in the specimen date series at
 $ t $
and the same data revised 3 weeks in the future

A technical issue led to a large number of infections that occurred between 25 September and 2 October 2020 going unrecorded and then being assigned to 3rd and 4th October, thereby creating an artificial spike. Rather than attempting to reallocate observations, we start our analysis with data published on 5 October 2020. Cases by specimen date were not affected by the above issue. On 27 November 2020, another technical issue led to the total number of people who tested positive being revised down.
We fit models to the logarithm of the growth rate of new cases as measured by the specimen date up to and including time
 $ t-3 $
and report nowcasts and forecasts of
 $ {g}_{y,t+h} $
and
 $ {\tilde{R}}_{t+h}^e $
for
 $ h $
=
 $ -3 $
,
 $ 0 $
,
 $ 7 $
and
 $ 14 $
. For models fitted to new cases measured by published date, we report nowcasts and forecasts for
 $ h=0,7 $
and
 $ 14 $
. Note that the published data for time
 $ t $
are actually released at
 $ t+1 $
.
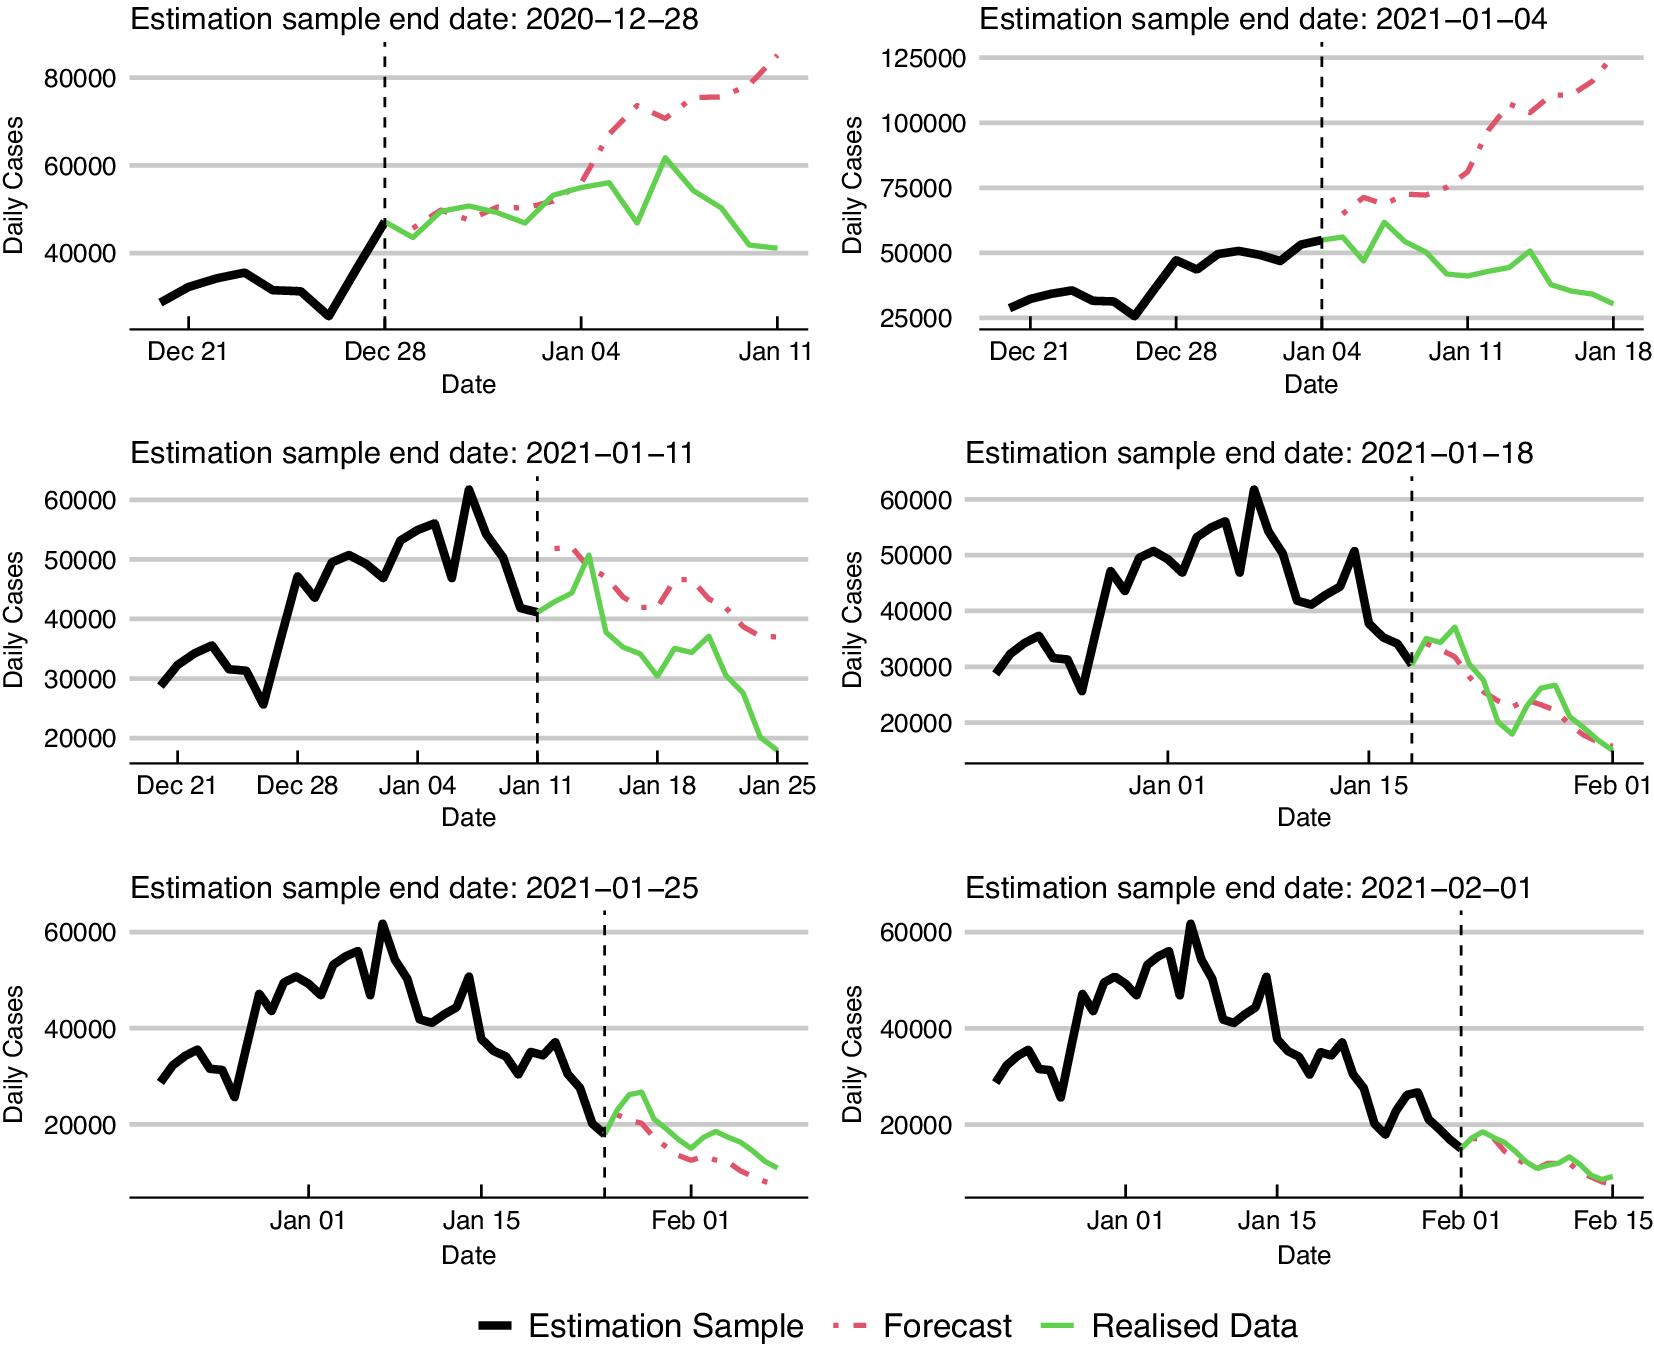
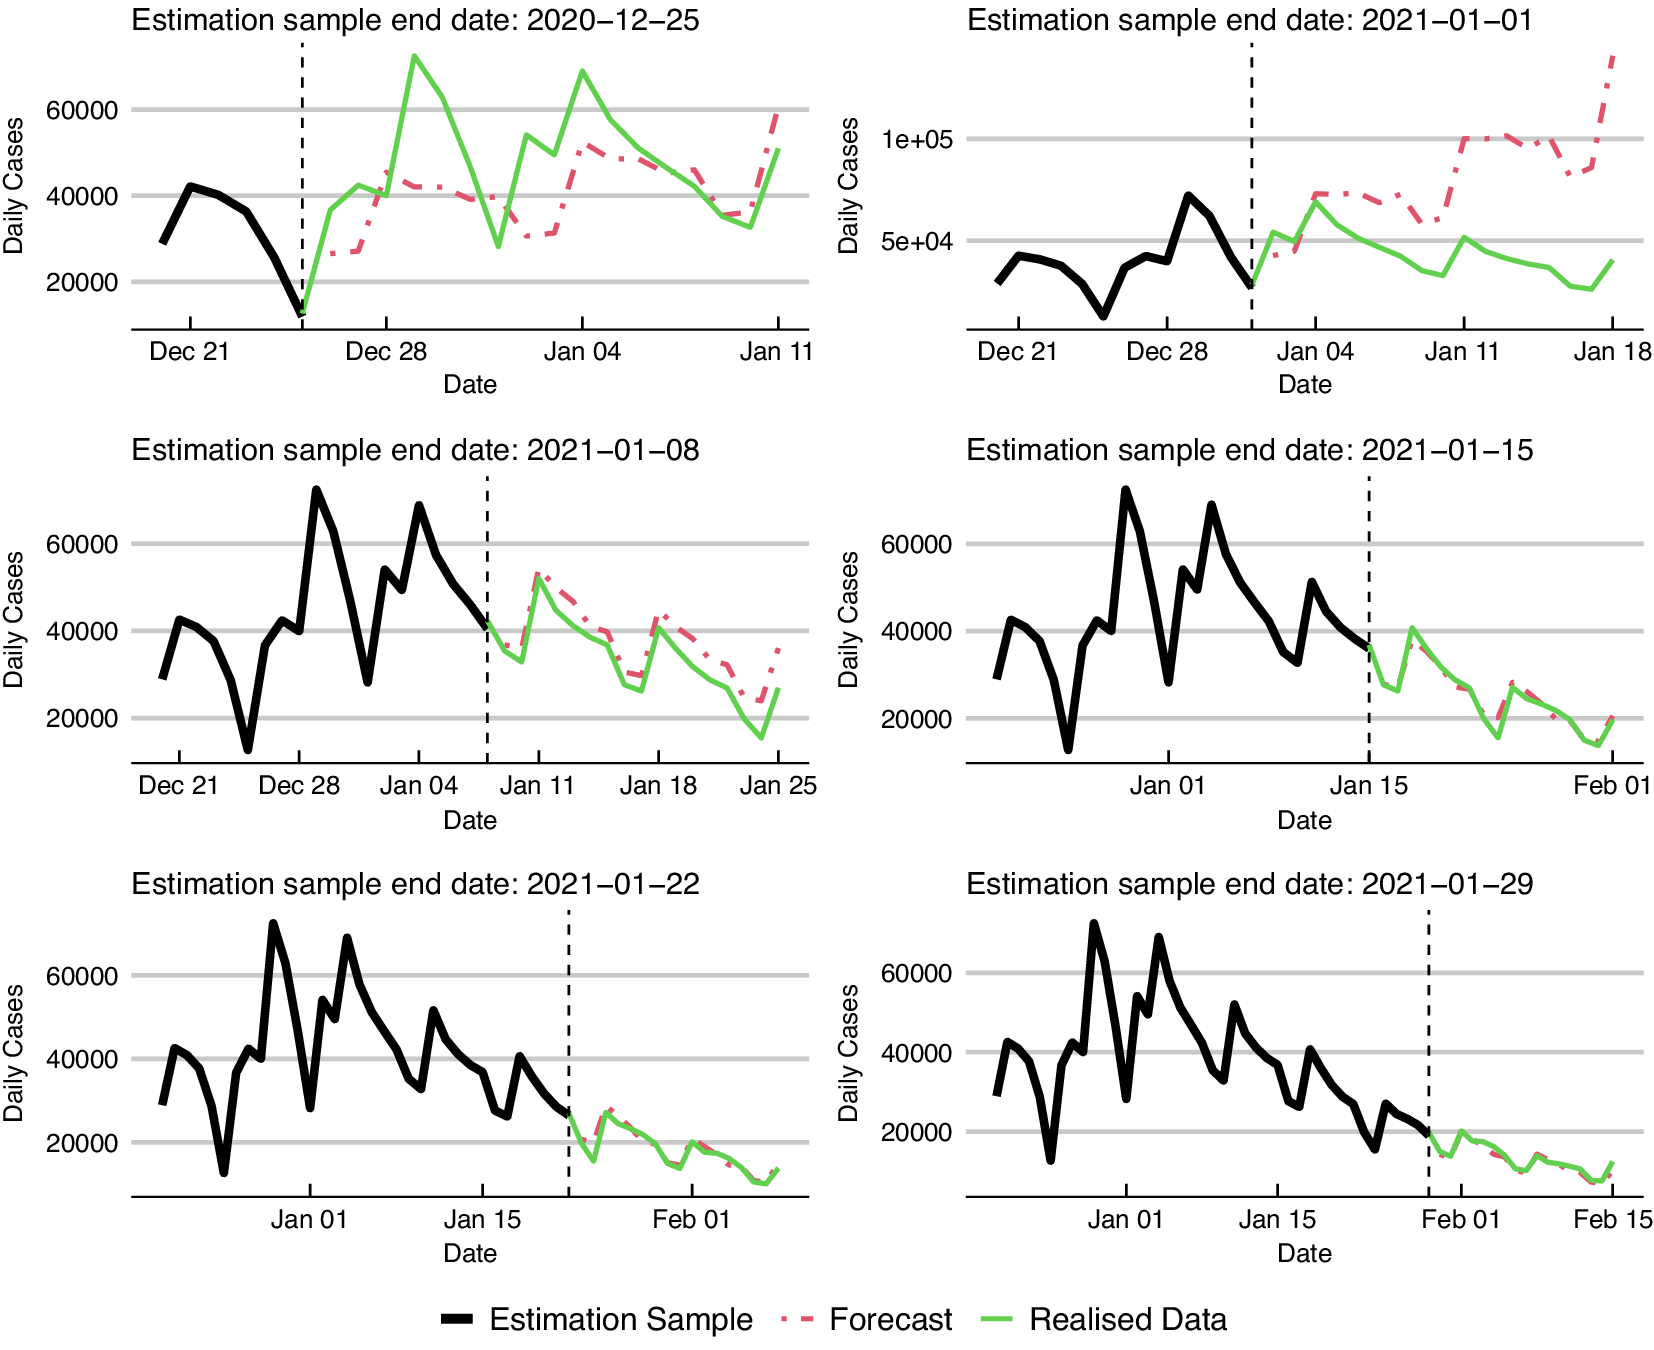
The forecasts we generate make no assumptions about the effects of measures imposed to control the spread of the epidemic. Thus, the forecasts made at the start of the year overshoot the eventual numbers. As the restrictive measures begin to bite, the forecasts made by the model adapt.
3.1. Nowcasts and forecasts in January 2021
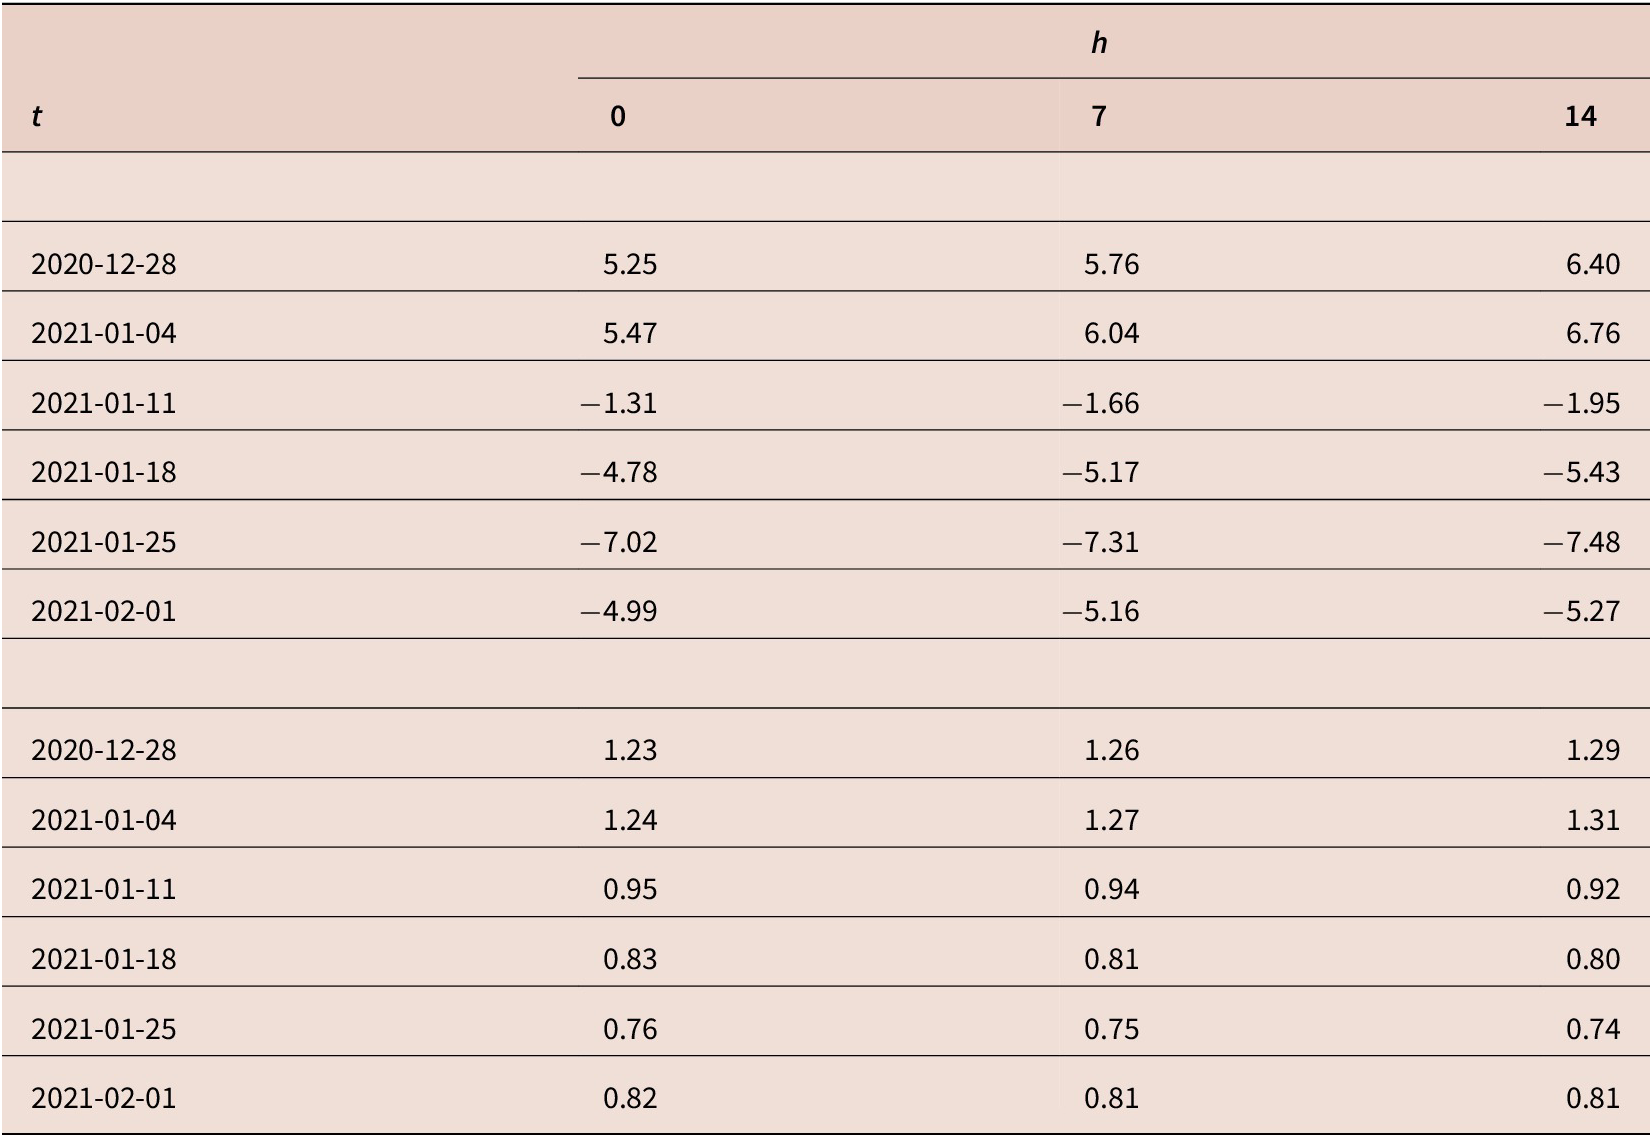
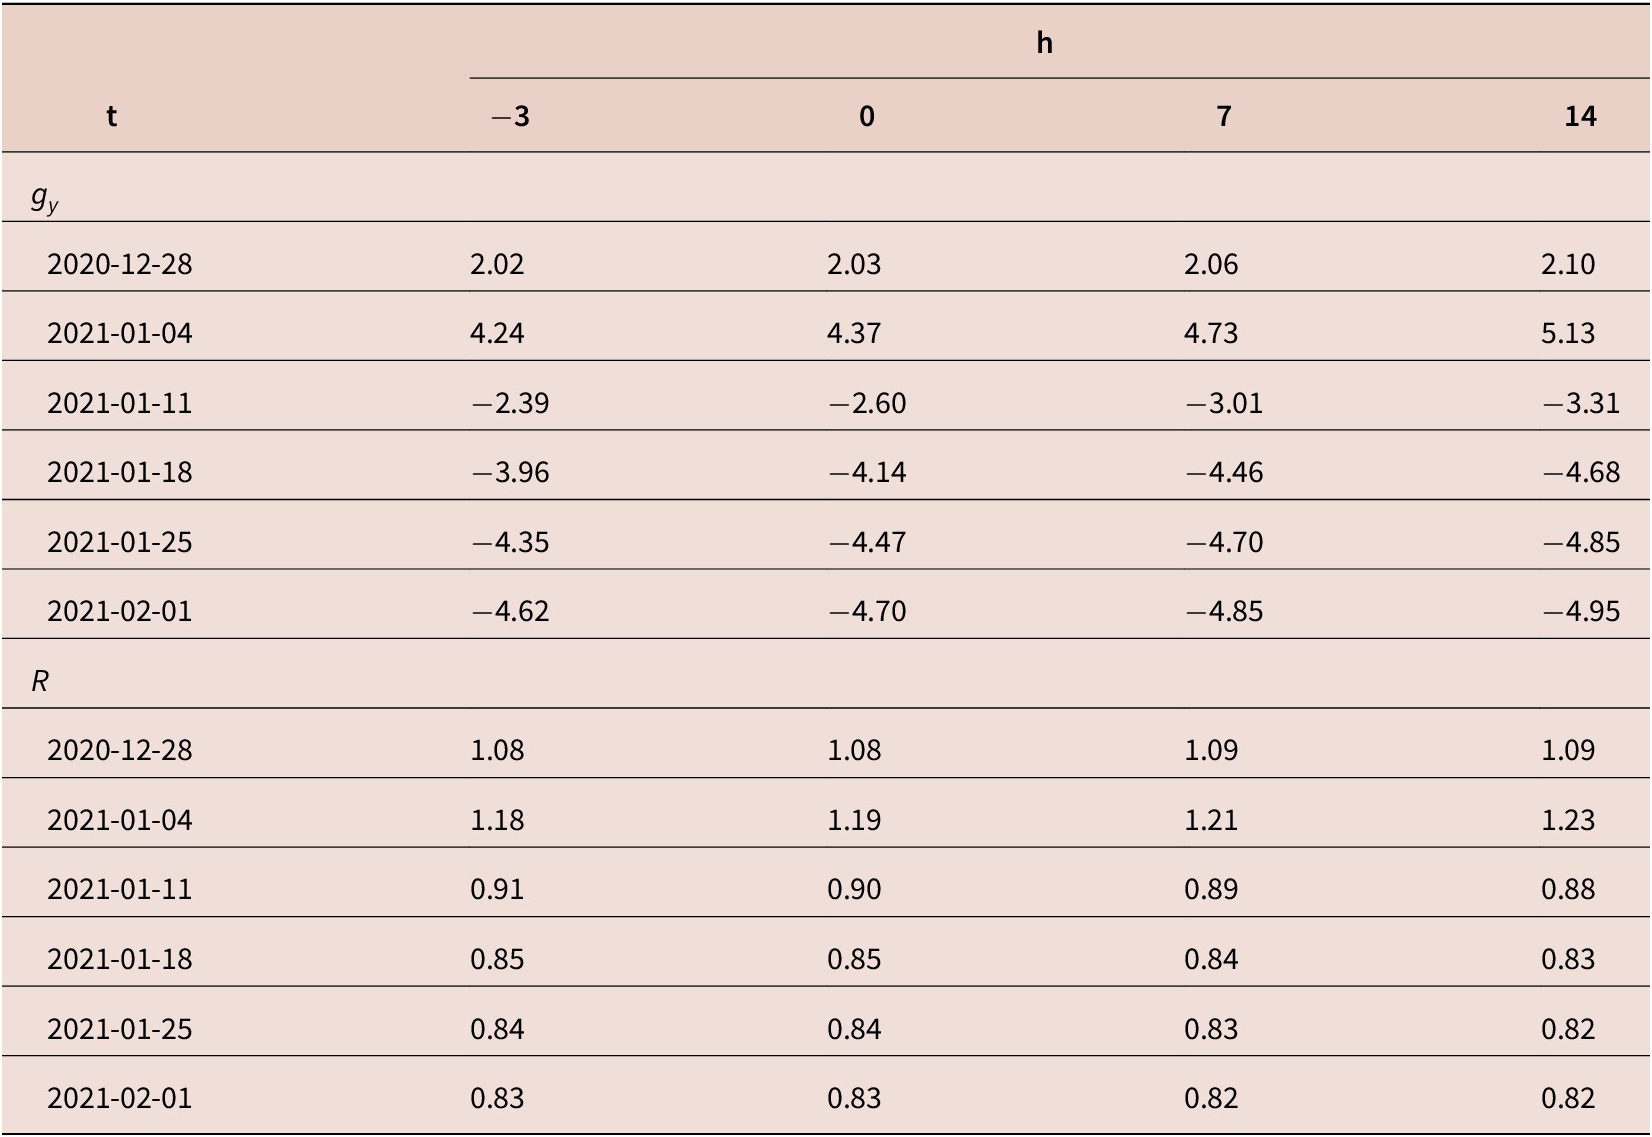
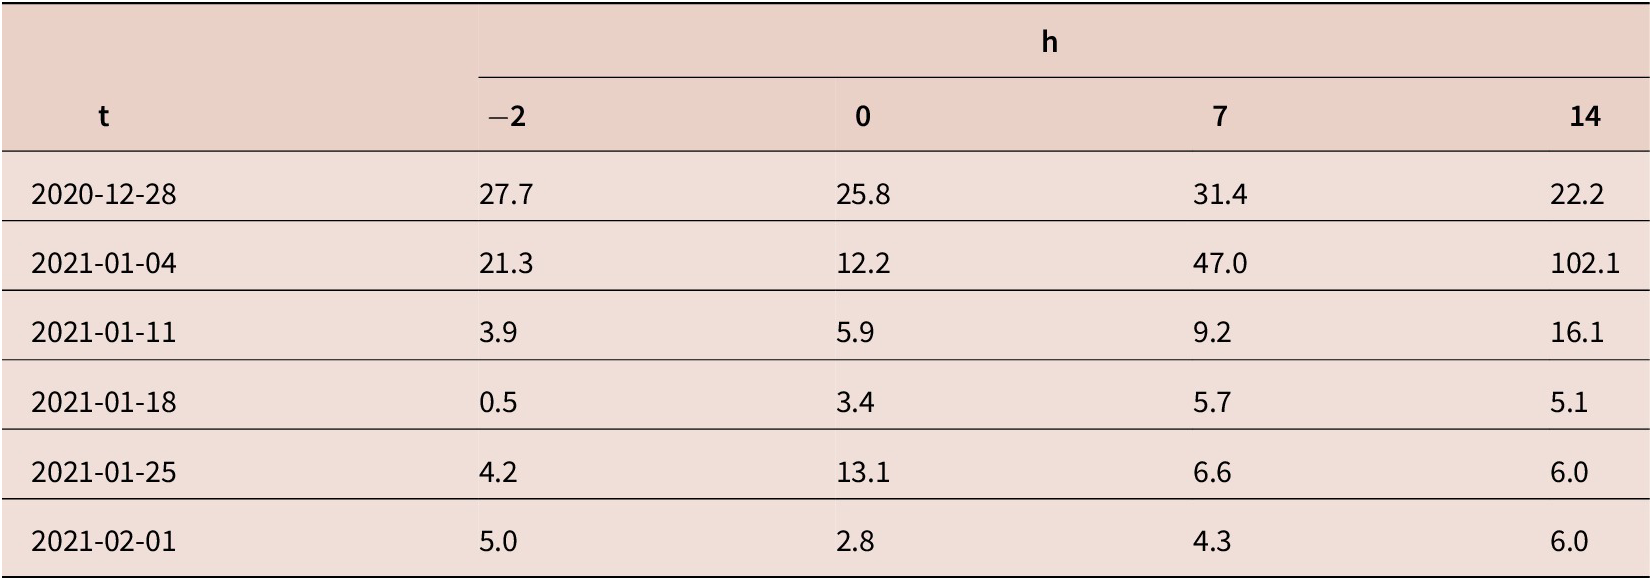
Tables 1 and 2 present, at weekly intervals starting on 28 December 2020, nowcasts and forecasts of the growth rate of new cases,
 $ {g}_{y,t},{g}_{y,t+7} $
and
 $ {g}_{y,t+14} $
, and of the reproduction numbers,
 $ {R}_t,{R}_{t+7} $
and
 $ {R}_{t+14} $
, for England. Table 1 uses the publication date series, whereas table 2 is for the specimen date series. The projections from both series are based on trends without daily effects, and show broadly similar patterns of accelerating growth rates before Christmas that increased through the New Year to the first observations in 2021. The lock down of 5 January 2020 brought both sets of growth rates and reproduction numbers down to the same broad range within a week. The growth rates estimated from both the publication date series and the specimen date series have continued to be negative since then.
England:
 $ {g}_{y,t+h} $
and
 $ {\tilde{R}}_{t+h}^e $
based on publication date series

England:
 $ {g}_{y,t+h} $
and
 $ {\tilde{R}}_{t+h}^e $
based on specimen date series

Figure 4 gives the forecasts of new cases based on publication date series for England, including the daily effect. Figure 5 gives the forecasts based on the specimen date series. Vertical dashed lines denote the end of the estimation sample. These figures demonstrate that once past the imposition of the January lockdown, the model adapted quickly to the change in the series and in a relatively stable environment provided accurate forecasts.
(Colour online) England: forecasts of new cases based on publication date series

(Colour online) England: forecasts of new cases based on specimen date series

3.2. Forecast accuracy
We assess forecast accuracy using mean absolute percentage error (MAPE) over the 14-day period from the date on which the data are released. For the publication date series, we evaluate forecasts against subsequent realisations of the same series, whereas for specimen date series, we evaluate forecasts against the first vintage with a release date that allows the first major revisions to vanish from the evaluation sample. This also maintains a fixed number of days for each evaluation date relative to the forecast origin for revisions to enter the evaluation sample. Thus, evaluation data for the specimen data series with vintage dated
 $ t $
require evaluation data of vintage (
 $ v $
) from
 $ {y}_{t-2}^{(v)} $
to
 $ {y}_{t+14}^{(v)} $
, because we truncate the estimation sample at
 $ {y}_{t-3}^{(t)} $
. We choose a vintage of
 $ v=t+17 $
to allow for the discarding of the heavily revised data at
 $ t+15 $
to
 $ t+17. $
Where this is not possible due to lack of data, we set
 $ v $
equal to the last date upon which data are available (which in figure 5 is 23 February 2021). For publication date series ending at time
 $ t $
, we require evaluation data from
 $ {y}_{t+1}^{(j)} $
to
 $ {y}_{t+14}^{(j)} $
. As the publication data are just the first release of the specimen data, this results in the evaluation sample
 $ {y}_{t+1}^{\left(t+1\right)},\dots, {y}_{t+14}^{\left(t+14\right)} $
.
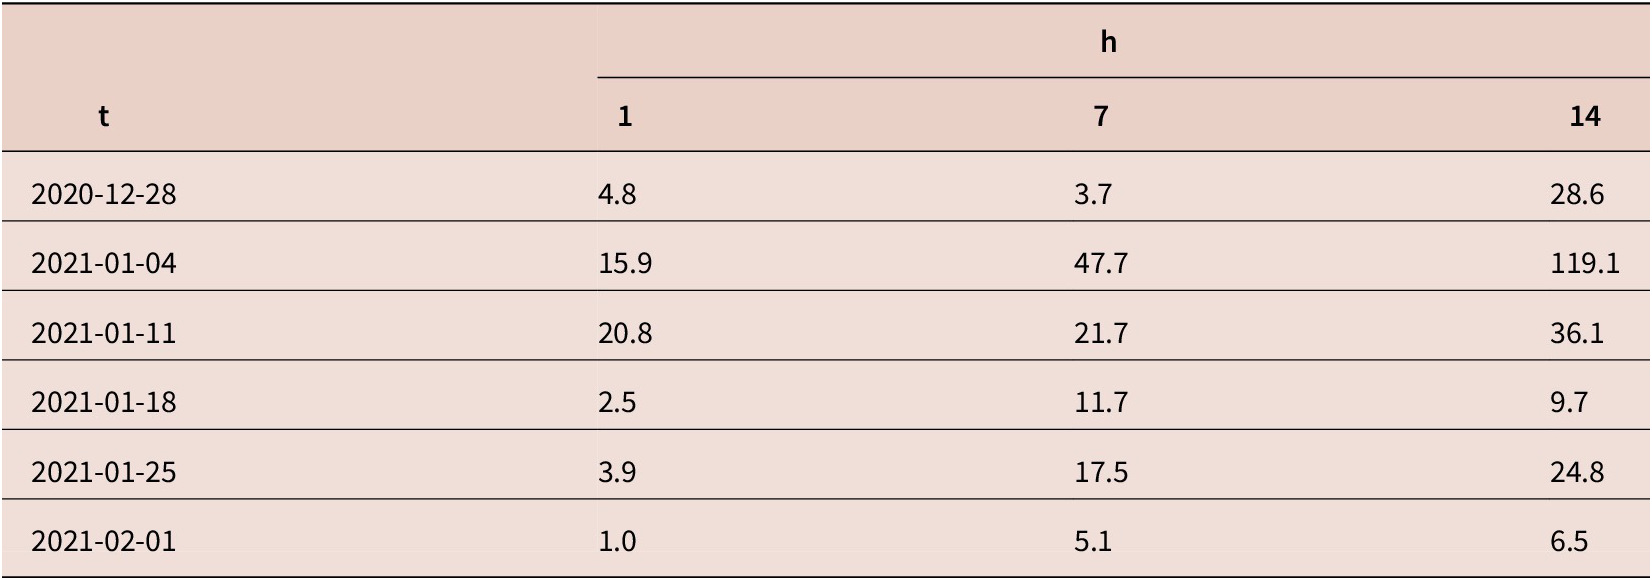
Table 3 reports the MAPE for the forecasts of new cases based on the publication date series. Recall that data on new cases at
 $ t $
become available at
 $ t+1 $
in the publication date series. Table 4 reports the corresponding forecasts for the specimen date series. Accuracy is comparable for nowcasts and forecasts generated from the two series. Once the shocks to data quality over Christmas and the New Year are past and the initial effect of the January lockdown has worked through, both the 7- and 14-day ahead forecasts become more accurate.
England: accuracy (mean absolute percentage error) of forecasts of publication date series of new cases

England: accuracy (mean absolute percentage error) of forecasts of specimen date series of new cases

3.3. Comparison with R published by DHSS and SAGE
The benchmarks for our results are the estimates of the growth rate and
 $ R $
values published jointly by the Department of Health and Social Care and the Scientific Advisory Group for Emergencies, based on contributions by different modelling groups using a variety of data sources. Estimates can vary between different models and are presented as ranges. For example, on 5 February 2021, the published range estimates for England were
 $ \left[\mathrm{0.7,0.9}\right] $
for
 $ {R}_t $
and
 $ \left[-5\%,-2\%\right] $
for the growth rate. Note that due to time delays, estimates reflect transmission of the disease over the past few weeks.
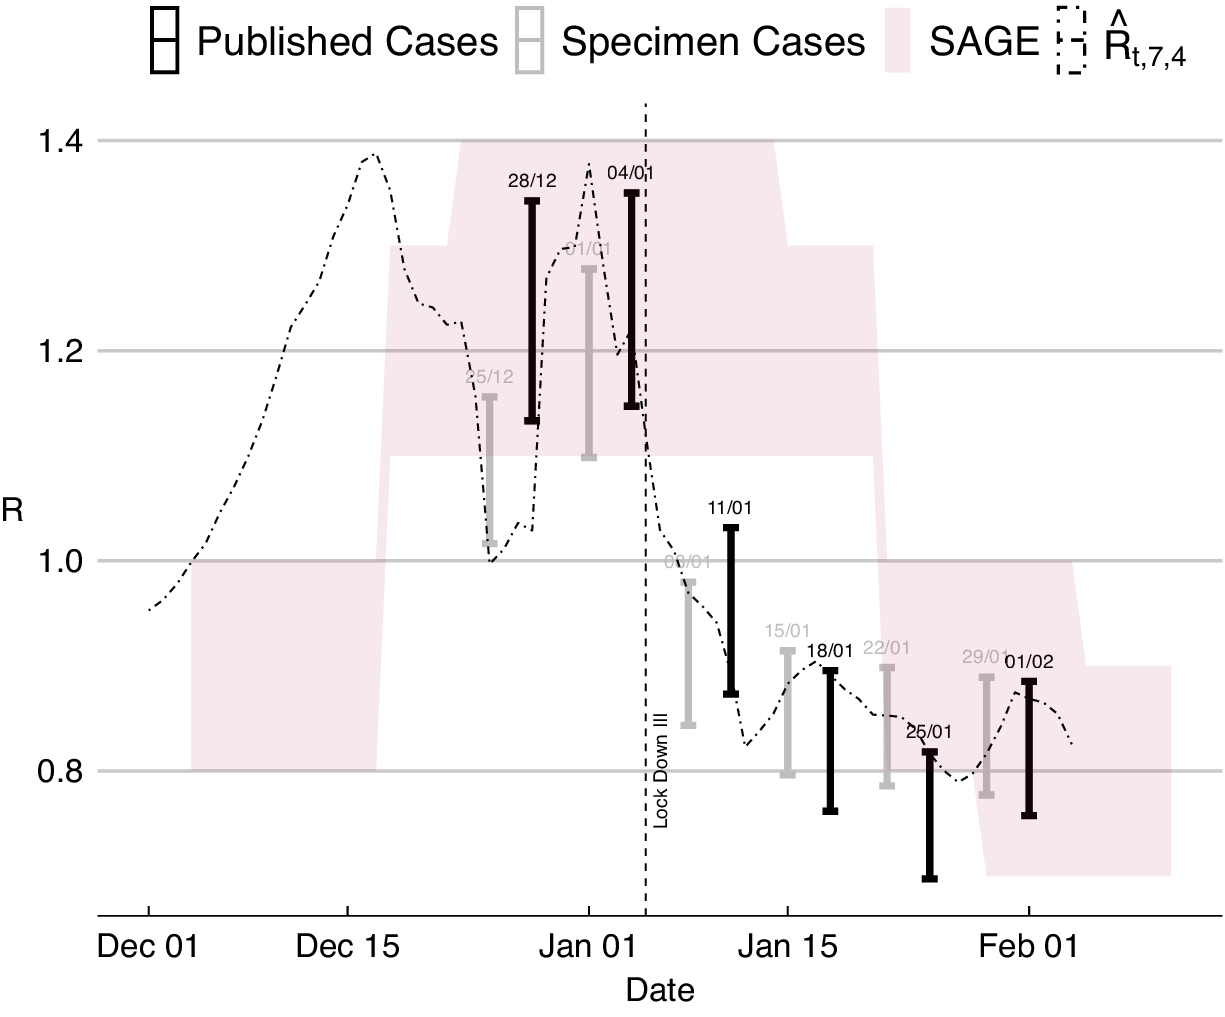
Figure 6 presents the model-based estimates of
 $ R $
for England using the publication and specimen date series, and for comparison, the empirical estimate of
 $ R $
based on the RKI estimator (Section 2.3), as well as the range estimates of
 $ R $
published by SAGE, is obtained from https://www.gov.uk/guidance/the-r-number-in-the-uk. The model-based estimates of
 $ R $
are quicker to reveal the effect of the January lockdown on infection transmission than the SAGE estimates.
(Colour online) Estimates of R based on publication and specimen date series vis-a-vis R ranges published by SAGE

Analysis and results corresponding to the above for the UK, other nations and the regions of England are presented in an online supplement to this paper.
4. Combining observations by publication date and specimen date
Methods of dealing with preliminary observations and observations at different vintages have long been employed in econometrics. Our treatment of published and specimen data owes much to this literature, but there are some novel features, primarily concerned with time-varying slopes and the notion of balanced growth. The techniques may be generalised to deal with situations where growth may not be balanced. Similar techniques may be employed when one series is a leading indicator of the other.
The bivariate model has observations on the first variable (published series), which is effectively a leading indicator, available at time
 $ t, $
whereas the second (specimen series) is only observed after
 $ k $
periods. Thus, at time
 $ t $
, the observations on
 $ \ln {g}_{2t} $
are missing for
 $ t-k+1,\dots, t $
. The model is
 $$ {\displaystyle \begin{array}{l}\ln {g}_{1t}={\delta}_t+{\psi}_{1t}+{\varepsilon}_{1t},\kern7em t=1,\dots, T,\\ {}\ln {g}_{2t}={\delta}_t+\overline{\delta}+{\psi}_{2t}+{\varepsilon}_{2t},\\ {}\kern1em {\psi}_{jt}={\phi}_j{\psi}_{j,t-1}+{\eta}_{jt},\kern6.5em {\eta}_{jt}\sim NID\left(0,{\sigma}_{\eta j}^2\right).\end{array}} $$
where
 $ \overline{\delta} $
is a constant term;
 $ {\delta}_t $
will contain a constant that can be (arbitrarily) assigned to series one. As in the univariate models of the last section, the trend,
 $ {\delta}_t, $
is an IRW that contains the information needed to estimate the underlying movements in the growth rate of the target series,
 $ {g}_{2,y,t} $
. All disturbances, including
 $ {\varepsilon}_{1t} $
and
 $ {\varepsilon}_{2t}, $
are Gaussian and assumed to be mutually as well as serially independent. Provided
 $ \mid {\phi}_j\mid <1 $
,
 $ j=1,2,\dots, $
the series are co-integrated of order (2,2), that is
 $ CI\left(2,2\right), $
with balanced growth. The difference
 $ \ln {g}_{1t}-\ln {g}_{2t} $
is a stationary ARMA(2,2) process, but setting
 $ {\phi}_1={\phi}_2 $
gives an AR(1) plus noise.
The KF provides the (filtered) state estimates needed to compute the nowcasts for
 $ {g}_{2,y,T}, $
 $ {R}_T $
and
 $ {y}_{2T.} $
As new observations become available, these nowcasts are updated by the KF. Smoothed estimates of variables from
 $ t=T-k+1 $
to
 $ t=T-1 $
can be computed if needed. Forecasts of the state beyond time
 $ T $
are made by the predictive KF, and corresponding forecasts of
 $ {R}_t $
and
 $ {y}_{2t} $
can be formed. Daily effects are included in the applications and are handled in (11) by adding a ‘seasonal’ component.
A modified version of the model confines the AR(1) component to the first variable, so that
 $$ {\displaystyle \begin{array}{l}\ln {g}_{1t}={\delta}_t+{\psi}_t+{\varepsilon}_{1t},\kern7em t=1,\dots, T,\\ {}\ln {g}_{2t}={\delta}_t+\overline{\delta}+{\varepsilon}_{2t},\\ {}\kern1em {\psi}_t={\phi \psi}_{t-1}+{\eta}_{1t},\kern6.5em {\eta}_t\sim NID\left(0,{\sigma}_{\eta}^2\right).\end{array}} $$
An advantage of this simplification is that the signal–noise ratio in the target can be compared with that of a univariate model and, if desired, set to a preassigned value.
Nowcasts of the trend in observations are obtained from recursions similar to those in Section 2.4, except that filtered estimates of
 $ {\delta}_t $
are replaced by smoothed ones. Thus,
 $$ {\mu}_{T-k+\mathrm{\ell}\mid T}={\mu}_{T-k+\mathrm{\ell}-1\mid T}\left(1+{g}_{T-k+\mathrm{\ell}\mid T}\right)={\mu}_{T+\mathrm{\ell}-1\mid T}\left(1+\exp {\delta}_{T-k+\mathrm{\ell}\mid T}\right),\kern2.5em \mathrm{\ell}=1,2,\dots, k\kern1.5em $$
with
 $ {\mu}_{T\mid T-k}={Y}_T, $
so
 $$ {\mu}_{y,T+\mathrm{\ell}\mid T}={g}_{T+\mathrm{\ell}\mid T}{\mu}_{T+\mathrm{\ell}-1\mid T}\kern0.5em ,\kern2em \mathrm{\ell}=1,2,\dots, k. $$
The recursions can be continued to give forecasts. The difference is that when
 $ \mathrm{\ell}>k, $
the
 $ {\delta}_{T-k+\mathrm{\ell}\mid T}^{\prime }s $
are forecasts, not smoothed estimates.
The bivariate model (12) was fitted to data available on 19th January. The observations start on 4th October and finish on 18th January for the published series and on 15th January for specimen series. The Christmas day and New Year specimen observations were treated as missing. The reasons for omitting the last three specimen dated figures were set out in Section 3. Estimation details can be found in Appendix B.
The estimates of
 $ {g}_{y,T} $
and
 $ {R}_{4_T}^e $
for the specimen dated series are
 $ -0.040\kern0.5em (0.026) $
and
 $ 0.85 $
 $ (0.10) $
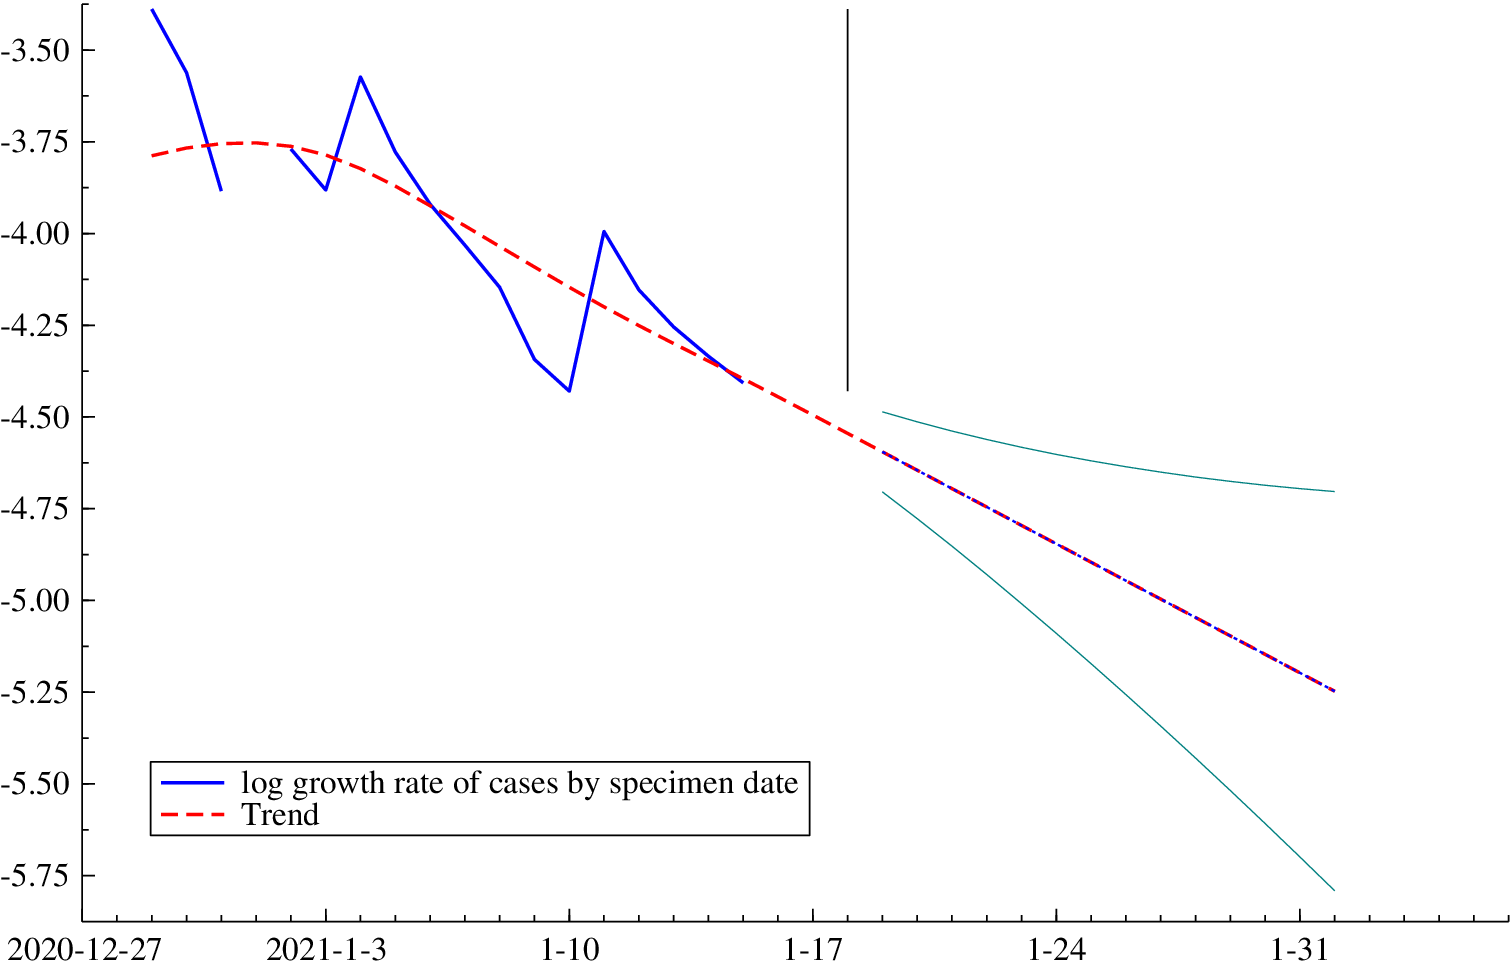
, respectively. These are the same (to two decimal places) as the estimates for the univariate series. Figure 7 shows nowcasts, from 16th to 18th January, and forecasts, from 19th, of the trend in specimen data. The prediction interval for the observations on
 $ \ln {g}_t $
is one st
(Colour online) Forecasts of trend in specimen cases made with observations up to 15 January 2021 but using published data up to 18 January 2021

andard deviation either side of its predicted trend. (A daily effect was not included in the model.)
5. Conclusions and future directions
This article has demonstrated the way in which our new time series models are able to track the progress of the COVID-19 epidemic in the UK in early 2021. The models are not only simple and transparent, but are able to adapt quickly to changes in key series. This ability to respond in a timely fashion is illustrated by the comparison of our estimates of the current R number with those produced by SAGE. The complexity of the behavioural response to lockdown and the restrictive measures imposed by the Tier system in different areas in late 2020 makes a formal structural modelling difficult. The roll out of the vaccine adds yet more complexity. Our models track these changes and project forward to make short-term forecasts of the situation over the next few weeks. Models are estimated for the four UK nations and for the regions within England. All the models have the same form.
We show how multivariate generalisations of our models can combine information in different series, some of which are subject to substantial revisions. The approach derives from econometric techniques for handling different vintages, but there are some novel technical features. The methods are new to epidemiology. We demonstrate that joint modelling of published and specimen dated observations on new cases can be accomplished without too much difficulty. The methods may be adapted to use some time series as leading indicators for others. Further work on using new cases as a leading indicator of admissions and deaths is currently underway.
Supplementary Materials
To view supplementary material for this article, please visit http://dx.doi.org/10.1017/nie.2021.12.
Acknowledgements
Comments and suggestions from Leopoldo Catania, Jagjit Chadha, Radu Cristea, Daniela de Angelis, Michael Höhle, Jonas Knecht, Rutger-Jan Lange, Franco Peracchi, Jerome Simons and a referee are gratefully acknowledged; of course, they bear no responsibility for opinions expressed or mistakes made. Some of the ideas were presented at the NIESR conference in November 2020 and at the University of Cambridge BSU seminar in January 2021. AH is grateful to the University of Cambridge Keynes Fund for support on the project Persistence and Forecasting in Climate and Environmental Econometrics.
Appendix A. Data sources
The data for the UK were obtained from Public Health England’s (PHE) Coronavirus toolkit (https://coronavirus.data.gov.uk/developers-guide). Archived, or, real-time data are currently not available in the first release, ‘v1’, of their application programming interface (API). Discussion of access to archived data is summarised in this GitHub ticket: https://github.com/publichealthengland/coronavirus-dashboard/issues/241. Towards the latter part of 2020 PHE released an experimental version, ‘v2’, of their API which has archived data from 12 August 2020 onwards. All archived data are taken from this endpoint: https://api.coronavirus.data.gov.uk/v2. It is worth restating their disclaimer that this is an experimental endpoint and ‘subject to active development and may become unstable or unresponsive without prior notice’.
Appendix B. Estimation for bivariate model for publication and specimen data series
The prediction error variances for specimen and published were 0.0134 and 0.0172, respectively, with a correlation of 0.077. The slope variances were constrained to be the same, and
 $ q $
was set at 0.015 for the specimen series. The estimated AR coefficient in the published series was 0.672, and its variance was 0.0056. The irregular variances for specimen and published were 0.0082 and 0.0091, respectively, with a correlation of −0.190.
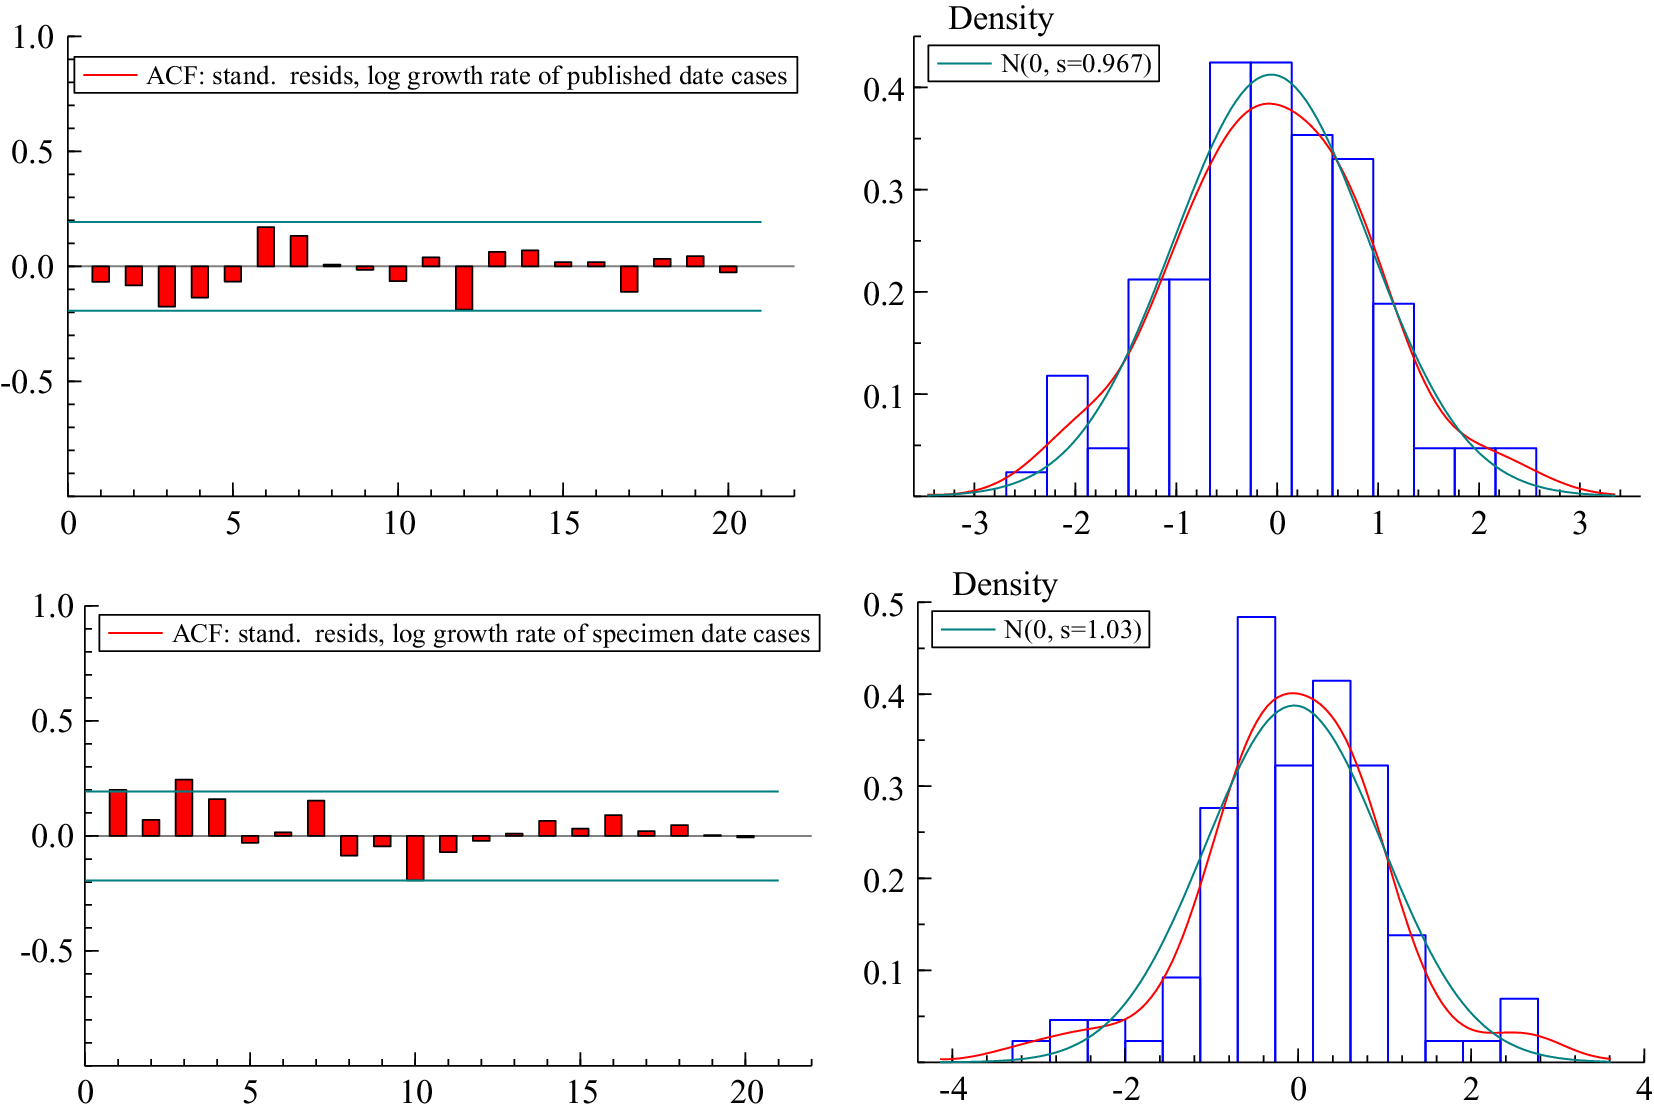
Figure 8 shows the residual autocorrelation functions (ACFs) and histograms. The diagnostic statistics wereFootnote
5 as follows for specimen:
 $ r(1)=0.20, $
 $ Q(18)=25.41, $
 $ BS=9.87 $
and
 $ H=3.95 $
, and for published:
 $ r(1)=-0.07, $
 $ Q(18)=20.21, $
 $ BS=0.38 $
and
 $ H=0.90 $
. There is some remaining serial correlation, but not a great deal. Fitting an AR(1) to the specimen series as well as to the published series may reduce
 $ r(1). $
The greater stability in the published series is reflected in the smaller BS normality test statistic.
(Colour online) Residuals from bivariate model fitted to data up to 19 January 2021

The output for the state vector shows that the slopes on 18th January are almost identical for the two series; for specimen data, it is
 $ -0.0506 $
 $ (0.0260) $
, and for published, it is
 $ -0.0502 $
 $ (0.0261) $
. The difference arises because, although STAMP is able to constrain the variances of the slopes to be the same, it is currently unable to set the deterministic parts of the slope to be equal.