


Introduction
In Antarctica, anchor ice is a subaqueous ice deposit that forms in the shallow sublittoral zone of marine environments. The ice has a delicate crystalline form within well-defined clusters that are attached to the seabed. The term ‘anchor ice’ is used in a range of disciplines for any ice attached to the substrate and forming under water, whether in lakes, rivers or oceans. In the polar oceans most research on anchor ice has been done in the Arctic, where several processes may result in supercooling of sea water, and subsequent anchor ice formation (Reference Mager, Smith and KempemaMager and others, 2013). In the Arctic, anchor ice is primarily formed by surface cooling of the ocean associated with low atmospheric temperatures and high winds that induce turbulence in the mixed layer (e.g. Reference ReimnitzReimnitz and others, 1987). Frazil ice, which initiates anchor ice growth, forms at the interface of two water bodies that have different salinity and temperatures relative to each other, for instance at estuaries or river mouths where brackish and fresh waters mix with the ocean, or adjacent to large icebergs (Reference MartinMartin, 1981). Frazil crystals that accumulate on the seabed lead to anchor ice formation, and if anchor ice clusters continue to grow and coalesce they will eventually become buoyant and detach from the seabed, carrying benthic flora, fauna and sediment through the water column into the overlying ice (Reference DaytonDayton and others, 1969). It is this potential to move sediment and diatomaceous material from the seabed into overlying sea ice that has been used as a proxy indicator for sea-ice extent in the Arctic (e.g. Reference Darby, Myers, Jakobsson and RigorDarby and others, 2011), although contemporary studies are uncertain on how significant anchor ice is to the overall sediment flux of marine sedimentation reconstructions (Reference PolyakPolyak and others, 2010). In Antarctica, surface cooling of the open ocean (e.g. leads or polynyas) may contribute to localized supercooling of water, but the main process of supercooling Antarctic waters is associated with the advection of Ice Shelf Water (ISW) (Reference MahoneyMahoney and others, 2011; Reference Robinson and StevensRobinson and others, 2014), and this supercooled water production is likely the dominant process for anchor ice formation (Reference LittlepageLittlepage, 1965; Reference DaytonDayton and others, 1969; Reference DennyDenny and others, 2011).
Supercooled water emanating from ice shelves has been the focus of numerous studies (e.g. Leonard and others, 2006; Reference MahoneyMahoney and others, 2011; Reference Robinson and StevensRobinson and others, 2014). Frazil crystals have been observed in supercooled water through acoustic (Reference Leonard, Purdie, Langhorne and HaskellLeonard and others, 2006) and optical (Reference Gough, Mahoney and LanghorneGough and others, 2012) techniques, but the controls on frazil ice nucleation and formation remain poorly understood. However, once present, frazil is a key contributor to numerous types of ice accretions, including anchor ice (Reference MartinMartin, 1981; Reference DalyDaly, 1994), sub-ice platelet ice layers (Reference Gow and AckleyGow and others, 1998; Reference Dempsey, Langhorne and RobinsonDempsey and others, 2010), and marine ice (Reference SouchezSouchez and others, 1991; Reference OerterOerter and others 1992; Reference Tison and RonveauxTison and others, 1993). The production of supercooled water near ice shelves is commonly associated with an ice-pump mechanism (Reference Lewis and PerkinLewis and Perkin, 1986).
When sea ice seasonally forms at the interface between the ocean and atmosphere, salt is rejected into the ocean, where it works to renew the High Salinity Shelf Water (HSSW) by providing an injection of saltier, and hence denser, water at the ocean surface. This seasonally renewed surface layer is denser than the successively deeper levels within the HSSW, which drives overturning of the water column. The resulting vertical overturning generates horizontal flow along surfaces of constant density towards the shelf floor. If these surfaces intersect the bottom of an ice shelf, this salt-enriched water will melt the ice shelf because the water temperature will be greater than the in situ freezing point temperature of the local ocean/ice-shelf interface due to the pressure dependence on the freezing point temperature (i.e. higher pressures lead to lower freezing point temperatures). The resulting meltwater mixes to form ISW, which is at the local ocean/ice-shelf interface temperature, and is more buoyant than the surrounding water due to its relative freshness. Buoyancy forces propel the ISW plume towards the surface, where it hugs the basal slope of the ice shelf as it rises, and may mix further with ambient sea water along the way. As the plume ascends towards the ocean surface it can become potentially supercooled because its in situ freezing point temperature rises as the pressure is reduced (Reference Foldvik and KvingeFoldvik and Kvinge, 1974), but its potential temperature effectively does not change (assuming minimal entrainment of ambient sea water and no growth of ice crystals). If there are impurities in the water (e.g. frazil ice crystals), the impurities may trigger freezing of the surrounding water, which reduces or removes supercooling. However, if there are insufficient nuclei to completely quench the supercooling, then the water temperature can be depressed by several milli-kelvin below its in situ freezing point. In terms of anchor ice, this process is important as anchor ice likely forms where frazil-laden plumes intersect the sea floor.
It has been suggested that the advection of supercooled water plumes may extend 250 km in front of the ice shelf in McMurdo Sound, Antarctica (Reference Stevens and RobinsonStevens and others, 2009), signifying that they may be regionally extensive. When these supercooled plumes intersect either the overlying sea ice, the bottom of an ice shelf, or the seabed, the formation of platelet ice, marine ice and anchor ice, respectively, may result (Reference LanghorneLanghorne, 2008). The process of ice formation and growth within the supercooled plume has a negative feedback, i.e. it cannot continue unabated as eventually a sufficient amount of latent heat is released so that the plume is no longer supercooled. Although there has been considerable research into platelet ice formation in McMurdo Sound (e.g. Reference Smith, Langhorne and TrodahlSmith and others, 1999, Reference Smith, Langhorne, Haskell, Trodahl and Frew2001, Reference Smith, Langhorne, Frew and Vennell2012; Reference Dempsey, Langhorne and RobinsonDempsey and others 2010; Reference Gough, Mahoney and LanghorneGough and others, 2012), there has been relatively less work on the contribution of sub-ice-shelf supercooling and frazil to marine ice formation (e.g. Reference Nicholls and JenkinsNicholls and Jenkins, 1993; Reference Tison and RonveauxTison and others, 1993). To the authors’ knowledge there are no field-based studies to date that have investigated the role of supercooled water in generating anchor ice in Antarctica.
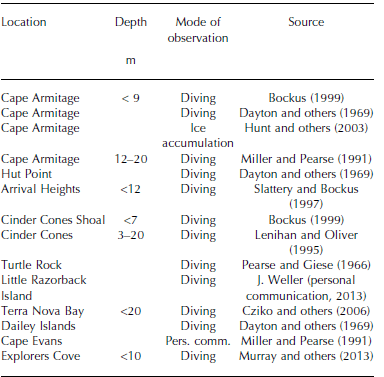
The challenges of observing anchor ice include its episodic nature, and the lack of a theoretical framework to ascertain areas of its formation. Most observations of anchor ice in Antarctica are contained in the biological literature where anchor ice is one of several ice disturbance mechanisms that affect sublittoral benthic habitats. These studies usually note the location and depth of anchor ice sightings, which are typically made during dives (Table 1; Fig. 1). Almost all observations of anchor ice have been in McMurdo Sound, apart from one study that reported anchor ice to 5 m depth near King George Island, West Antarctica (Barnes, 1999). Thus, McMurdo Sound appears to be the key area for anchor ice observations in Antarctica. In the context of the McMurdo Ice Shelf (MIS), anchor ice has also been invoked as a possible mechanism for entraining sediment and marine fossils observed on the ice-shelf surface (e.g. Reference SwithinbankSwithinbank, 1970; Reference Glasser, Goodsell, Copland and LawsonGlasser and others, 2006; Reference Fitzsimons, Mager, Frew, Clifford and WilsonFitzsimons and others, 2012), although its relative contribution compared to ice-shelf grounding is contested (e.g. Reference DebenhamDebenham, 1948, 1965; Reference KelloggKellogg and Kellogg, 1987; Reference Kellogg and StuiverKellogg and others, 1991a,Reference Kellogg and Stuiverb). The proposal that anchor ice mobilization is important for sediment transport into the MIS is based on fossil and sedimentary evidence, even though there are no direct observations of anchor ice beneath the cavity waters of the MIS. Thus, both the biological and glaciological disciplines lack a conceptual framework to assess the likely distribution of anchor ice in McMurdo Sound. The objective of this paper is to infer locations in McMurdo Sound where anchor ice may form by using gridded bathymetric data combined with output from an ISW plume model. GIS output is then used to estimate the areal extent of anchor ice in those locations in order to inform future field-based studies.
McMurdo Sound and places mentioned in text, and the International Bathymetric Chart of the Southern Ocean (IBCSO v.1) water depth for McMurdo Sound, Antarctica, and surrounding areas. The land mask was extracted from Bedmap2. Dashed box denotes the limits of the anchor ice study area. MIS: McMurdo Ice Shelf; SMIS: Southern McMurdo Ice Shelf.

Location of anchor ice observations in McMurdo Sound and, where specified, the water depth of those observations
Data and Methods
Geospatial parameters
McMurdo Sound is a significant outflow region for near-surface ISW (e.g. Reference Lewis and PerkinLewis and Perkin, 1985; Reference Holland and JenkinsHolland and others, 2003; Reference Robinson and StevensRobinson and others, 2014) because the basal slope of the MIS is conducive to maintaining a plume’s momentum so that it is likely to remain attached to the basal slope of the ice shelf until it reaches the ice-shelf front. MIS’s relative thinness (20-55 m according to Reference Rack and HaasRack and others, 2013) allows the plume to advect from the ice-shelf cavity at shallow depths. To further examine this process, Reference Hughes and LanghorneHughes and others (2014) extended an existing one-dimensional (1-D), steady-state ice-shelf plume model for application to the ocean underneath sea ice immediately in front of an ice shelf. One of the key additions to the model was the introduction of a ‘background circulation’ to account for all contributions to the plume’s net flow other than the plume’s own buoyancy, including tidal currents. Reference Hughes and LanghorneHughes and others (2014) applied the extended model to McMurdo Sound to validate model output against an observational record from the central Sound spanning several decades. In the validation run they prescribed an initial supercooled layer depth of 65 m (relative to the water surface) where the plume exited the ice-shelf cavity, and set the background circulation velocity to 0.03 m s–1 with a northerly bearing parallel to the Victoria Land coastline, based on both observations (Reference GilmourGilmour, 1975; Reference Lewis and PerkinLewis and Perkin, 1985) and modelled residual velocities (Reference Assmann, Hellmer and BeckmannAssmann and others, 2003; Reference DinnimanDinniman and others, 2007). The model predicted the supercooled layer thinned to a depth of 11 ± 5 m at a 50 km distance (in the flow direction of the plume) from the ice-shelf edge, and thinned further to a depth of 4 ± 3 m after 100 km. Predictions were found to be generally consistent with the observations (see Fig. 10 in Reference Hughes and LanghorneHughes and others, 2014), indicating that a steady-state 1-D model frazil plume model is capable of estimating supercooled layer thickness in the central Sound.
We use a combination of oceanographic observations (presented below) and Reference Hughes and LanghorneHughes and others (2014) model output to constrain depths of the supercooled layer in McMurdo Sound. Since we are only interested in identifying areas of the sea floor where supercooled water may intersect, and not the timing of when these events may occur, we generalize the Reference Hughes and LanghorneHughes and others (2014) results to the entire Sound. This approach is supported by observations in the eastern Sound (e.g. Reference Leonard, Purdie, Langhorne and HaskellLeonard and others, 2006; Reference MahoneyMahoney and others, 2011), which show that after the onset of winter the net near-surface transport switches to a northerly direction. This shift in current direction is attributed to the seasonal activation of an ISW plume in the eastern Sound (Reference Robinson and StevensRobinson and others, 2014). The assumption of net near-surface northerly currents in the western Sound is consistent with regional circulation patterns.
We set the depth of the supercooled layer within the ice-shelf cavity to be 75 m, and then use the Reference Hughes and LanghorneHughes and others (2014) model results to thin the supercooled layer as it is transported away from the front of the ice shelf. We did this by applying a piecewise-linear decay function in a manner similar to that of Reference Leonard, Mager and PaulingLeonard and others (2014), except that the initial depth of supercooling in their study was set at 65 m as in the Hughes and others model. In our study we set the maximum depth of supercooling at 75 m on the basis of conductivity-temperature-depth (CTD) data acquired in eastern McMurdo Sound by Reference Leonard, Purdie, Langhorne and HaskellLeonard and others (2006), who observed supercooling to 78 m depth, and Reference Robinson and StevensRobinson and others (2014) who observed supercooling to 70 m depth. Over an initial distance of 50 km the plume depth is reduced linearly from 75 m to 11 m. A second linear decay rate is applied between 50 and 162 km such that the depth is reduced to 4 m after 100 km, in line with the Reference Hughes and LanghorneHughes and others (2014) model results.
The distance decay function and Euclidean distance calculations were performed in ESRI ArcGIS 10.1 using a Python interface (Reference Leonard, Mager and PaulingLeonard and others, 2014). These data were gridded (500m x 500m cells) and compared with bathymetric data from the International Bathymetric Chart for the Southern Ocean (IBCSO v.1.0), a 500 m x 500 m gridded bathymetric product (Reference ArndtArndt and others, 2013), as well as comparison to a pre-release form of the McMurdo and Southern Ocean bathymetry developed by the New Zealand Crown Research Institute, GNS Science/Te Pū Ao (Reference Black, Woodward, Stagpoole, Henrys and DaveyBlack and others, 2011). The Antarctic coastline and ice-shelf locations were added from the Antarctic Digital Database (ADD) (version 6.0). Thus, our approach was to develop a framework that could evaluate areas where anchor ice might be expected to form, and then estimate the areal extent of anchor ice at those locations. The extent was estimated by identifying gridcells where the supercooling depth was determined to be equal to, or greater than, the grid’s sea-floor depth. Reference Leonard, Mager and PaulingLeonard and others (2014) showed there are large differences in water depths between Southern Ocean bathymetry products. Our study considers the impact that different supercooled water depths may have on the potential sites of anchor ice formation in McMurdo Sound, as well as the sensitivity of the projected anchor ice extent using two different bathymetric products, but is limited to conditions where the dominant oceanographic circulation is characterized by a north-northwesterly ISW flow from the MIS.
Depth of supercooling
Anchor ice has been observed to depths of 33 m in McMurdo Sound, although most observations are at depths less than 20 m. Reference DaytonDayton and others (1969) suggested that 33 m is the likely depth limit of anchor ice formation in McMurdo Sound. They argued that ice did not form at greater depths due to the dependence of the freezing temperature on pressure in the ocean, and the sudden onset and termination of ice formation, which they suggested was likely the result of ocean currents. Subsequent investigation of the role of anchor ice in disturbing benthic habitats has maintained the assertion that anchor ice does not form to depths greater than 33 m (e.g. Reference ThrushThrush and others, 2006; Reference DennyDenny and others, 2011), with the greatest concentration of anchor ice observed at depths between 5 and 20 m. However, frazil ice entrained within plumes of supercooled water that drive platelet ice formation occurs at much greater depths than 30 m in Antarctic waters, suggesting that anchor ice may form at greater depths. Rather than simply assume a limit of 33 m for anchor ice, we used measurements of supercooling from a series of CTD casts in eastern McMurdo Sound to characterize the likely depths for supercooling using data collected by Reference Leonard, Purdie, Langhorne and HaskellLeonard and others (2006) at 77°48'41.5"S, 166°26'1.8"E (‘Tanker Site’) between April and October 2003, and by Reference MahoneyMahoney and others (2011) at 77°5302.200 S, 166°47026.200 E (‘Cape Armitage’) between April and June 2009, and at 77°46056.200 S, 166°19014.200 E (‘Erebus Bay’) between June and October 2009. The CTD data were collected from 2003 to a depth of 275 m (see Reference LeonardLeonard and others, 2011, for instrumentation details) and to a depth of >500m for the 2009 data (Reference MahoneyMahoney and others, 2011). The CTD data were provided at a resolution of 2dbar (1 dbar f 1 m). These measurements provide a rare dataset of supercooling through the austral winter in McMurdo Sound, which we use to characterize the timing and depth of in situ supercooled water advected into the Sound from beneath the MIS.
In the original studies, freezing point temperatures were determined from the CTD data using the equations from UNESCO (Reference MilleroMillero, 1978) and the International Equation of State of Seawater 1980 (EOS-80) (see UNESCO, 1981; Reference FofonoffFofonoff and Millard, 1983). In our study the freezing point temperatures have been reanalysed using the TEOS-10 formulation, which is the most recent version of the method for calculating the thermodynamic properties of sea water (Reference McDougall and BarkerMcDougall and Barker, 2011). TEOS-10 is based on a Gibbs function formulation, where the thermodynamic properties of sea water are derived in a thermodynamically consistent manner (Reference McDougall and BarkerMcDougall and Barker, 2011). The major difference from EOS-80 is the introduction of Absolute Salinity to describe the salt content of sea water as opposed to Practical Salinity. Absolute Salinity replaces conductivity as the variable used in calculating properties of sea water (e.g. density and enthalpy). Measurements of supercooling in polar oceans have typically been on the order of milli-kelvin (Reference Lewis and PerkinLewis and Perkin, 1985; Reference Smith, Langhorne, Haskell, Trodahl and FrewSmith and others, 2001; Reference LeonardLeonard and others, 2011) so it is important that the uncertainty is not increased by this new method.
Results
Depth of the supercooled water layer
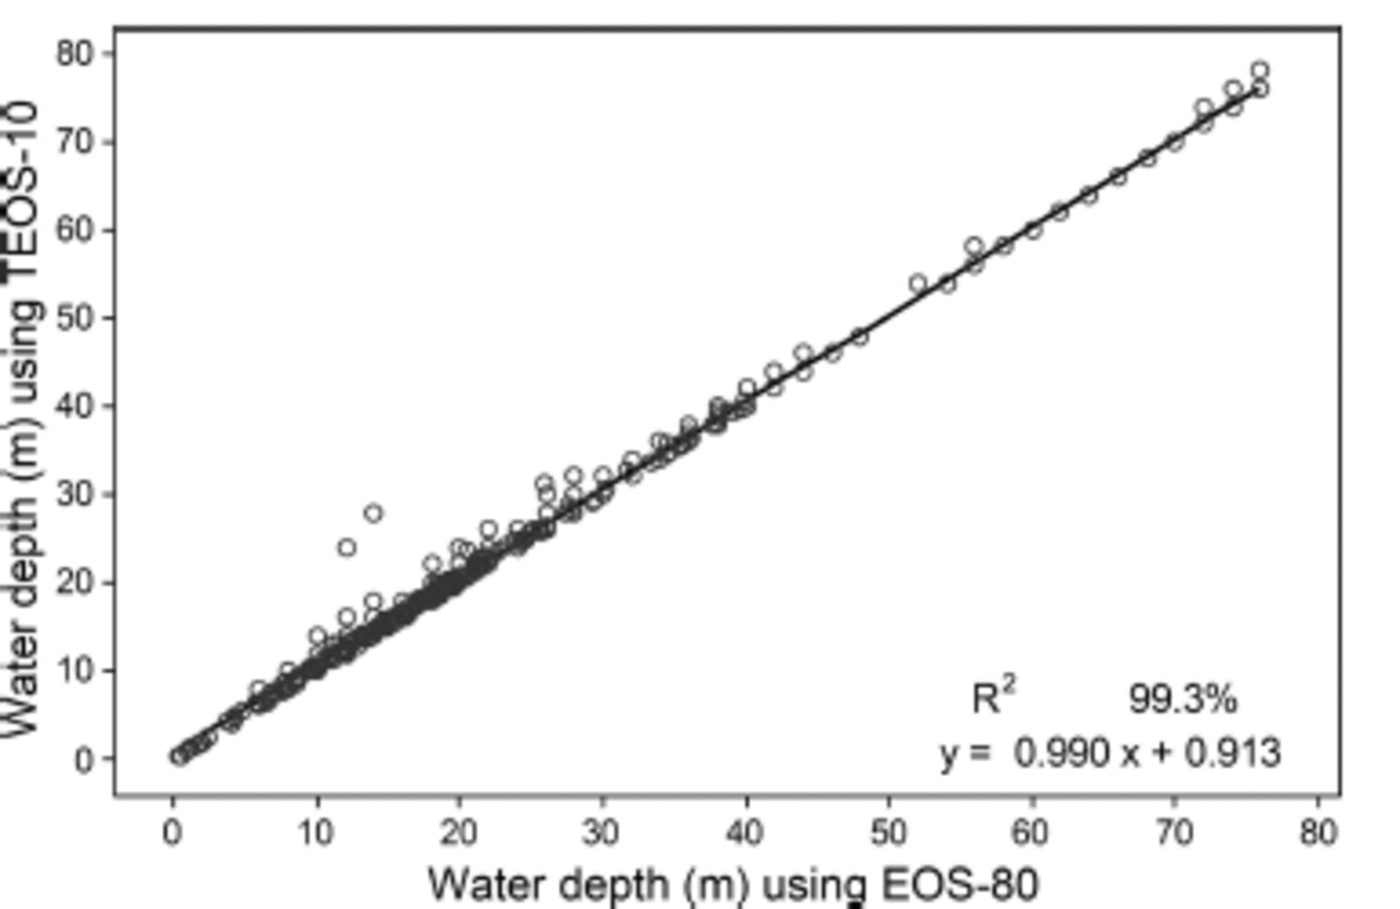
The maximum supercooled depths determined by the EOS-80 and TEOS-10 formulations for the combined 2003 and 2009 data (Fig. 2) were compared with each other. Regression analysis suggests that TEOS-10 is related to EOS-80 by TEOS-10=0.990 EOS-80+0.913, with an r 2 of 0.99, illustrating that there is a small difference in the maximum depth of supercooling determined by the two formulations. The TEOS-10 recalculation identifies four additional times when supercooling was measured (equivalent to 0.7% of all supercooled observations), which is attributed to the reduced uncertainty in determining supercooling. TEOS-10 also indicates supercooling at greater depths for some measurements.
The relationship between supercooled water depths (m) calculated using the EOS-80 and TEOS-10 formulations, with linear function fit equation.
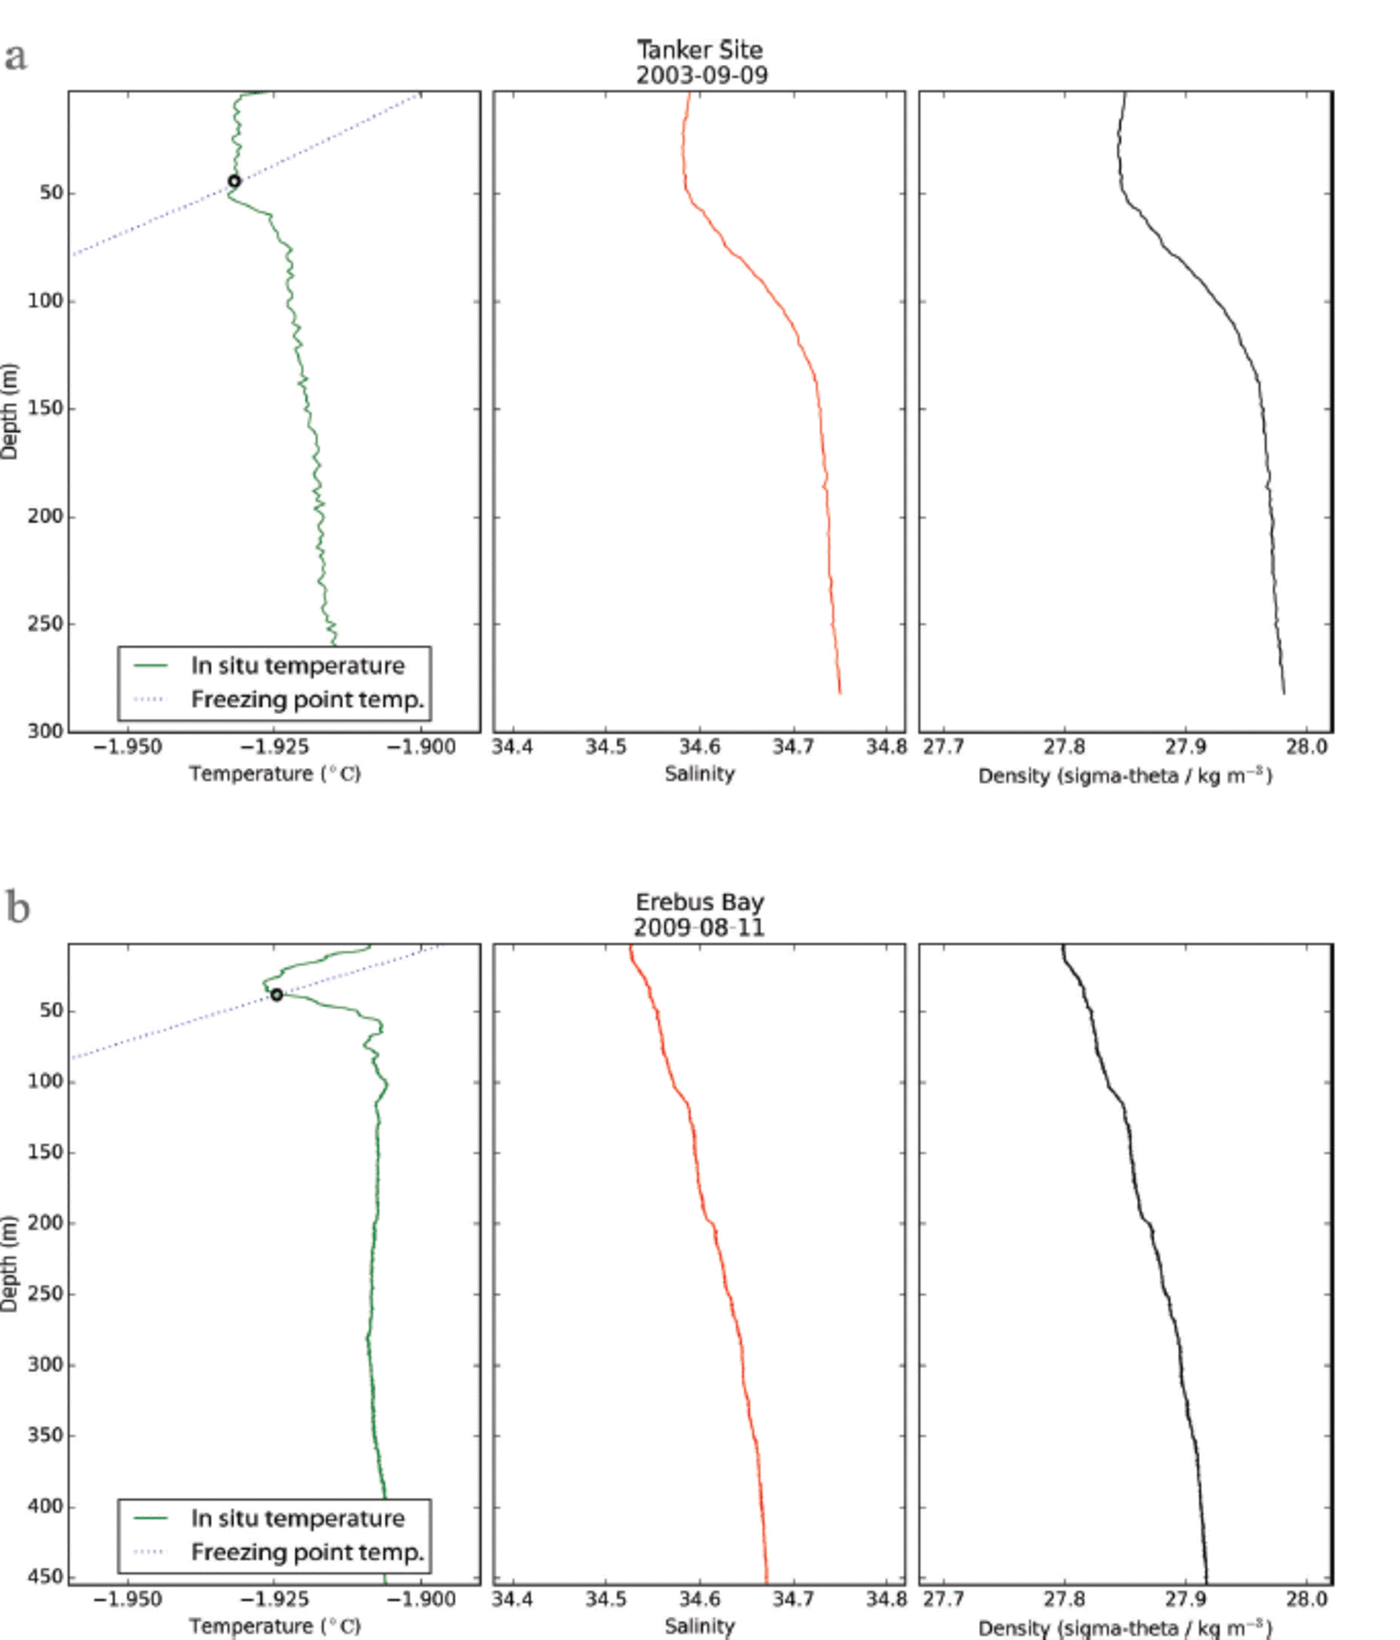
The results of analysis of the maximum depth of supercooling (henceforth ‘supercooling depth’) from CTD data using the TEOS-10 reformulation are summarized in Table 2. In 2003, supercooling was first detected in mid-April, with the maximum depth averaging 23m. This onset of supercooling was earlier than that observed in 2009 by Reference MahoneyMahoney and others (2011), where onset to average depths of 18 m occurred in late May 2009. A comparison of two CTD profiles from winter 2003 and 2009 (Fig. 3) illustrates the water column properties during periods of supercooling as well as the maximum persistent depth of supercooling, as indicated by the intersection of the in situ freezing point with the in situ temperature profile. The profiles show that the depth of the surface mixed layer ranged from around 50 m (2003) to 10 m (2009). The differences in potential temperature between the two casts show the greatest variability in the near-surface layers, and that in 2009 the water column was generally fresher and warmer than in 2003. In terms of supercooled water depths, the CTD data illustrate considerable variability in the depth of the mixed layer between the two study periods and the depth of potentially supercooled water. The difference in the timing of the onset of supercooling between the two studies reflects temporal (and possibly also spatial) variations in supercooled plume production within the region, which may be attributed to the influence of a large iceberg in McMurdo Sound (B-15A) during 2003 (Reference RobinsonRobinson and Williams, 2012). Average and maximum supercooling depths were greatest in 2003, occurring respectively in September (38 m) and May (78 m; Table 2). By comparison the maximum depth of 41 m was observed during August 2009. There is considerable variability in the depth of supercooling, both in terms of the time of year, but also between years; this likely reflects variability in oceanographic conditions at the cast sites (Fig. 3 and 4).
In situ temperature and in situ freezing point temperature (left), salinity (centre) and potential density (right) profiles for cast data from (a) 9 September 2003 at Tanker Site and (b) 11 August 2009 from Erebus Bay. The maximum depth of supercooling is denoted with an ‘o’ on the in situ temperature plots.
Probability density functions for depth of supercooled water (m) for CTD data collected in eastern McMurdo Sound in 2003 (Reference Leonard, Purdie, Langhorne and HaskellLeonard and others, 2006) and 2009 (Reference MahoneyMahoney and others, 2011). The distribution of the 2003 data is polymodal and negatively skewed, with notable outliers observed at depths between 50 and 78 m. The dashed line is a fitted normal distribution to each dataset and illustrates stronger central tendency in 2009. Note that the number of observations of supercooling was greater in 2003, with 559 observations of supercooling compared to 230 in 2009.
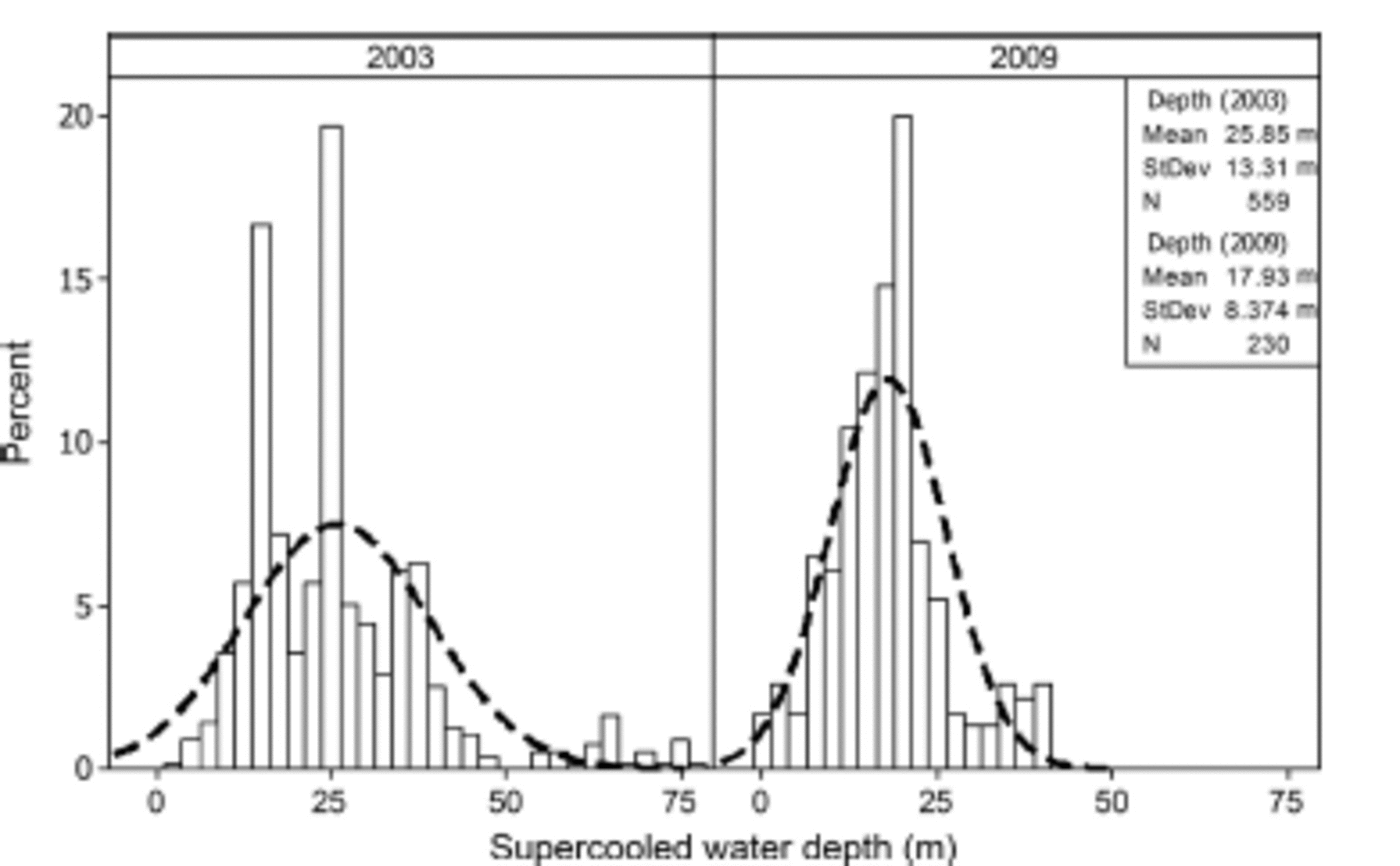
Water depth where supercooling was calculated using the TEOS-10 formulation for the freezing point of sea water from CTD data collected during the austral winters of 2003 (Reference Leonard, Purdie, Langhorne and HaskellLeonard and others, 2006) and 2009 (Reference MahoneyMahoney and others, 2011). Note that the mean is calculated for the maximum and minimum values using a daily time step (i.e. the averaged maximum depth of all days reporting supercooling)
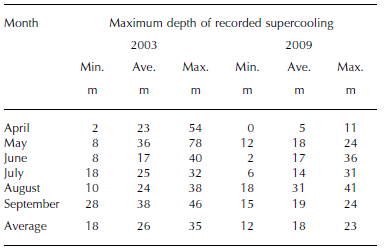
The mean supercooling depth for 2003 was 25.9 ± 1.1 m, and the median was 24.0 ± 0.0 m (Fig. 4). By comparison, in 2009 the mean supercooling depth was 17.9 ± 1 . 1 m, and the median was 18.0 ± 0.8 m. Thus, on the basis of observed supercooling median depths in the eastern Sound, supercooling typically occurs to depths between 18 and 26m. From the CTD data we identified a series of thresholds to assess the sensitivity of anchor ice extent to supercooled water depth. The thresholds were determined on the basis of statistical analysis of the supercooled data as: median supercooling depth in 2009 (18 m); median supercooling depth in 2003 (24 m); average daily maximum supercooling depth (35 m; approximating the upper limit for anchor ice proposed by Reference DaytonDayton and others, 1969); the 95th percentile for the combined 2003 and 2009 data (50 m); and the maximum supercooling depth (∼75 m in 2003).
Potential extent of anchor ice in McMurdo Sound
Intersecting the estimated depth of supercooling with the IBCSO bathymetry suggests that anchor ice may occur under the MIS and along the landward margin of the southern McMurdo Ice Shelf (SMIS) at Minna Bluff. A wedge of anchor ice may form between Victoria Land and the Dailey Islands; around Explorers Cove, and in the embayment east of Cape Bird to Lewis Bay on the northerly shore of Ross Island (Fig. 5). The western flank of McMurdo Sound including the coastal margin around the Strand Moraines, the Bay of Sails and Granite Harbour has shallow pockets that may experience anchor ice formation. The bathymetry drops off steeply northwards of Brown Peninsula into McMurdo Sound (Fig. 5), so that east of the Dailey Islands the basin is beyond the lower threshold limit of 75 m water depth for anchor ice formation as constrained by supercooled depths reported in Table 2. The results reported here are consistent with those of Reference Leonard, Mager and PaulingLeonard and others (2014) in their preliminary study of anchor ice extent; however, our study has been refined to consider the impact of different supercooled water depths on potential sites of anchor ice formation.
Estimated extent of anchor ice in McMurdo Sound and beneath the McMurdo Ice Shelf for different depths of a supercooled water plume intersecting the underlying IBCSO (Reference ArndtArndt and others, 2013) bathymetry. Pixel resolution 500 m x 500 m.

The IBCSO bathymetry shows the geospatial projection of anchor ice covers an area of 3456 km2 throughout McMurdo Sound, if the supercooled layer reaches a depth of 75 m, or 1500 km2 if it reaches a depth of 18 m (Table 3). If the depth is 35 m, as suggested by observations of Reference DaytonDayton and others (1969), then the total area of potential anchor ice is 2302 km2but only 426 km2 of this exists outside of the MIS cavity. Most of the area where anchor ice may form is within MIS cavity, accounting for 75% of the total areal extent of anchor ice for depths up to 25 m; the remaining 25% is distributed along the coastal margins of Victoria Land and Ross Island (Table 3).
Projected extent of anchor ice in McMurdo Sound. Areas were calculated using IBCSO bathymetry and Reference Black, Woodward, Stagpoole, Henrys and DaveyBlack and others (2011) with a 500 m x 500 m pixel resolution and supercooled depth to a maximum of 75 m. The sub-ice-shelf area includes areas of supercooling likely to occur beneath the McMurdo Ice Shelf and Koettlitz Glacier Tongue
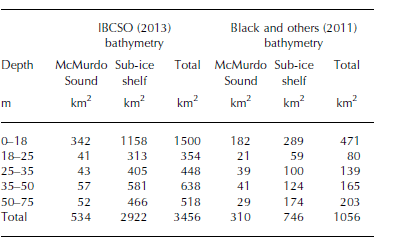
The IBCSO bathymetry has interpolated the sub-ice bathymetry, where observations of water depth are scant and are inferred from the SCAR Antarctic Digital Database (ADD) (version 6.0), and pseudo-observations were added to create smooth transitions from the continental data to the bathymetric observations (Reference ArndtArndt and others, 2013). However, the sub-ice bathymetry generated from this interpolation shows shallower water drafts than reported from spot depths from the region. A bathymetry database for McMurdo Sound and the Southern Ocean is being developed by GNS Science using satellite altimetry and shipborne bathymetry (Reference Black, Woodward, Stagpoole, Henrys and DaveyBlack and others, 2011), and a version of this database was obtained to determine the sensitivity of our geospatial estimation of the potential anchor ice extent in McMurdo Sound. A comparison of the water depth (m) between the Reference Black, Woodward, Stagpoole, Henrys and DaveyBlack and others (2011) bathymetry and the IBCSO bathymetry shows considerable differences in water depth (Fig. 6). In particular, the Reference Black, Woodward, Stagpoole, Henrys and DaveyBlack and others (2011) bathymetry shows much greater water depths beneath the MIS and SMIS. The revised anchor ice extent (Fig. 7) shows anchor ice limited to the coastal margins around Ross Island, particularly along the western flank of Hut Point Peninsula to Cape Evans, Lewis Bay and the southeastern coastline by Cape Crozier. Other likely anchor ice formation sites extend along the western flank of Victoria Land up to the Bay of Sails, but most sites are located between New Harbour and Cape Chocolate. Most sub-ice sites are situated beneath Koettlitz Glacier and the MIS, specifically around Brown Peninsula, Dailey, White and Black islands (Fig. 7). Using the revised bathymetry of Reference Black, Woodward, Stagpoole, Henrys and DaveyBlack and others (2011) reduces the potential anchor ice area to 1056 km2 for supercooled layer depths to 75 m, and 471 km2 for depths less than 18m (Table 3).
Differences in the reported water depth (m) from Reference Black, Woodward, Stagpoole, Henrys and DaveyBlack and others (2011) and IBCSO (Reference ArndtArndt and others, 2013), where positive differences indicate shallower water reported by Reference Black, Woodward, Stagpoole, Henrys and DaveyBlack and others (2011) and negative differences indicate deeper water reported by Reference Black, Woodward, Stagpoole, Henrys and DaveyBlack and others (2011) relative to IBCSO. The major difference is a substantial deepening of water beneath the McMurdo Ice Shelf.

Estimated extent of anchor ice in McMurdo Sound and beneath the McMurdo Ice Shelf for different depths of a supercooled water plume intersecting the underlying Reference Black, Woodward, Stagpoole, Henrys and DaveyBlack and others (2011) bathymetry. Pixel resolution 500 m x 500 m. Circles denote the locations of anchor ice observations described in Table 1.

Discussion
Determining the extent of anchor ice
The estimated area of anchor ice is highly sensitive to the bathymetric data, with the difference between the IBCSO and Reference Black, Woodward, Stagpoole, Henrys and DaveyBlack and others (2011) datasets reducing the likely anchor ice areas by 70%. There are large differences in bathymetry between the IBCSO and the Reference Black, Woodward, Stagpoole, Henrys and DaveyBlack and others (2011) products, particularly in the water depths beneath the MIS. In light of this, we limit our discussion to the area of anchor ice estimated from the data provided by Reference Black, Woodward, Stagpoole, Henrys and DaveyBlack and others (2011) because it better resolves the bathymetry beneath the MIS, shows greater depths under the ice shelf and allows a more conservative estimate of anchor ice formation sites.
Potential anchor ice extent identified in our study aligns well with the scant reports of anchor ice observations from previous studies (Fig. 7). Beyond the MIS cavity, the areas around Ross Island, particularly Cape Evans to the north, Hut Point Peninsula to the east and Erebus Glacier Tongue to the south (Fig. 7), are potential sites for anchor ice; however, in these areas ocean circulation may be deflected by the local bathymetry and Erebus Glacier Tongue (Reference Stevens, Stewart and RobinsonStevens and others, 2011), and be subject to seasonal variations in ocean circulation (Reference Robinson and StevensRobinson and others, 2014). There are observations of anchor ice in this region, particularly on the sublittoral margins of the offshore islands (e.g. Little Razorback), so supercooled water must at times be present in this region. One possibility is that Erebus Glacier Tongue is a local source of supercooled water (e.g. Reference DebenhamDebenham, 1965; Reference Stevens, Stewart and RobinsonStevens and others, 2011), which may produce anchor ice if sufficient nucleation centres are available to initiate ice crystallization. One limitation of our approach is that the bathymetric resolution does not sufficiently represent small-scale features on the ocean floor (e.g. till deposits, fluting or other submerged glacial landforms), nor does it consider the effect of smaller-scale features (e.g. shoals) which may deflect or mix ocean currents. Our analysis suggests anchor ice formation occurs within an embayment where Koettlitz Glacier terminates into McMurdo Sound (Fig. 7). Koettlitz Glacier is the only glacier that flows directly into the MIS, and its lower portion is floating (Reference Gow and EpsteinGow and Epstein, 1972). Ice cores analysed by Gow and Epstein (1972) revealed that sea ice accretes to the bottom of the floating ice tongue, an ice type now widely known as marine ice. The presence of marine ice within Koettlitz Glacier Tongue is likely related to frazil ice production beneath the MIS and may indicate the potential for anchor ice formation. Our dataset does not constrain the depth of the floating ice tongue, and this highlights one of the challenges of using the bathymetry data where there is a poor representation of the boundaries between terrestrial and marine ice.
The majority of anchor ice observations are on the eastern side of McMurdo Sound, making it difficult to determine whether the Victoria Land coastline is an area of potential anchor ice growth. Diving observations in Explorers Cove noted that anchor ice formed on a steep delta, and scallops were observed suspended within it (Reference MurrayMurray and others, 2013). However, along the Victoria Land coastline there is the potential for freshwater input to the nearshore zone from glacial melt from the McMurdo Dry Valleys and from coastal piedmont glaciers. Where fresh water enters the sea, differences in temperature and salinity between the two water layers may result in localized supercooling (Reference MartinMartin, 1981), which may account for anchor ice growth along shallow sublittoral coastlines and deltas. Thus, the observation of anchor ice at Explorers Cove is equivocal evidence of supercooled plumes contributing to anchor ice formation along the western side of McMurdo Sound, and further research is required to estimate the extent of anchor ice in this region. It should be noted, however, that there are major differences in the structure of benthic communities between the east and west sides of McMurdo Sound (Reference ThrushThrush and others, 2006), and that changes in diversity along its western margin have been attributed to ecological disturbance by anchor ice (Reference ThrushThrush and others, 2006; Reference DennyDenny and others, 2011).
The other factor affecting the likely extent of anchor ice is sensitivity to depth of supercooling. The CTD data collected in different winters and locations across McMurdo Sound illustrate that not only does the onset of supercooling vary between years, but so too does the depth of the supercooled plume. The oceanographic conditions observed in 2009 revealed a shallower depth of supercooling than in 2003, both in terms of the average and the maximum. The maximum supercooled depth observed in 2003 was 78 m, which is consistent with the value of 70 m from the 2007 observations made by Reference Robinson and StevensRobinson and others (2014). Reference MahoneyMahoney and others (2011), however, observed a maximum depth of 41 m in 2009 (Table 2). The projected areas of anchor ice extent are highly sensitive to these variations as illustrated in Table 3: the difference in area extent of anchor ice between the average supercooled depth from 2009 of 18m (471 km2) and the average depth from 2003 of 26m (551 km2) equates to 80 km2a difference of 14.5% in area extent. When extrapolated to the area difference between the maximum depths of supercooling, this equates to a difference of 19.2% (as the difference in area projected between 0 and 50 m, compared to 0–75m) (Table 3). Thus, the location, extent and timing of anchor ice in McMurdo Sound are variable, and subject to significant temporal fluctuations in regional oceanic circulation patterns.
Effect of ocean currents on the extent of anchor ice
The potential extent of anchor ice presented here reflects assumptions about the thickness of the supercooled layer, and the circulation of ISW in the Sound. Supercooling depths were selected by analysing winter ocean profiles from three locations in eastern McMurdo Sound. These data were used to characterize probable maximum supercooling depths, but the seasonal and spatial variability of supercooling in the Sound is a source of uncertainty, and further field-based observations and modelling are needed to constrain the nature of supercooled plumes in the region. In terms of the likely anchor ice extent developed in our study, our results suggest that the western Sound has significant potential for anchor ice formation due to the northerly flow of ISW (Reference Robinson and StevensRobinson and others, 2014), although there are few observations to support this. In contrast, there is greater uncertainty in identifying formation sites in the central and eastern Sound due to the seasonality of the appearance of ISW (Reference Leonard, Purdie, Langhorne and HaskellLeonard and others, 2006; Reference MahoneyMahoney and others, 2011). Yet the areas around the eastern margin of McMurdo Sound represent locations of the most reported observations of anchor ice, although this is likely an artefact resulting from greater accessibility to the eastern Sound. Regional ocean modelling of the MIS by Stern and others (2013) identified a summer southward current driven by the melting of sea ice in the west of the Ross Sea Polynya that moved water around the north of Ross Island, wrapping around Hut Point Peninsula and subducting under the ice-shelf cavity. The relatively warm water current strengthened over summer and appeared to be a regular feature of the water currents around Cape Armitage. Stern and others (2013) suggest that this current provides shallow, warmer water that may significantly contribute to ice-shelf melting near the terminus. Furthermore, the presence of a shallow, warm ocean current along the western margin of Ross Island likely precludes the formation of anchor ice, except when winter oceanographic conditions allow for the northward-flowing ISW water to spread east across the Sound.
Transect observations of the depth of supercooling decrease towards the east of McMurdo Sound (Reference Hughes and LanghorneHughes and others, 2014; Reference Robinson and StevensRobinson and others, 2014). Analysis of the CTD data from 2003 and 2009 suggests that the likely maximum persistent depths of supercooling in McMurdo Sound are ∼50 m (Fig. 3; Table 2), and observations of supercooling to greater depths are scant. Given that the water depths in the central to eastern McMurdo Sound exceed 100 m (Fig. 1 and 6), this falls outside the zone of potential anchor ice identified by our results, with the exception of the shallow nearshore zone adjacent to Hut Point Peninsula. Additionally, we are not able to determine when anchor ice may form in any given winter, nor how long it may persist, but rather our framework considers what areas have suitable conditions (e.g. water depth and proximity to an ISW plume) for anchor ice formation under specific oceanographic conditions.
The onset of anchor ice has been noted in April (Reference Pearse and GiesePearse and Giese, 1966), supporting observations that supercooling can appear as early as April-May (e.g. Reference LeonardLeonard and others, 2011) and is principally a winter phenomenon (Barnes, 1999). A southward circulation has been observed along the eastern Sound (e.g. Reference BarryBarry and Dayton, 1988; Reference Stern, Dinniman and ZagorodnovStern and others, 2013) flowing beneath the MIS cavity (e.g. Reference Assmann, Hellmer and BeckmannAssmann and others, 2003), before switching northwards out of the cavity during March-April (Reference Leonard, Purdie, Langhorne and HaskellLeonard and others, 2006; Reference MahoneyMahoney and others, 2011). Thus, temporal variations in the occurrence of supercooled water (e.g. Reference BarryBarry, 1988) and anchor ice (e.g. Reference DaytonDayton and others, 1969) are likely connected to broader oceanographic shifts (Reference DaytonDayton, 1989; Reference DennyDenny and others, 2011). Therefore, the potential areas of anchor ice are likely only applicable for those times of year when a northerly flow of ISW occurs. We projected supercooled water as being principally advected from beneath the MIS on the basis of the modelling work by Reference Hughes and LanghorneHughes and others (2014) and the observations of Robinson and others (2014); however, floating ice tongues or other smaller ice shelves may also provide localized sources of supercooling that may produce frazil ice in areas not described by our framework. For example, anchor ice has been observed at Terra Nova Bay (Reference ThrushThrush and others, 2006), which may be beyond the likely reach (up to 250 km according to Reference Stevens and RobinsonStevens and others, 2009) of a supercooled plume from the MIS, and is beyond our maximum plume extent of 162 km. Thus, the presence of frazil ice in Terra Nova Bay is likely associated with episodic supercooling associated with nearby floating ice tongues (e.g. Drygalski and Campbell) or ice shelves (e.g. Hells Gate as described by Reference Tison and RonveauxTison and others, 1993), or with surface cooling and heat advection from the adjacent polynya.
Anchor ice as an agent for sediment entrainment
The presence of anchor ice in McMurdo Sound, and the potential areas where it may form also contributes to broader debates about its significance as an agent of sediment mobilization, in terms of entraining diatomaceous material into overlying ice. The largest likely area of anchor ice formation is under the MIS cavity (Table 3), bound to the south by the Brown Peninsula, Black Island and White Island. The MIS has been the subject of numerous studies to determine the origin of extensive fossil and debris mantles on its surface (e.g. Reference DebenhamDebenham, 1948; Reference SwithinbankSwithinbank, 1970; Reference Stuiver and DentonStuiver and others, 1981; Reference KelloggKellogg and Kellogg, 1987; Reference Kellogg and StuiverKellogg and others, 1991a,Reference Kellogg and Stuiverb; Reference Glasser, Goodsell, Copland and LawsonGlasser and others, 2006; Reference Fitzsimons, Mager, Frew, Clifford and WilsonFitzsimons and others, 2012). Many of these studies have discussed the mechanism for entraining sediment, flora and fauna into the ice shelf, with both anchor ice and ice-shelf grounding being posited as possible agents of sediment entrainment. Reference SwithinbankSwithinbank (1970) favoured anchor ice as the dominant process for mobilizing sediment and fossils into the MIS, on the basis of water depth beneath the contemporary MIS, although he recognized that some regions may experience repeated grounding. Reference SwithinbankSwithinbank (1970) contended that benthic material lifted by anchor ice could be wafted by currents and emplaced at distance from its origin, so the presence of benthic fauna in one part of the ice shelf may not be evidence for anchor ice at that location. Reference Kellogg and StuiverKellogg and others (1991a,Reference Kellogg and Stuiverb), however, argued that the ice shelf grounded episodically, so anchor ice was relatively unimportant, an interpretation that appears supported by the likely anchor ice formation areas (Fig. 7).
The likely areas of potential anchor ice shown here preclude any significant formation beneath the MIS, apart from the shallow regions adjacent to land boundaries. Sedimentological and geophysical evidence of modern corals and sponges used by Reference Glasser, Goodsell, Copland and LawsonGlasser and others (2006) suggests that between Bratina Island and Brown Peninsula (in an area known as ‘the Swirls’) there is active entrainment of benthic fauna where anchor ice freezes to the bottom of the MIS. ‘The Swirls’ are principally deposits of debris on the ice-shelf surface including moraines, ice ridges and debris cones (Reference Glasser, Holt, Fleming and StevensonGlasser and others, 2014). The debris deposits are likely relicts from the last glacial maxima associated with a grounded ice tongue; however, there is a mix of both relict and contemporary deposits in this region (Reference Glasser, Goodsell, Copland and LawsonGlasser and others, 2006). The composition of ice-shelf moraines in the SMIS along Minna Bluff was similarly interpreted as evidence of ice-shelf grounding and anchor ice (Fitzsimons and others, 2012). Many of these debates on the relative significance of entrainment processes are centred on disentangling contemporary and ancient processes in the sedimentary record in a complex environment subject to advection, compression and thrusting against the landward margins of the ice shelf. The ice ridges and cones on the MIS, together with crevasse-fills, dykes, brine inclusions and supraglacial melt ponds, make for a depositional environment that is overprinted with numerous syn- and post-depositional features (Reference Glasser, Goodsell, Copland and LawsonGlasser and others, 2006, Reference Glasser, Holt, Fleming and Stevenson2014).
The margins of the MIS, particularly at the sublittoral margins adjacent to peninsulas and islands, are areas of relatively shallow bathymetry (Fig. 6) that under favourable past conditions could have grounded and accreted benthic material. The presence of supercooled water in this embayment, via advection of an ISW plume, may also contribute to the sub-ice-shelf accretion of marine ice, and where the mixing depth intersects the seabed may lead to anchor ice formation. The confluence of these elements, combined with the relative thinness of the MIS, results in a physical setting conducive to both ice-shelf grounding and potential formation of marine and/or anchor ice in shallow regions. Our analysis does not provide information on the relative significance of each process for entraining material into the MIS, but it does highlight the potential for anchor ice to form in selected parts of the MIS and SMIS embayments and potentially contribute to the mobilization of sediment into the overlying ice shelf. Given that there are no direct observations of anchor ice in the sub-ice cavity, and that evidence for anchor ice is inferred from surface deposits, further work is needed, either by developing a geochemical signature for anchor ice from field studies, or through direct observation of the sub-ice-shelf cavity.
Conclusions
We have provided a framework for identifying potential anchor ice formation sites in McMurdo Sound under the specific oceanographic conditions of a northwards discharge of ISW from beneath the MIS. The occurrence of anchor ice in McMurdo Sound is likely associated with ISW, with its extent controlled by the depth of supercooled water and an attendant load of frazil crystals. Drawing on the output from a simple 1-D ISW plume model for McMurdo Sound developed by Reference Hughes and LanghorneHughes and others (2014), we estimated that up to 310 km2 of anchor ice may occur on the eastern coast of the Hut Point Peninsula and in pockets of the coast of southern Victoria Land, including Explorers Cove, and as far north as the Bay of Sails (Table 3). Additionally sub-ice-shelf areas of likely anchor ice formation were identified around Brown Peninsula, White Island, Black Island and the Dailey Islands, these covering an estimated area of 746 km2. Our posited areas of anchor ice are consistent with the few reported observations of anchor ice, as well as fossil deposits on the MIS that have been interpreted as resulting from anchor ice formation beneath the MIS. The limitations of our approach include the assumption of a persistent northwards flow of ISW throughout the entire Sound and uncertainty about the maximum depth of supercooled water plumes, which vary between observation years. Our approach is also limited by poorly constrained sub-ice-shelf bathymetry, particularly in areas where the terminus and grounding line of floating ice tongues are poorly defined in bathymetric products (e.g. Koettlitz Glacier, Erebus Glacier Tongue), or areas of rapid change in bathymetry (e.g. Hut Point Peninsula). Observations of the average and maximum depth of supercooled water in McMurdo Sound are temporally variable and primarily a winter phenomenon, and changes in the depth of supercooled water plumes may generate differences of up to 20% in areal coverage of anchor ice. Since the flow of ISW is known to be seasonally variable, particularly in the eastern part of McMurdo Sound, we suggest that the episodic observations of anchor ice and its cessation over summer are a function of regional circulation changes. Further work should be directed towards assessing the occurrence of anchor ice in the western portion of McMurdo Sound, and relating the presence of anchor ice in the eastern parts of the Sound to regional oceanographic patterns.
Acknowledgements
We thank the Polar Environments Research Theme at the University of Otago for providing seed funding to I.J.S. and S.M.M., as well as a bursary to A.G.P., to undertake some of the preliminary work. The CTD data used in this study were collected as part of projects funded by the Marsden Fund of New Zealand, the Foundation for Research Science and Technology, the University of Otago, and Industrial Research Ltd. We also thank Craig Purdie, Johno Leitch and the Scott Base 2003 winter-over crew for data collection, and Antarctica New Zealand and the US Antarctic Program for logistical assistance. We also thank the National Institute of Water and Atmospheric Research, New Zealand, for providing access to the 2009 CTD data, and GNS Science for providing access to a pre-release copy of its forthcoming Ross Sea bathymetry product. Finally, we thank Peter Holland, two anonymous reviewers, the chief editor and scientific editor for insightful comments and suggestions.



