

Introduction
The population aged 75 and older will increase dramatically in all Western countries between now and 2030. Even if the majority of older people are in good health, as they grow older the risk of physical and cognitive dependency increases, and daily care usually becomes essential. The strong future aging expected on both sides of the Atlantic heralds a substantial increase in dependent care needs. International comparisons are common in the literature on aging as countries try to garner insights from others on how to cope with their aging populations. Such comparisons are often historical in nature (e.g., using data from the Organisation for Economic Co-operation and Development (OECD) to examine trends in population health indicators) (Anderson & Hussey, Reference Anderson and Hussey2000; Jacobzone, Reference Jacobzone2000). For policy makers, though, population aging is a concern for the future. This article draws on two programs of research, one in Canada and one in France, to compare the future composition of family structure using dynamic projection modeling. By comparing Canada with France, we argue that current assumptions about family availability need to be reconsidered in future policy on the care needs of older people.
The type of care older people receive is closely linked to the type of household they live in and, more broadly, to their family composition. The spouse and children are the primary carers of dependent older people (Chappell, Reference Chappell1991; Walker, Alber, & Guillemard, Reference Walker, Alber and Guillemard1993). If that support is absent or deficient, the need for formal care increases. Dependent older people who live alone tend to utilize more formal care than those living with a spouse or with other people (Arber, Gilber, & Evandrou, Reference Arber, Gilber and Evandrou1988; Grundy, Reference Grundy2006; Pickard, Wittenberg, Comas-Herrera, Davies, & Darton, Reference Pickard, Wittenberg, Comas-Herrera, Davies and Darton2000). In France, two thirds of dependent people aged 65 and older who live alone receive formal care versus half of those living with a spouse and 40 per cent of those who share housing with other family members (Breuil-Genier, Reference Breuil-Genier1998). Meanwhile, in Quebec, more than 50 per cent of people (aged 65 and older) who have neither a spouse nor children receive formal support versus 30 per cent of those living with a spouse (Martel & Légaré, Reference Martel and Légaré2001). Changes in the family composition of older people can therefore have an impact on needs for formal care and strong implications for social policies.
The consequences for individual welfare are no less substantial. For example, for a dependent older person, daily care from a spouse can postpone or even avoid institutionalisation (Carrière & Pelletier, Reference Carrière and Pelletier1995; Freedman, Reference Freedman1996), generally considered a last resort (Oldman & Quilgars, Reference Oldman and Quilgars1999). Moreover, older people living with a spouse are in a better financial situation, are in better health (Glaser, Murphy, & Grundy, Reference Glaser, Murphy and Grundy1997), and are more socially integrated (De Jong Gierveld, Van Tilburg, & Lecchini, Reference De Jong Gierveld, Van Tilburg and Lecchini1997; Delbès & Gaymu, Reference Delbès and Gaymu2003a).
The determinants of older people’s living arrangements have been the subject of much research (Légaré & Martel, Reference Légaré and Martel2003; Palloni, Reference Palloni2001; Pampel, Reference Pampel and Rogers1992; Tomassini, Glaser, Wolf, Broese van Groenou, & Grundy, Reference Tomassini, Glaser, Wolf, Broese van Groenou and Grundy2004; United Nations [UN], 2005; Wolf, Reference Wolf1995). Studies show that marital status has a major influence on the household structure of older people. Almost all older people who are married live with their spouses, whereas the majority of widowed and divorced people, whose living arrangements are similar to each other, live alone. Moreover, it is chiefly because more women are widowed that they are consigned to residential isolation, whereas most men grow old with a spouse (Delbès & Gaymu, Reference Delbès and Gaymu2006; UN, 2005). Unmarried people are distinctive in that they have a stronger tendency to opt for institutionalisation (Dolinsky & Rosenwaike, Reference Dolinsky and Rosenwaike1988; Grundy & Glaser, Reference Grundy and Glaser1997; Ricci, Reference Ricci1991). The fact that typically they are childless is a significant contributing factor because being childless reduces the availability of support to maintain residential independence and fosters institutionalisation (Angel & Himes, Reference Angel and Himes1992; Désesquelles & Brouard, Reference Désesquelles and Brouard2003; Soldo, Wolf, & Agree, Reference Soldo, Wolf and Agree1990; Stinner, Byun, & Paita, Reference Stinner, Byun and Paita1990). Marital status and a surviving child strongly influence the living arrangements of older people and consequently the probability of need for formal care. Health is also a determinant. People in good health more often live with a spouse than do those in poor health, and a poor state of health limits the residential independence of people who do not live with a spouse (Gaymu, Ekamper, & Beets, Reference Gaymu, Ekamper and Beets2007).
These results suggest the likely impact of better older adult health in the future. But there is still considerable uncertainty, since past trends for healthy life expectancy give no clear indication. The conclusion from past studies (Robine, Romieu, & Michel, Reference Robine, Romieu, Michel, Robine, Jagger, Mathers, Crimmins and Suzman2003) is that “at worst the increase in life expectancy is accompanied by a pandemic of light and moderate but not severe disability” (p. 88). Changes in the structure of the older population (higher level of education, lower paid workload) as well as behavioural changes (e.g., attitudes to prevention) suggest (but do not determine) that the older people of tomorrow will enjoy better health status than those of today. On the other hand, older people’s future family composition, such as having surviving children, is determined already to a large extent by their past and can, therefore, be predicted with some degree of certainty.
This article describes the results of population projections to 2030 of the family compositions of older persons in Canada and France. In the late 1990s, large-scale projects quantifying future dependent elder care needs as the baby boomers enter very old age have emerged in both Europe and Canada using similar approaches of microsimulation (Carrière, Keefe, Légaré, Lin, & Rowe, Reference Carrière, Keefe, Légaré, Lin and Rowe2007; Gaymu et al., Reference Gaymu, Ekamper and Beets2007). In Canada, for example, LifePaths is a dynamic longitudinal microsimulation model of individuals, which allows us to trace a large number of (synthetic) individuals over the course of their lives, capturing a series of events (e.g., leaving school, marriage, job changes) that then affect probabilities of other events occurring in the future (Wolfson & Rowe, Reference Wolfson, Rowe, Cohen and Leproski2004) . This innovative approach allows a representative account of the complexity of the life cycle of individuals who constitute the Canadian population, marking an improvement over traditional population-based projection models.
A comparison with France is of particular interest to Canada because French society has had a “head start” in terms of population aging having over 11 per cent of population aged 65 and older as early as 1960 compared to Canada’s 7.6 per cent in 1960 (OECD, 2009). Although these two countries, representative of Western countries in general, have considerably different but connected histories,Footnote 1 the future looks similar in many respects. In fewer than 30 years, the proportion of older people in Canada will be similar to that of France, fuelled by a much more accelerated rate of population aging in Canada. Canadians can look to France to assess their policy response to the challenges of managing population aging. Although they have a similar demographic future and both provide a high level of social security (compared to the U.S., for example), the policy environments in which these future trends play out may lead to different outcomes.
The uniqueness of this comparative research is our ability to examine a number of important factors, such as disability status, family situation, and living arrangement using dynamic microsimulation models, a comparison not normally available using classic projection models. It is anticipated that results from this study will give policy makers the needed context to assess outcomes of similar and disparate policy structures. For example, both countries are concerned with the best approach to care for older people at home, yet they have adopted different systems of delivering home care services for older adults (France more centralized and Canada led by provinces). Insights can be gained from comparing changes in family composition and their future implications for assumptions of family availability that are embedded within current policy.
This article examines only the population aged 75 and older, since this age represents a clear turning point in terms of the probability of widowhood and dependency. In France, for example, less than 2 per cent of people aged 60 to 69 are dependent against more than 5 per cent for those aged 75 and more than 10 per cent for those aged 80 and older (Bontout, Colin, & Kerjosse, Reference Bontout, Colin and Kerjosse2002). The goal is to investigate whether older people tomorrow will benefit more often than in the past from the presence of a spouse and children, who are the primary carers in the case of dependency. Of course, living with a partner and having the support of a child does not exclude the need for formal care, especially in the case of cognitive dependency. But people with no family rely far more often on formal care (Lafrenière, Carrière, Martel, & Bélanger, Reference Lafrenière, Carrière, Martel and Belanger2003). The composition of the social network of older people tomorrow will therefore have crucial implications in terms of pressure on family and friend carers (informal care) and on government health system and social services (formal care).
More specifically, this study analysed the projected trends over a 30-year period of the distribution of older people according to the presence of a spouse and a child and the rate of increase among various family configurations. The study demonstrated how changes in the age structure, the sex ratio, marital status, and the proportion of people who do not have a surviving child will transform the family network of older people both in structure and number. At the international level, few models are able to perform demographic projections incorporating as many factors as proposed here.
Method
The models we used to determine the Canadian and French future populations aged 75 and older differ from the traditional component projection model. In both countries, microsimulation models were used – LIPRO for France (Van Imhoff & Keilman, Reference Van Imhoff and Keilman1991) and LifePaths for Canada (Statistics Canada, 2004)Footnote 2 – to estimate populations by marital status, using transition matrices. The models were used simultaneously to project a large number of individual characteristics while incorporating dynamic elements in order to factor in the differential behaviour of each individual according to his/her characteristics. A fictitious cohort was thus created, within which each individual has various probabilities of transition during the life cycle. In Canada, the presence of a surviving child was also microsimulated using the LifePaths model, whereas in France the surviving-child variable was treated using a derivative projection. Lastly, in both countries, the estimates thus obtained were used as a basis to assess living arrangements via derivative projections.
Marital status
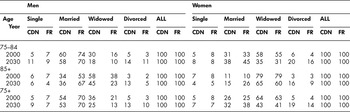
Projecting the population by age, sex, and marital status requires having the rates of transition between the various marital states and data on mortality by marital status and changes to marital status. The start point date for the microsimulation projections were 1 January 2000 in France and on 1 January 2001 in Canada. Death, marriage, and divorce rates observed since the end of the nineteenth century in Canada and the past 20 years in France were extended as trends. With respect to mortality, it was assumed that female life expectancy would increase by less than male life expectancy in both countries. For France, the results of these projections by marital status were examined in a publication (Kalogirou & Murphy, Reference Kalogirou and Murphy2006), and Table 1 sums up the main trends to 2030–2031 in both Canada and France. In 2000–2001, women’s marital status was very similar in both countries, while men’s marital status differed significantly. In France, far more men are married than in Canada, as a result of the low death rate of French women. In 2000, for example, for women life expectancy at age 65 was over 21 years against 20 years in Canada. By contrast, male mortality is similar in both countries (about 16.5 years for the same indicator), and consequently so is the proportion of widows.
Marital status in the Canadian and French populations in 2000–2001 and 2030–2031, by sex and age

Surviving child
The number of children born is a commonly used indicator in family studies. However, to estimate the family composition of future older people, the number of children who survive until their parents’ old age must be taken into account. In Canada, the LifePaths model internally generated the number of surviving children. In France, these data had to be obtained through various calculations: the application of a sex ratio in order to consider the different child mortality rates and the estimation of an average age at the birth of a child (30 for mothers and 32 for fathers) in order to determine the dates of birth of children and thus be able to apply appropriate mortality tables. It was assumed that there were no more births after age 45. That assumption is fairly solid for women, but for men it results in an over-estimation of the percentage of men who have not had children or who no longer have children.
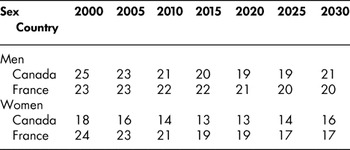
Table 2 summarises the results. In 2000, Canadian women differed from French women with a lower probability of having no surviving children (18% versus 24%), as a result of a bigger baby boom in North America. In addition, whereas in France the situation of men and women is comparable, that is not the case in Canada, where more men than women have no surviving child. At the present stage of the project, it is impossible to know whether this higher probability of Canadian men having no surviving children is the real situation or a limitation of the microsimulation.
Proportion of men and women aged 75 and older in Canada and France with no surviving child

Estimated future family composition
In Canada, we projected the number of married individuals as the ones being either in a legal marriage or in a common law union,Footnote 3 while in France only those with a legal marital status were projected. Then, in France, establishing the future trend of people living as a couple (married or not) required a further step. This last phase of the projection involved breaking down the various sub-populations obtained by the four most common living arrangements among older people: (1) living with a spouse, (2) living alone, (3) living with other people, and (4) living in an institution. To integrate the living-in-an-institution variable into the projections, we have used the French survey Handicap-Incapacités-Dépendances (HID). A logistic regression based on the data from that survey was used to determine the probability of having a particular living arrangement given the variables in the population projected by LIPRO. In both countries, the distributions of family composition by age, sex, marital status, and whether or not there is a surviving child thus obtained in 2000 were kept constant for the review period.
Results
In the future, elderly people will be more likely to have a partner and a surviving child, but …
In 2000, the family composition of Canadian and French women was quite close compared to the men’s family composition: French men far more often had a surviving partner than Canadian men. But in both countries, the family structure of men compared to women differed considerably.
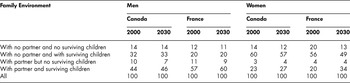
In 2000, for men aged 75 and older, the most common situation was having a spouse (54% in Canada versus 68% in France), whereas in both countries only around 25 per cent of women were in this situation (Table 3). The majority of women (60% in Canada and 56% in France) could only rely on the potential help of a child. Furthermore, in France, more women (20% versus 14% in Canada) had neither spouse nor child to turn to for support. In both countries, few men or women had only a spouse on which to rely (around 11% of men and 4% of women).
Proportion of Canadian and French people aged 75 and older according to their family environment in 2000 and 2030, by sex

Our results indicated that, in the future, the family composition of men and women will change, especially in France, as cohorts that are less frequently childless (and with more surviving children) reach old age and marital status changes. The key trends in marital status expected over the next few decades are a decrease in widowhood and, as a consequence of a cohort effect, an increase in the proportion of divorcees. But the intensity of these trends varies depending on country, sex, and age (Table 1). For example, among people aged 75 and older, men’s marital status will not change much in the future whereas women’s will change radically, especially in France.
Among women, widowhood will decrease sharply owing to the decline in male mortality and life expectancy differentials between the sexes, with this trend more than offsetting the rise in divorce. Currently, 63 per cent of French and Canadian women aged 75 and older are widows. In 30 years’ time, only around 40 per cent may be (and 79% and around 60% respectively of women aged 85 and older). As a consequence in the future, more women will grow old with a partner by their side (see Figure 1). That trend will be much more pronounced in France, mainly because the proportion of divorcees will rise more slowly there (in 2030, 19% of women will be divorced in Canada compared to 14% in France versus 4% in both countries in 2000). As a result, whereas in 2000 French and Canadian women of all ages were in comparable situations, in 2030 a higher proportion of French women will grow old with a spouse (respectively 38% and 31% among those 75 and older).
Proportions of Canadian and French people aged 75 and over according to their family composition in 2000–2001 and 2030–2031, by sex and age

Like women, owing to the decline in mortality and, as a consequence, a decline in widowhood, our results indicated that more men aged 85 and older will benefit from the presence of a partner (in Canada, 36% in 2030 versus 34% in 2000, compared with 63% and 49% respectively in France).Footnote 4 But again the trend is expected to be much less pronounced in Canada, and in 2030 more Canadian men aged 85 and older will be without a partner than were French men in 2000 (64% versus 50%). In other words, the issue of care provision for the population with strong care needs will be posed in very different terms in the two countries.
By contrast, unlike what is observed among older cohorts, in both countries the proportion of men aged 75 to 84 living with a spouse is expected to decrease by 2030 (see Figure 1). At those ages, the decline in the probability of widowhood will not offset the increase in the proportion of divorcees and unmarried men, along the lines of the trends observed in the past few decades among people aged 75 and older (Delbès & Gaymu, Reference Delbès and Gaymu2003b).
Furthermore, for men and for women, not having any surviving children will be a slightly less common situation over the projection horizon of this study (Table 2). The fertility of the cohorts that make up the population aged 75 and older in 2000 (born in 1925 and earlier) was disrupted by economic crisis and World War II, and the cohorts were characterised by a low fertility rate. The cohorts that came later were not only less frequently childless, but more of their children survived.
As a result, in the future among people aged 85 and older and French women aged 75–84, not having any immediate family possibly available in the event of need will be less common. The example of French women aged 85 and older, the most exposed now to that risk, is a good illustration of this trend (Figure 1): in 2000, 23 per cent had neither a spouse nor a surviving child; in 30 years’ time only 16 per cent will be in that situation. Meanwhile, this family configuration will involve a small but stable percentage of all Canadians aged 75 to 84 and of French men aged 75 to 84 (about 12%).
With few exceptions, our results indicated that the family composition of older people will improve: a much higher percentage will grow old with a spouse and more frequently have at least one surviving child. The situation of French people, regardless of age and sex, will be more favourable in this regard than that of Canadians. However, in both countries, the problem of the availability of those family members (i.e., their ability and willingness to cope with the dependency of their spouse, parents, or parents-in-law) remains relevant. Moreover, a decrease in the proportion of people without potential family support can occur simultaneously with an increase in the total number of people in this situation. The trend in absolute numbers is crucial to policy making on elder dependent care and planning for future services.
The population without potential family carers will increase
By 2030, the population aged 75 and older will increase by more than 146 per cent in Canada and by 80 per cent in France, and unless there is an improvement in health, the physically or cognitively dependent population will increase at the same rates. The different intensity between the two countries can be attributed chiefly to a bigger baby boom in Canada (Légaré & Alix, Reference Légaré, Alix, Oris, Brunet, Widmer and Bideau2007).
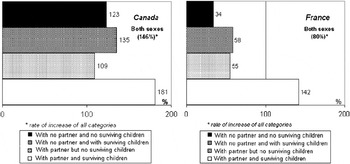
Given the projected size of the increase, there will be more older people in all the family configurations we examined. These trends in the probability of being in a particular family composition are presented according to size of increase (see Figure 2). Again, the difference in intensity is striking. In Canada, all the categories are anticipated to at least double whereas in France the people most at risk (i.e., with the smallest family circles) will increase only by a maximum of 50 per cent. But in both countries, the population living with a spouse will increase more sharply than the population without a partner, and the population with at least one surviving child will increase faster than the population with no children.
Percentage change between 2000–2001 and 2030–2031 of the Canadian and French population aged 75 and older according to different family configurations

The growth rates of the various categories, on the basis of our study, will be much more uniform in Canada than in France. In other words, although in both countries the most vulnerable population (i.e., without any potential spouse or child carer) will increase more slowly than the other population categories, the gap between the two will be considerable in France (an increase of 34% versus 80% on average) but much smaller in Canada (123% and 146% respectively).
Theoretically, for dependent older people, living with a spouse or having a surviving child is a less vulnerable situation than being without these family members. However, the spouse may be in poor health and the children may not be willing or available to provide care. These older people can therefore be in situations of great family vulnerability and, like those without a spouse or children, have a strong need for formal care in the event of health problems.
The population living with a spouse but with no surviving children will increase by 55 per cent in France and double in Canada. This situation will nonetheless still be unusual; in 2030, it will only account for around five per cent of people aged 75 and older in both countries. No longer having a spouse and being able to rely only on children, however, is a more common scenario and is the typical profile of older women. In both countries, this population will increase fairly steeply (by 135% in Canada and by 58% in France) but by less than the total population in Canada and by far less in France. By 2030, the bulk of the increase in the population will consist of people with both a spouse and children. This category will grow at almost twice the rate of the whole population (142% versus 80%) in France and by 181 per cent in Canada, which is much closer to the rate of increase of the whole population (146%).
These results point to a new division between needs for formal and informal care in the future. The populations in most need of formal care will increase, but at a much slower rate than those who have potential family support. Canada is in a much less favourable position than France on this score, since the growth rates of the different populations are more uniform than in France.
Furthermore, this transformation in the population composition has already been determined to a large extent by the cohorts’ history. The main uncertainty concerns the trend in marital status. It was possible, however, to demonstrate the strength of the assumptions underlying the estimates. Trends in marital status depend mainly on the current proportion of married people and trends in mortality; marriage, divorce, and migration rates only have a minor impact. We therefore tested various assumptions on mortality. They only had a small impact on estimates of marital status in the future (Kalogirou & Murphy, Reference Kalogirou and Murphy2006).
Trends highly dependent on sex and age
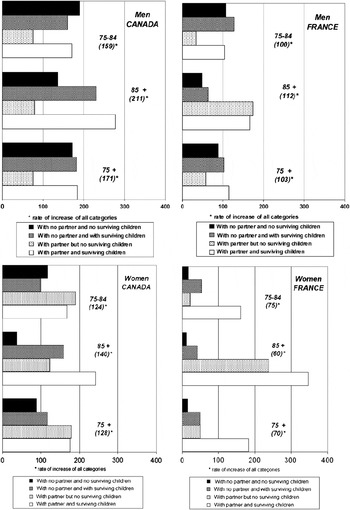
A breakdown of these trends in family composition by age and sex (see Figure 3) sheds extra light on future implications of the changing population structure. Two trends point to stronger demand for care from outside the couple.
Percentage change between 2000–2001 and 2030–2031 of the population according to different family configurations, by age and sex

The hierarchy of the intensity of growth rates described above, particularly strong when the family composition includes both spouse and children, does not apply to men aged 75 to 84, who have quite a specific situation: among that group, the population without a spouse will increase by slightly more than the population with a spouse (by 169% versus 152% respectively in Canada and by 112% versus 92% in France). Furthermore, as in the other age groups, the percentage of those with surviving children will increase faster than those without children (by 167% versus 135% in Canada and by 109% versus 68% in France respectively). However, divorced men in this age group, whose numbers will increase considerably (they will be multiplied by a factor of more than six in France and by almost 10 in Canada), will rarely be able to rely on their children. Several research papers have shown that divorced men, unlike divorced women, see their children less often and benefit less often from their help in old age (Attias-Donfut, Reference Attias-Donfut1995; Cooney & Uhlenberg, Reference Cooney and Uhlenberg1990; De Jong Gierveld et al., Reference De Jong Gierveld, Van Tilburg and Lecchini1997). However, divorced men are more likely than divorced women to re-partner in a non-conventional union (Living Apart Together-LAT), but, in case of incapacities, the behaviour of these new partners remains uncertain.
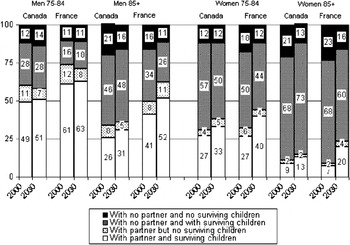
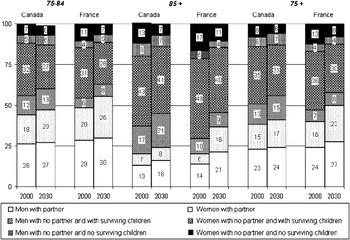
Furthermore, given the stronger increase in male life expectancy in both countries, the male population will grow much faster than the female population. Among people aged 85 and older, where the contrast is the starkest, the number of men will increase at 1.5 times the pace of women in Canada, and at almost twice the pace of women in France. Yet, despite this projected increase in masculinisation of the population, the female population living with a spouse will increase by almost as much as that of men in Canada, whereas in France the female population living with a spouse will grow almost twice as fast as that of men. Widowerhood will decrease less among men than widowhood among women. Given these trends, the structure of the population aged 85 and older will change substantially over the next 30 years (see Figure 4). Currently in Canada, this population is composed of 43 per cent of women with no spouse and only the possibility of relying on their children (49% in France) and of a further 13 per cent without any potential support (17% in France). In 30 years, these proportions will fall to 41 per cent and 7 per cent in Canada and 40 per cent and 11 per cent respectively in France.
Structure of the population in 2000–2001 and 2030–2031 according to age, by sex and family configuration

Although it is projected that fewer women without a spouse will form the Canadian population aged 85 and older, more partnerless men will (28% in 2030 versus 25% in 2000). In France, the decrease in the share of partnerless women, however, occurs simultaneously with an increase in the share of men and women living with a spouse (37% in 2030 versus 20% in 2000), a trend also observed, to a lesser extent, in Canada (24% versus 20% respectively).
A growing fraction of elderly men and women will therefore be confronted with the potential dependency of their spouses. The same trends were observed in the 75 to 84 age group: in 2000, 44 per cent of Canadians and 49 per cent of French had to cope with the potential dependency of their spouses; in 2030 those proportions are projected to reach 47 per cent and 56 per cent respectively (see Figure 4).
… and on the projection horizon
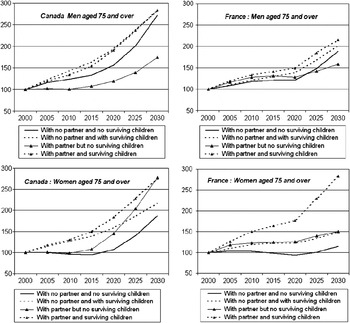
Figure 5 offers additional indications on the intensity of trends over time. In all future cohorts, the projected decline in mortality will mean that more people will live to 75 and survive longer beyond this age. In addition, after 2020, the first cohorts of the baby boom will turn 75, swelling the numbers of very old people even more. In our results, 2020 marked a sharp acceleration in trends. On this point, however, there was a stark contrast between the two countries, with a much faster acceleration in growth anticipated in Canada.
Trend between 2000–2001 and 2030–2031 of the population aged 75 and older (base 100 = 2000) according to various family configurations

The example of the population of women without spouses or children was significant; until 2020, in both countries it should remain practically stable, but over the subsequent 10 years it is expected to increase by 10 per cent in France and double in Canada. For men in the same situation, the acceleration after 2020 should see numbers double in France and triple in Canada. The bulk of expected increases should therefore not occur until after 2020, with the turning point in the pace of change observed for all situations.
Discussion
The results we have presented paint another picture of the burden of dependent care anticipated on the basis of the expected increase in the older population. Over the next 25 years, the pool of potential family carers, consisting of spouses and children, will broaden, and the populations most dependent on formal care, with no potential support from a child or a spouse, will increase at a slower rate than the total population. Canada and France, however, differ on two points. As a result of greater matrimonial instability in Canada (higher rate of divorce and non-marriage, which may be out of choice or the result of the breakdown of a union other than marriage), the trends for the different categories will be much more uniform. Moreover, since the baby boom was bigger in North America in all family contexts, numbers are expected to be much higher in relative terms. However, any future improvement in healthFootnote 5 would significantly lower the impact of those increases and consequently the burden of dependent care (Gaymu et al., Reference Gaymu, Ekamper and Beets2007; Légaré & Décarie, Reference Légaré and Décarie2007).
The two countries are the same on one point: since the number of women with a spouse will increase at a faster pace than men with a spouse, men and women’s family compositions will be more similar than they are now. Among people aged 85 and older, where the contrasts between the sexes are the starkest, today men are more than three times as likely to live with a partner than are women in Canada (5.5 times more likely in France). In 30 years, in both countries, this factor will be less than 2.5. The trend will result in higher-quality care for dependent older women only if tomorrow’s men are up to the task.
Increased responsibility of husbands confronted by their wife’s disability will be the more challenging to them because they belong to cohorts who have spent the bulk of their family life in the 1980s or before, in a time of serious imbalance between men’s and women’s contribution to household tasks and child care. However, today’s men have more trouble coping with the dependency of their wives than the reverse: men more often turn to formal care (Martel & Légaré, Reference Martel and Légaré2001) or put their wives in institutions (Delbès & Gaymu, Reference Delbès and Gaymu2006). Consideration must also be given to the high correlation between spouses’ health conditions,Footnote 6 which means that a large proportion of male carers will themselves be severely hampered in their daily activities.
Last but not least, disabled persons living with a partner will be older on average tomorrow than today and so will be their carers. The probability for the latter to be themselves disabled will be reinforced. Policy makers will have to pay increased attention to spouses as primary carers, in particular to husbands. The very low proportion of married persons institutionalised reveals the efficiency of this type of support to maintain older people in their own settings, even despite their poor health condition. Yet these spouses are less likely to self-identify as caregivers (Cranswick & Dosman, Reference Cranswick and Dosman2008) and may be reticent to seek out assistance. The current policy context in Canada and France does not encourage caregivers to come forward unlike in the U.K. where the 1995 Carer’s Act legislates the right for carers to have their needs assessed (Keefe, Guberman, Fancey, Barylak, & Nahmiash, Reference Keefe, Guberman, Fancey, Barylak and Nahmiash2008). The same reservation applies to children. While for tomorrow’s older people being childless will be less common in both countries, there is uncertainty about children’s willingness or ability to take on that responsibility. In addition, when Canadians are willing to provide care, they enter into a fragmented system of care delivery – one that varies across provinces, and within provinces across regions, in terms of its reliance on public and private home care programs and the availability of voluntary and community supports.
Our study has a number of limitations. First, the study results did not consider changes in cultural norms and behaviour. For example, women, to whom the burden of care for older parents falls much more often, will be less available in the future because of higher workforce participation. Recent studies show that women manage to combine paid work and care for older parents, but often by making considerable concessions in terms of their careers; when they have to provide substantial care, they significantly reduce their working time (Ettner, Reference Ettner1995; Spiess & Schneider, Reference Spiess and Schneider2003). However, will tomorrow’s women, in more egalitarian couples and who have found a sense of identity in areas other than the family, particularly through careers, accept the constraints imposed by the dependency of their parents and/or parents-in-law?
Many studies show that women take on the role of carer at the expense of their health. The difficulty and stress associated with caring for older relatives show up in higher rates of psychological disorders, particularly depression (Schulz, O’Brien, Bookwala, & Fleissner, Reference Schulz, O’Brien, Bookwala and Fleissner1995). In addition, it has also been suggested that tomorrow’s elders might be less inclined to see themselves as dependent on their families and to see their daughters in the role of carer. Today, in countries where professional services are sufficiently developed, older people clearly prefer that solution, especially when they need personal care or long-term care. The expectations of older people in this area do not seem to be met, and, everywhere, a majority of older people agree that the bulk of dependent care in the future should be formal (Daatland & Herlofson, Reference Daatland and Herlofson2003).
This change in the behaviour of carers and care receivers is hard to predict, but it could lead to major changes in the division between formal and informal care. If demography shows us that the most vulnerable will not increase as fast as those who benefit from potential carers, in both countries there is a major uncertainty on the behaviours of these carers, hence the necessity for the policies dedicated to the well-being of the dependent older population to be primarily oriented to supporting family carers in the future.
A second study limitation is our decision not to consider the influence of income on family composition. For care scenarios, it is acknowledged that, in both France and Canada, there has been genuine political will in recent decades to fund dependent care because future costs may erode collective solidarity. If that happens, will the financial situation of tomorrow’s older people enable them to benefit from formal care and consequently to grow old at home? In recent decades, in most western countries, older persons have turned away from intergenerational co-residence in favour of staying in their own home, and improvements in their economic situation have greatly contributed to this change (McGarry & Schoeni, Reference McGarry and Schoeni2000; Michael, Fuchs, & Scott, Reference Michael, Fuchs and Scott1980; Mickus, Stommel, & Given, Reference Mickus, Stommel and Given1997).
Future trends in older people’s purchasing power will therefore be an important factor in any continuation of this trend. The future income position of older people is hardly predictable due, for example, to the uncertainty about general economic performances or policy choices. However, some structural trends among older people (women’s increased participation in paid work, higher professional qualifications) should make tomorrow’s old people richer than today’s (Mo, Légaré, & with the collaboration of Guillaume Marois, Reference Mo, Légaré and Gauthier2007). But the financial capacity of older people to pay for professional assistance in day-to-day living will depend greatly on the viability of pension systems. On that score, France seems in a worse situation because the future of pensions seems guaranteed in Canada, whereas in France there is great uncertainty about funding for future pensions. Greater economic insecurity and/or government failure to help older people stay at home would put additional pressure on families, which already provide most of the care to the most fragile layers of society. Future policy orientations may also affect other areas that our study did not include, such as residential accommodation, house prices, and migration. Each of these could influence the price of formal care and could completely change the quality of life for older people still living at home.
Although the demographic history of the two countries, representative of many other Western countries, is similar, their specific behaviour after World War II will exert a different influence on the family circle of older people in the future. Older people’s potential support network will improve less in Canada than in France, and the population without potential family support will increase more sharply in Canada (123%) than in France (34%). Since this population relies more on formal services, and is at greater risk of institutional care, formal services will need to be expanded in the two countries, but the bigger increase in numbers will lead to stronger financial pressure in Canada. Furthermore, in both countries, regional differences occur in the current proportion of oldest-old as well as the family structures, and these differences will intensify in the future.
In Canada, in 2031, the percentage of persons aged 65 and older could vary from 21 per cent in Alberta to 29 per cent in New Brunswick (compared to 10% to 13% today) (Human Resources and Skills Development Canada, 2009). These two regions also exemplify the extent of regional economic disparities that exist in Canada. Such challenges are even more acute when considering that the Canadian health care system, in contrast to the French one, is decentralized. This intersection of uneven demographic demands and varying economic resources within the context of a decentralized system may even deepen inequalities in the quality of services for assistance to dependent people.
Even if, in the near future, both Canada and France will have the same proportion of older people, the comparisons between the two countries show us that, in between, the two countries will face different adaptation issues. For example, Canada will have to deal with a more important relative weight of older people compared to youth, while in France the financial autonomy of older people will be more an issue. However, both countries will face similar challenges related to one issue: by the end of the projection period, after 2020, signs appear which suggest that the longer-term future could be different from what has been forecast up to 2030. In particular, the probability to still live with a partner at older ages could be put in question by the greater instability of unions, and the availability of surviving children could be reduced, not by competition between caring for older parents and other activities but (also) by the mere absence of any daughters or sons.
The results of our study have led to an improvement in the projections of the future family composition of older persons by applying microsimulation techniques rather than traditional population-based projection models. We can conclude that the future challenges Canada faces are not only limited to rate of change among different family compositions – with Canada having sharper increases among those without close family than does France – but that these national trends may be masking even further variations across provinces and territories. Equally important to understanding the changing family composition of older persons are the policy implications of these demographic shifts and the opportunity for the national government to intervene. Canada may be more prepared in terms of pension policy than France, but Canada has less control over policies to enhance service delivery to support dependent care in the community than does France, because such policies are under provincial jurisdiction. Nevertheless, our results support calls for increased attention to caregiving policies directed to available family including frail older spouses as well as adult children. Indeed, the shortage of family carers is likely to become more acute after 2030 than before. It is one more reason for an active policy regarding family carers to be implemented now, when there is still time.