

At the U.S. 2012 general election, six minority women were newly elected to the House of Representatives, a net increase from 21 to 23, and a rise from 23% to 27% as a proportion of all women in the House (CAWP 2010, 2012). Among this group was Iraq War veteran Tulsi Gabbard (D-HI 2nd District), the first Hindu American to serve in Congress. Despite generally positive coverage, her local paper also framed Gabbard's identity as an “underdog … on the margins of popular respectability.”Footnote 1 In Utah, Mormon Mia Love ran the first viable black female Republican campaign, securing 47% of the vote in the state's overwhelmingly white 4th District. Love was frequently framed positively as a “historic candidate” and was invited to speak at the GOP convention that year. Despite this, her self-portrayal as a product of the American dream—linking her second-generation Haitian identity to her partisan politics—drew sharp criticism. Local campaign coverage even interrogated the legality of her family history with headlines such as “Love's Immigrant Story may be True, but Some Questions Linger.”Footnote 2
Thus, in addition to increasing numbers of minority female candidates and representatives, racial, religious, and partisan difference among women of color in elite U.S. politics is on the rise. However, media responses have been mixed. While there has been extensive analysis of coverage of (white) women and (male) minority candidates in comparison to their white male counterparts, little attention has been paid to the intersectional effects of race, gender, or, indeed, other aspects of candidate identity in this context.
Building on the work of Gershon (Reference Gershon2012), I compare local newspaper coverage of the population of viable minority female House candidates to that of matched samples of minority men and white women and men running in the U.S. 2012 general election. I analyze the frequency and overall tone of coverage, as well as explicit foregrounding of female candidates’ gender. The findings indicate that minority women receive less positive and more negative coverage than all other racial gendered groups. Additionally, important intersectional differences in the mediation of campaigns by women from different racial groups are observed: minority women are less visible than their white female counterparts, and when they do receive coverage, it is twice as likely to explicitly foreground their gender.
INTERSECTIONALITY AND MINORITY WOMEN IN ELITE POLITICS
This article employs a theoretical framework underpinned by the concept of intersectionality, as articulated by Crenshaw (Reference Crenshaw1989, Reference Crenshaw1991), Hill Collins (Reference Hill Collins1990), and King (Reference King1988), among others. “Rooted in Black feminism and Critical Race Theory, intersectionality is a method and a disposition, a heuristic and analytic tool” (Carbado et al. Reference Carbado, Crenshaw, Mays and Tomlinson2013, 303). The metaphor of intersection is used to describe the ways in which axes of identity such as race and gender are both mutually constituted and mutually constitutive. In this context a single-axis lens that considers only the effects of race or gender—as has usually been employed in studies of media coverage of predominantly white women and minority men running for office—is not deemed sufficient to analyze the intersectional effects of both on coverage of increasing numbers of minority female candidates. By considering only the effects of a single axis of identity on campaign coverage, research on women and minorities in politics runs the risk of making claims about media treatment of “female” or “minority” candidates that obscure the experiences of minority women.
Despite repeated calls both for intersectional approaches and the centering of women of color as subjects in political science research (Alexander-Floyd Reference Alexander-Floyd2014; Junn and Brown Reference Junn, Brown, Wolbrecht, Beckwith and Baldez2008; Prestage Reference Prestage, Githens and Prestage1977; Smooth Reference Smooth2006), the discipline has been slow to respond, particularly with regard to the study of elite electoral politics. The growing community of scholars that has taken up this task has consistently generated empirical findings that confirm the utility and necessity of this framework. There are clear knowledge gains to be made when minority women are no longer subsumed by the categories “minorities” or “women.” For example, Smooth (Reference Smooth2011, 438) shows that while female African American representatives confirm that women's interests are among their principal legislative priorities, these interests are not the usual suspects as determined by women and politics scholarship, and the “narrow conceptualization of women's interests has significant implications for research on representation.” This is just one instance of how intersectional scholarship has begun to document the ways in which, among black female politicians, patterns of descriptive and substantive representation, factors determining electoral success, political priorities, and legislative experiences and behavior are distinct from those of their white female and black male counterparts (e.g., Barrett Reference Barrett and Carroll2001; Bratton et al. Reference Bratton, Haynie and Reingold2006; Brown Reference Brown2014a; Reference Brown2014b; Darcy and Hadley Reference Darcy and Hadley1988; Darcy, Hadley, and Kirksey Reference Darcy, Hadley and Kirksey1993; Herrick and Welch Reference Herrick and Welch1992; Philpot and Walton Reference Philpot and Walton2007; Smooth Reference Smooth and Reingold2008).
However, this body of research has rarely focused on the intersectional effects of candidate race and gender on the mediation of political campaigns. The results of a groundbreaking analysis by Gershon (Reference Gershon2012) indicate that among House incumbents, African American women and Latinas receive less frequent and more negative coverage than all other groups. Gershon's work therefore provides both a methodological precedent and an empirical imperative for further intersectional investigation into the effects of candidate identity on the quality, quantity, and content of campaign coverage, placing women of color at the center of analysis.
As Cohen (Reference Cohen and Carroll2003, 193) notes, “the documented or written knowledge on the political involvement of women of color is not evenly distributed across racial groups. There has been significantly more written on the experiences of Black women within and outside the traditional modes of political expression.” While scholarship that centers on Latinas in the political sphere is gaining ground (e.g., Bejarano Reference Bejarano2013; Casellas Reference Casellas2011; Fraga et al. Reference Fraga, Martinez-Ebers, Ramirez and Lopez2003, Reference Fraga, Lopez, Martinez-Ebers and Ramírez2007; Montoya, Hardy-Fanta Reference Montoya, Hardy-Fanta and Garcia2000; Takash Reference Takash1993), the literature on Chicana, Asian American, and Native American women in politics is somewhat more sparse, despite some notable exceptions (e.g., Chu Reference Chu1989; Gutiérrez, Meléndez, and Noyola Reference Gutiérrez, Meléndez and Noyola2007; Hardy-Fanta et al. Reference Hardy-Fanta, Lien, Pinderhughes and Sierra2006; Lien Reference Lien2010; Marquez Reference Marquez1997; Sierra and Sosa-Riddell Reference Sierra and Sosa-Riddell1994; Takash Reference Takash1993; and Wong Reference Wong2013). The sample employed in this article treats women of color as a “political category” and includes black, Latina, Middle Eastern American, and Asian American candidates, while being mindful of the heterogeneity within this group (Lien et al. Reference Lien, Hardy-Fanta, Pinderhughes and Sierra2008).
Work that addresses this heterogeneity counters the notion of an entirely ubiquitous “double disadvantage” for minority women in politics, identifying instead more complex patterns in the combined effects of race/ethnicity and gender in specific contexts. For example, Fraga et al. (Reference Fraga, Martinez-Ebers, Lopez, Ramírez and Reingold2008) posit “strategic intersectionality” to conceptualize the dynamics in which Latina representatives in state legislatures enjoy advantages over Latino colleagues as advocates for working-class communities of color. Similarly, Bejarano (Reference Bejarano2013) partially attributes Latinas’ success in gaining descriptive representation to the perceived softening of racial threat due to gender, again creating advantages compared to Latinos. In the context of debates over whether and how to conceptualize intersectional effects as additive, multiplicative, or convergent, the question is raised of whether the “double novelty” of being a minority female candidate could result in possible advantages as well as disadvantages in terms of campaign coverage.
While intersectional scholarship has been crucial to gaining an understanding of the marginalized experiences and contributions of women of color in American politics, it would also be a mistake to assume that a single-axis approach is adequate to understand media representations of white women, minority men, and indeed white men. For example, Hancock (Reference Hancock2009, 96) notes that in research on the 2008 U.S. general election cycle, “the deep attention paid to Clinton and Palin has so far focused on gender despite the candidates’ own allusions to race and class identities as complicating factors in their gendered self-presentations.” I therefore aim to position minority women as central subjects of analysis while making comparisons with candidates from other racial gendered groups.
RACE, GENDER, AND NEWS COVERAGE OF ELECTIONS
This design considers the intersectional effects of candidate identity on three key aspects of campaign news coverage: its overall frequency, tone, and the degree to which it foregrounds female candidates’ gender.
Frequency of Coverage
The frequency of news coverage received by a candidate—for example, in terms of the number of articles or name mentions over a campaign period—is a key predictor of candidate recognition, particularly for challengers (Goldenberg and Traugott Reference Goldenberg and Traugott1980, 72). Both U.S. and international gender and politics scholarship has repeatedly found that female candidates receive less coverage than their male counterparts (Adcock Reference Adcock2010; Banwart et al. Reference Banwart, Bystrom and Robertson2003; Braden Reference Braden1996; Bystrom, Robertson, and Banwart Reference Bystrom, Robertson and Banwart2001; Falk Reference Falk2008; Gidengil and Everitt Reference Gidengil and Everitt2003; Heldman, Carroll, and Olsen Reference Heldman, Carroll and Olson2005; Kahn Reference Kahn1994a; Kahn and Goldenberg Reference Kahn and Goldenberg1991; Ross Reference Ross2002). However, some studies suggest that this gap may have closed or at least be waning (Bystrom, Robertson, and Banwart Reference Bystrom, Robertson and Banwart2001; Jalalzai Reference Jalalzai2006; Kittilson and Fridkin Reference Kittilson and Fridkin2008; Ross et al. Reference Ross, Evans, Harrison, Shears and Wadia2013; Smith Reference Smith1997). Employing a content analysis of local newspaper coverage of races in 350 House districts, Hayes and Lawless (Reference Hayes and Lawless2015, 101) find “no evidence that candidate sex is related to the volume or content of media coverage candidates receive,” arguing instead that partisanship, ideology, and incumbency are the key determinants of coverage outcomes. The question remains, however, whether these developments extend to both minority and white women.
U.S. race and politics literature meanwhile suggests that African American candidates tend to receive equal or greater levels of coverage than their white counterparts (Barber and Gandy Reference Barber and Gandy1990; Graber Reference Graber, Holli and Green1984; Sylvie Reference Sylvie1995; Terkildsen and Damore Reference Terkildsen and Damore1999; Zilber and Niven Reference Zilber and Niven2000). Findings regarding the frequency of coverage of Latina/o and Asian American candidates and representatives are mixed and difficult to generalize because they tend to be based on case studies of individuals rather than larger samples (e.g., Larson Reference Larson2006).
Tone of Coverage
Single-axis research into the effects of race or gender has consistently shown that both women and minority candidates and representatives are disadvantaged in terms of the tone of coverage they receive compared to white male counterparts. Women and minorities are covered more negatively both during and between elections (Banwart, Bystrom, and Robertson Reference Banwart, Bystrom and Robertson2003; Bystrom, Robertson, and Banwart Reference Bystrom, Robertson and Banwart2001; Heldman, Carroll, and Olsen Reference Heldman, Carroll and Olson2005; Jeffries Reference Jeffries2002; Kahn Reference Kahn1994a; Kittilson and Fridkin Reference Kittilson and Fridkin2008; Larson Reference Larson2006; McIlwain and Caliendo Reference McIlwain and Caliendo2009). For example, Niven's (Reference Niven2004) study of coverage of the 1992 U.S. House banking scandal found that African American males and white females in the House both received more negative newspaper coverage than white men who bounced the same number of checks. Niven attributes this to a distribution effect in which the conspicuousness of women and minorities means they are evaluated more harshly. Again, some recent research suggests a promising reduction in gendered differences in the tone of coverage women and men in the aggregate (e.g., Hayes and Lawless Reference Hayes and Lawless2015). This does not, however, preclude the absence of continued disadvantages for minority women with multiple subordinated racial and gendered identities.
Intersectional Findings
In contrast, Gershon (Reference Gershon2012) shows that when an intersectional approach is employed—by comparing patterns of coverage of minority women, minority men, white women, and white men—a different pattern emerges. Among incumbent U.S. House representatives running for reelection in 2006, minority men and white women received coverage comparable to white men, but minority women received less coverage and less positive coverage than all other groups. Therefore Gershon's findings indicate that, in terms of the frequency and tone of coverage, the effects of race or gender alone are not disadvantageous for white women and minority males but that the intersectional effects of race and gender continue to result in unfavorable coverage for minority women. Gershon's results are limited to incumbent minority Latina and African American women, compared to random stratified samples from other racial gendered groups. I aim to both further isolate the intersectional effects of race and gender by matching minority women with similar white male and female and minority male candidates and testing whether these intersectional disadvantages apply to a wider group of minority women that includes viable challengers as well as incumbents and a broader range of ethnicities. I therefore form the following hypotheses:
H1:
Minority women will receive less frequent coverage than white women and men and minority men.
H2:
Coverage of minority female candidates will be less positive than coverage of white women and men and minority men.
Foregrounding of Female Candidates’ Gender
In addition to the frequency and tone of coverage received, I also analyze the content of coverage in terms of the comparative foregrounding of minority and white women's gender. The media's tendency to employ explicitly gendered frames in coverage of female politicians is well documented (Banwart et al. Reference Banwart, Bystrom and Robertson2003; Falk Reference Falk2008; Heldman, Carroll, and Olsen Reference Heldman, Carroll and Olson2005; Kahn Reference Kahn1994a; Ross et al. Reference Ross, Evans, Harrison, Shears and Wadia2013; Sreberny-Mohammadi and Ross Reference Sreberny-Mohammadi and Ross1996). However, there is some debate around the effects of highlighting women's gendered identities. Sreberny-Mohammadi and Ross (Reference Sreberny-Mohammadi and Ross1996) suggest that the frame is associated with increased frequency of coverage, while Falk (Reference Falk2008) and Puwar (Reference Puwar2004) argue that despite this association, the frame emphasizes the notion of women as unnatural in the political sphere and renders them subject to additional surveillance. For minority women I expect to observe a multiplicative process in which their racial difference also renders their gender more salient than that of white female candidates. For example, in the case of a candidate such as Mia Love who is prominently framed as the “first African American Republican woman,” the novelty of her racial identity is likely to make her gender more salient than that of a white female GOP candidate. Therefore, my third hypothesis states,
H3:
Coverage of minority women will be more likely to foreground candidate gender than that of white women.
METHODS AND DATA
Candidate Sampling and Matching
Several data sources were merged in order to compare the populations of 2012 general election candidates from different racial, gendered groups.Footnote 3 In total, 840 major party general election candidates were identified: 421 Republicans and 419 Democrats. This group comprised 568 white men, 119 white women, 107 minority men, and 46 minority women. From this population, the sample was then limited to viable candidates in order to exclude those whose campaigns could reasonably be interpreted as sacrificial or symbolic and therefore having little chance of capturing the attention of local newspapers. Building on Kahn (Reference Kahn1994a), viability is measured using vote capture, including only candidates receiving at least 40% of the general election vote. Among incumbents, 38 candidates holding leadership positions in the HouseFootnote 4 were also excluded given that all but five positions were held by white men and that the likelihood of increased coverage is associated with these roles. The exclusion of nonviable candidates and incumbents holding leadership positions generated a sample of 532 individuals: 356 white men, 74 white women, 69 minority men, and 33 minority women.
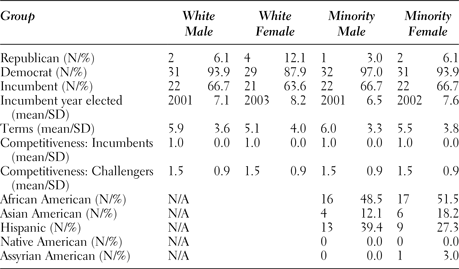
In addition to disparities in numbers of candidates from different racial, gendered groups, substantial variation in the distribution of politically relevant characteristics by race and gender was also identified. For example, minority women were far more likely to run as Democrats, with only Mia Love (UT-4th District) and Jaime Herrera Beutler (FL-27th District) running on viable Republican tickets.Footnote 5 Additionally, both incumbent and challenger minority women ran in markedly fewer competitive races and were more likely to be unopposed: 12% compared to 6% of white men, 1% of white women, and 7% of minority men. While intersectional racial gendered differences in term length were not observed, the small population of incumbent minority representatives were also more senior on average than white incumbents, having a served mean of 6.5 terms, (SD = 4.7) compared to 5 (SD = 4.6) among whites (minimum = 1 and maximum = 15). Significant regional differences were also identified, with viable minority women less likely than all other groups to run in the Northeast, Midwest, or South, and more likely to run in the West.
Because factors such as incumbency, partisan identification, and race competitiveness are particularly likely to affect the quality, quantity, and content of campaign news, a matching strategy was developed to pair each of the population 33 viable minority women with a similar minority male, white male, and white female candidate. This generated a total sample of 132 candidates. By matching these characteristics in the sample, as well as controlling for candidate, campaign, and media factors in the models (discussed below) the strategy therefore aims to isolate the intersectional effects of race and gender on election coverage by controlling for the considerable racial and gendered variation in candidates’ attributes. Exact white male, white female, and minority male matches on party, status, and competitiveness were generated for 31 of 33 minority women, with close matches for those remaining. The majority were also matched on seniority and region. The mean terms served is 5.7, compared to 5.5 among minority women, and 43% of all candidates in the matched sample ran in the West, compared to 52% of minority women. Small sample sizes precluded matching minority male and female candidates by ethnicity while considering additional politically relevant factors. However, the eventual proportion of different ethnicities among both groups is very similar, as shown in Table 1 below.
Matched sample candidate characteristics by intersectional identity

Text Sampling
The selection of local newspaper coverage over other media reflects several empirical considerations. Kahn (Reference Kahn1994b, 158) argues that newspapers contain more information about campaigns than local television news and that voters receive more information about congressional races from newspapers than television. Similarly, Terkildsen and Damore (Reference Terkildsen and Damore1999, 686) note that newspapers are more likely than television to give free campaign coverage to congressional contenders and to assist readers in identifying candidate assets and liabilities. Kittilson and Fridkin (Reference Kittilson and Fridkin2008, 379) add that newspaper articles are preferable to television coverage because of their impact on other news sources. The highest circulating local newspaper published within each of the 132 sampled candidates’ districts was identified employing the strategy developed by Lawless and Hayes (Reference Lawless and Hayes2014, 36).Footnote 6 In a small number of cases where no local newspaper was published within a candidate's district, the highest circulating newspaper published in an adjacent district was used. Within the sample there is substantial variation in the circulation sizes of local publications, ranging from 6,749 to 552,896. However, pairwise comparisons of mean circulation size by candidate identity are not statistically significant.
In order to capture coverage of the full campaign, the timeline for the sample is all days, eight weeks prior to the general election on November 6, 2012. Articles were downloaded from Nexis, Access World News, Newsbank, or Gannett where possible and directly from newspaper web site archives in a small number of cases. For each candidate, the search term “‘first name’ AND ‘last name’” was used within the date range, generating a sample of 1,754 articles. These included news reports, op-ed columns, and letters to the editor, in order to reflect the full variety of sentiments represented within each publication.
DEPENDENT VARIABLES AND MODELS
Frequency of Coverage
The frequency of coverage is measured both as the number of articles mentioning a candidate and as the number of times a candidate's name is mentioned within the time-frame.Footnote 7 The dependent variables are counts, and, therefore, negative binominal regressions are used. The unit of analysis is the candidate.
Tone of Coverage
The overall tone of coverage is measured on a three-point negative to positive scale. Where a text is read as neutral or where positive and negative references are read as equal, it is coded as “neutral/balanced.” The interpretation of the tone of a text accounts for both explicit appraisal by the author of those cited and latent aspects of coverage such as the use of negative speech verbs or emotions to describe a candidate.Footnote 8 While there is an undeniably subjective element to evaluating the overall tone of a text, two coders performed a test of intercoder reliability for all variables, with agreement reaching a minimum score of .8 calculated using Krippendorf's Alpha and at least 90% using simple percent agreement. As the variable for tone is coded as ordinal, the model is estimated using an ordered probit. The article is the unit of analysis, and standard errors are clustered by candidate.
Foregrounding of Candidate Gender
References indicating the foregrounding of candidate gender are coded as 0 (not present) or 1 (present). I do not attempt to capture the foregrounding of maleness—only female status. Therefore, comparisons are made between the foregrounding of gender among minority and white women. Indicators of explicit foregrounding of gender include reference to a candidate's gender as well as that of supporters and gendered comparisons with other candidates. The dependent variable is binary; therefore, the model is estimated using probit regression. The article is the unit of analysis, and standard errors are clustered by candidate.
For all models, minority women are the baseline category, placing them at the center of the analysis and allowing for comparisons with all other racial, gendered groups. For the tone of coverage, in addition to ordered probit coefficients, predicted probabilities for each point on the tone scale are reported by candidate race and gender, in order to show the likelihood of negative, neutral, and positive coverage for each group, controlling for other factors. For the frequency of coverage, coefficients are reported in addition to marginal change in the dependent variable given a fixed change in the independent variable from its minimum to its maximum value, holding all other variables constant at their means. This provides a comparison of the average difference in the number of articles or name mentions, controlling for the candidate, campaign, and media factors discussed below.
CONTROL VARIABLES
Control variables relate to the candidate, the campaign, and media factors, drawing on Gershon's (Reference Gershon2012) design. While variation in candidate attributes and therefore sample bias are addressed by the matching strategy, the following independent variables are employed as further controls in the model.
Candidate
Challengers tend to receive less coverage than incumbents, and longstanding incumbents may also receive more coverage than less established peers. Therefore incumbency is measured as a binary: 0 (challenger) or 1 (incumbent). Similarly, while the sampling frame is limited to candidates who captured at least 40% of the general election vote, variation remains between losers and winning candidates who are likely to be more viable and therefore receive more coverage. The winner is included in the model as 0 (lost) or 1 (won).
The gendered identity of longstanding members may also become less salient over time, making explicit gender foregrounding less likely. Seniority is measured as the number of previous terms served: 0 for challengers, +1 for each previous term up to 10 terms, with a truncated scale applied to a minority of candidates who had served more than 10 terms.
The incumbent majority party may receive both more coverage and more criticism. In addition, the foregrounding of race and gender may be more likely for female and/or minority Republican candidates due to their scarcity. Therefore partisan affiliation is coded as 0 (Republican) or 1 (Democrat).
Campaign
The greater the competitiveness of a campaign, the greater the expected frequency of coverage, and the more negative the expected tone of coverage (Kahn and Kenney Reference Kahn and Kenney1999; Vinson Reference Vinson2003, both cited in Gershon, 2012a). In more competitive races, the foregrounding of gender may be increased by the campaign tactics of opponents, or by candidates themselves, resulting in increased likelihood of this frame. The competitiveness of each is measured as a binary: 0 (solid or likely) or 1 (lean or toss-up using Cook's Political Report rankings for the start of the coverage period.
District demographics may also impact the amount and content of coverage that candidates receive, particularly for viable minority candidates running in majority white districts. Because district demographics are so highly correlated with racial identity (three-quarters of the white candidates in the sample ran in majority white districts while three-quarters of the minority candidates in the sample ran in majority minority districts), a binary variable is included—not for whether the district is majority minority or majority white, but for whether the candidate is in the racial majority of the district. Racial majority is coded 0 for white candidates in majority white districts and minority candidates in a majority minority districts, and 1 for white candidates in majority minority districts and minority candidates in majority white districts.
Media
Lawless and Hayes (Reference Lawless and Hayes2014) have shown that larger circulation decreases the frequency of overall coverage, as larger papers covering more than one district or constituency are likely to devote less coverage to individual members. Circulation is measured as a continuous variable.
FINDINGS
Frequency of Coverage
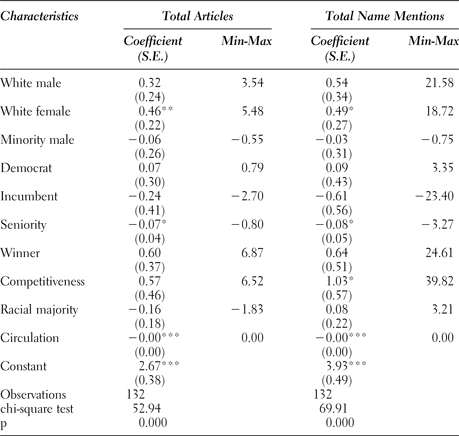
The initial descriptive statistics appear to support the hypothesis that women of color receive less coverage than all other groups: the sample of minority women appeared in only 354 articles, compared to 393 covering minority men, 481 covering white men, and 526 covering white women. Yet, as Table 2 shows, when additional candidate, campaign, and media factors are controlled for within the negative binomial model, the coefficients for minority and white men indicate that differences between these groups and the minority female baseline category are not statistically significant. However, the positive and significant coefficients for white women in both models indicate that this group does receive significantly more coverage than their minority female counterparts. The marginal effects show that, on average, white women appear in 15 articles and receive 49 name mentions over the campaign period, compared to only 10 articles and 30 name mentions for minority women, holding all other variables constant. So while the hypothesis that minority women will receive less coverage than all other groups is not fully supported, the results do point to a significant intersectional difference among comparable white and minority women.
Negative binomial regressions: Frequency of coverage

Robust standard errors in parentheses.
***p < 0.01, **p < 0.05, *p < 0.1.
It is important to note the substantial variation within groups as well as the overall trends across them. Four women of color received no coverage at all,Footnote 9 while Jaime Herrera Beutler and Gloria Bromell Tinubu received 144 and 162 name mentions, respectively. The increasing diversity among minority female candidates and the races in which they compete is reflected in the exceptionally high levels of coverage afforded to those running in majority white districts. However, although this was the case for Herrera Butler and Bromell Tinubu, their visibility was also likely partially due to the competitiveness of their races and their local newspapers’ exceptionally small circulation sizes.Footnote 10 Mia Love, who also ran in a majority white district topped the list with 196 name mentions.Footnote 11 Yet several other factors also contributed to her newsworthiness: her status as an intersectional partisan first; her Mormon religion; the nationalization of her race, which was evidenced by numerous interventions and endorsements by the party leadership as well as her invitation to address the 2012 Republican National Convention.Footnote 12 Therefore, while the results show important differences in the visibility afforded to minority and white women, just as there is increasingly no “typical” minority female candidate, there is also limited consistency in the quantity of coverage minority women receive.
Tone of Coverage
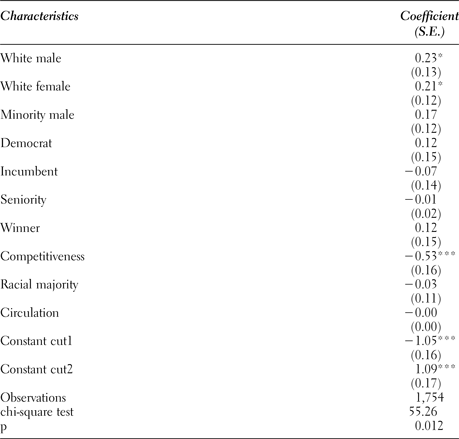
The positive and significant coefficients for white women and men in Table 3 indicate that, compared to minority women, both groups receive coverage that is more positive on average, holding all other variables constant. Therefore, the results partially support the hypothesis that coverage of minority women is less positive than for all other groups.
Ordered probit regression: Tone of coverage

Robust standard errors in parentheses.
***p < 0.01, **p < 0.05, *p < 0.1.
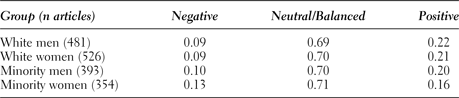
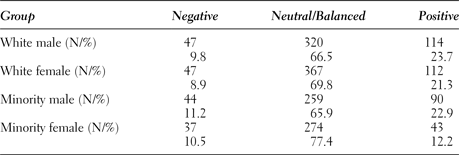
The predicted probabilities for each point on the overall tone scale shown in Table 4 illustrate this further. Controlling for other factors, the likelihood of negative coverage is highest for minority women at .13 (or 13 of every 100 articles), compared to between .09 (or 9 of every 100 articles) for white women and men. Likewise, only 16 of every 100 articles are predicted to be positive for minority women, compared to 21 and 22 for white women and men, holding all other variables constant. While these differences may initially seem small, it is important to consider that they are exacerbated by the fact that minority women also receive significantly less coverage than white women. Descriptively, the 33 minority women in the sample were covered positively in only 43 articles, compared to 112 positive articles featuring the same number of comparable white women. Furthermore, although the coefficient for minority men in the model is nonsignificant, the descriptive statistics also show that they were covered positively in twice as many articles (n = 90, see Table 5) as minority women. Thus, the results indicate that while racial or gendered gaps in the tone of coverage may be waning for minority men and white women compared to white men, the intersectional effects of race and gender continue to result in remarkably negative representations of minority women seeking election.
Predicted probabilities for tone of coverage by intersectional identity

Tone of coverage by intersectional identity

X 2(6, N = 1754) = 21.52, p = 0.001.
While these findings provide support for H 3 and indicate systemic intersectional differences in the tone of election coverage, it is again important not to understate the variation in tone of coverage among minority women, partly due to variation in other politically relevant characteristics. Republican Mia Love again proved to be an outlier, receiving exceptionally negative coverage (24% of all articles).Footnote 13 This reflected debates over whether her intersectional identity was congruent or in conflict with her conservative values. Campaign factors are also significant. For example, in a highly competitive race such as Gloria Bromell Tinubu's, it is unsurprising that the candidates drew substantial criticism from one another as well as complaints of negative campaigning from their local newspaper. This resulted in highly polarized coverage: only 62% of articles covering Brommell Tinubu were coded as neutral or mixed. The negative coverage Brommell Tunubu received may also be attributed to her position as a Democrat running in a highly Republican district. However, the narrative framing of her campaign was extremely personalized and arguably corresponds with the negative stereotype of the “angry black woman,” as identified by Hill Collins (Reference Hill Collins1990) and others. The Myrtle Beach Sun News viewed her behavior as “belligerent” and argued that this outweighed the benefits of her “economist background,” instead supporting a white male competitor (Republican Tom Rice) whom they believed to possess a “calmer temperament.” Thus the publication represented the acrimonious contest as the “true personality” or nature of an irrational angry black woman.Footnote 14
Intersectional differences were also observed in the tone of coverage among minority women of different ethnicities. The small sample size allows only for descriptive analysis, but this shows that among Latinas and African American women, 12% and 10% of articles were negative, whereas among Asian American women, only 8% of articles were negative. However, Latinas’ and African American women's coverage was also more likely to be positive, at 11% and 15% of articles, respectively, while only 8% of coverage of Asian American women was positive. Therefore, representations of Latinas and African American women appear to be more polarized than their Asian American female counterparts.Footnote 15
Foregrounding of Gender
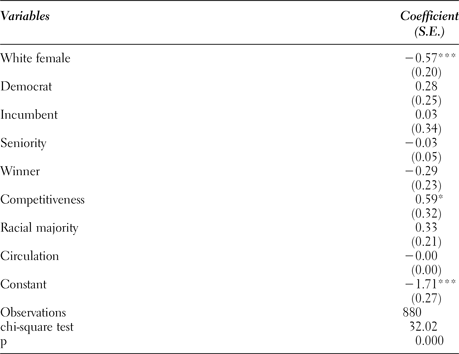
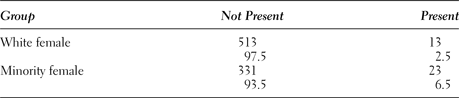
The negative and significant coefficient for white women in Table 6, above, indicates that candidates from this group are less likely to have their gender foregrounded than minority women, controlling for other relevant factors. While holding all other variables constant at their means, the predicted probability of gender foregrounding for white women is only .02, or 2 of every 100 articles. For minority women the likelihood is .07, or or 7 of every 100 articles, on average. The results, therefore, support the third hypothesis. Though statistically significant, these findings do not imply great substantive impact when presented in such terms. However, when considered together with the amount of coverage each group receives, it becomes clear that variation in this aspect of coverage is stark. White women appeared in 513 articles that did not explicitly foreground their gender, compared to 331 for minority women (see Table 7, above).
Probit regression: Gender foregrounding

Robust standard errors in parentheses.
***p < 0.01, **p < 0.05, *p < 0.1.
Gender foregrounding among minority and white women

X 2(1, N = 880) = 8.74, p = 0.003.
Given their status as intersectional firsts, it is unsurprising that Mia Love and Tulsi Gabbard were among those minority women whose gender was most often mentioned. However, coverage of Colleen Hanabusa (D-HI 1st District) was also particularly likely to employ an explicitly gendered frame —for example, citing her status as “the first woman to serve as state Senate president” and commenting that her campaign enjoyed “energetic support from women and union households.”Footnote 16 References to minority women's gender emanate both from editorial frames and candidates themselves. For example, The Cleveland Plain Dealer states, “It's worth pointing out that, under new maps, Ohio voters could elect two black women to Congress,”Footnote 17 while Congresswoman Nydia Velázquez (D-NY 7th District) is cited in her local paper saying, “I want to remove more barriers so that Latinas nationwide can achieve their dreams.”Footnote 18
Although many explicit references to minority women's gender were ostensibly positive, there were cases where women of color were assumed to fulfil expectations of gendered substantive or symbolic representation. It is beyond the scope of this study to investigate the degree to which minority female candidates articulated these goals themselves and, therefore, to what degree this is informed by candidates’ own language and presentation rather than media inclinations. However, there does seem to be conflict between the journalistic imperative to deploy intersectional identity as a novel hook and the incentives of minority female candidates in majority white districts to play down race and/or gender. For example, reporters frequently described Mia Love's campaign as a “hope,” “effort,” “bid,” or “challenge” to become the first black Republican woman in Congress, despite the candidate herself stating, “The only history I'm interested in making is getting our country on track.”Footnote 19 Meanwhile, local press cited a member of the Utah electorate arguing, “A Mia Love world would be bad for women, worse for children and, as a result, it undermines all of our futures. I can't imagine why any woman would vote for her.”Footnote 20 In the case of Gloria Bromell Tinubu, her identity as a black woman is both explicitly foregrounded and implicitly posited as at odds with a “politically moderate district” and “middle of the road” voters.Footnote 21 Thus, the content of explicitly gendered frames applied to minority women also indicates that their identity continues to be the site of intersectional assumptions and expectations regarding the representational possibilities that their candidacies may, or may not, engender.
DISCUSSION AND CONCLUSION
These results indicate that minority women running for office face a clear disadvantage in terms of securing positive campaign coverage compared to similar candidates from all other racial, gendered groups. In addition, significant intersectional differences in press treatment of minority and white women also emerge: minority women garner less visibility than their white female counterparts, and the coverage that they do receive is significantly more likely to focus on their gender.
While this study is confined to the 2012 general election, the results support similar findings regarding patterns of coverage of incumbent Latina and black congresswomen at the 2006 midterms (Gershon Reference Gershon2012). Thus, although research increasingly suggests that unfavorable gendered patterns of campaign coverage may be diminishing for female candidates in the aggregate, there is growing evidence that minority women continue to face compounded disadvantages in this respect due to their multiple subordinated racial and gendered identities. This highlights the importance of intersectional approaches. If greater equity in campaign coverage extends primarily to white women and minority men, research that employs a single-axis lens focusing only on gender or race risks marginalizing the experiences of women of color in this context.
Furthermore, the uneven distribution of characteristics such as incumbency, seniority, and partisan affiliation among candidates of certain ethnicities and/or gender is likely to generate substantial effects on minority women's coverage compared to typical minority male and white male and female candidates. Until minority women receive parity in descriptive representation, and, for example, greater presence in political leadership roles within the House and elsewhere, many will experience even greater disadvantages than illustrated here when compared to a matched sample of similar candidates. Baitinger (Reference Baitinger2015) attributes congresswomen's underrepresentation in television news to their underrepresentation in political professions. For all but a few female representatives of color, this effect is likely to be exaggerated by their relative scarcity at the highest levels of political office.
It is also important to note that there is substantial heterogeneity in minority women's treatment by the press. An individual such as Mia Love, who is made exceptionally anomalous by virtue of her intersectional identity and Republican affiliation, garners far greater attention than a “typical” minority woman running for office. However, an individual such as Love is also subject to enhanced scrutiny and interrogation of her identity and its relationship to her politics. The visibility afforded to selected individuals is often a double-edged sword. Although this dynamic applies to politicians of all identities, it may be especially troublesome for minority women, given that the frequent explicit focus on their gender means they are often framed as representatives of their intersectional group. Meanwhile, others within that group struggle to receive recognition.
Systemic differences in coverage resulting from the effects of candidates’ intersectional identities are cause for concern. However, further qualitative analysis is necessary to unravel the complex narratives and responses to women of color seeking or holding positions of political power, especially those who go against the grain of assumptions regarding what a “typical” minority woman in politics represents or what kinds of substantive representation she is expected to engender. Further qualitative analyses are also necessary to better understand the content and effects of varying characterizations applied to minority women of different ethnicities. For example, the comparatively neutral coverage of Asian American women observed here suggests that this group may receive less polarized or overtly scrutinizing coverage than their Latina and black female counterparts.
Research that centers the experiences of minority women in elite politics is no longer prohibited by a “small-n” problem. The 2014 congressional elections saw a net increase of 10 minority women elected to the House, raising their number from 23 to 33, as well as the election of Mazie Hirono (D-HI) to the Senate (CAWP 2015). Single-axis considerations of the impact of candidate identity on campaign coverage—or indeed many other aspects of political behavior and representation—are neither necessary nor sufficient. Rising numbers of minority women elected to Congress and the increasing diversity within this group provide promising opportunities for scholars to better understand the intersectional dynamics at play in these various contexts.