Introduction
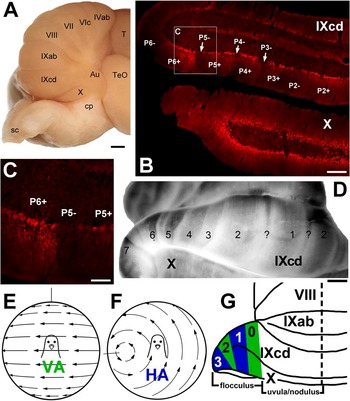
The fundamental organization of the cerebellum is built upon “zones” that lie in the sagittal plane, perpendicular to the transverse lobules of the cerebellar cortex (e.g., Voogd & Bigaré, Reference Voogd, Bigaré, Courville, de Montigny and Lamarre1980). Such sagittal zones are apparent in the distribution of climbing fiber (CF) and mossy fiber afferents, Purkinje cell (PC) projection patterns, and PC response properties (Voogd, Reference Voogd1967; Voogd et al., Reference Voogd, Broere and van Rossum1969; Ekerot & Larson, Reference Ekerot and Larson1973; Andersson & Oscarsson, Reference Andersson and Oscarsson1978; Llinas & Sasaki, Reference Llinas and Sasaki1989; De Zeeuw et al., Reference De Zeeuw, Wylie, DiGiorgi and Simpson1994; Voogd & Glickstein, Reference Voogd and Glickstein1998; Wu et al., Reference Wu, Sugihara and Shinoda1999; Ruigrok, Reference Ruigrok2003; Apps & Garwicz, Reference Apps and Garwicz2005). Moreover, several molecular markers that are expressed heterogeneously in the cerebellum show a parasagittal distribution (for reviews, see Hawkes & Gravel, Reference Hawkes and Gravel1991; Herrup & Kuemerle, Reference Herrup and Kuemerle1997). The most thoroughly studied of these is zebrin II (ZII) (a.k.a. aldolase C; Brochu et al., Reference Brochu, Maler and Hawkes1990; Ahn et al., Reference Ahn, Dziennis, Hawkes and Herrup1994; Hawkes & Herrup, Reference Hawkes and Herrup1995), which is expressed by PCs. ZII immunopositive (ZII+) PCs are distributed as a parasagittal array of stripes, separated by ZII immunonegative (ZII−) stripes (see Fig. 1B–1D; e.g., Sillitoe et al. Reference Sillitoe, Marzban, Larouche, Zahedi, Affanni and Hawkes2005; Larouche & Hawkes Reference Larouche and Hawkes2006). The spatial pattern and number of ZII stripes in different areas of the cerebellum are remarkably similar in birds and mammals (Pakan et al., Reference Pakan, Iwaniuk, Wylie, Hawkes and Marzban2007; Iwaniuk et al., Reference Iwaniuk, Marzban, Pakan, Watanabe, Hawkes and Wylie2009; Marzban et al., Reference Marzban, Chung, Pezhouh, Feirabend, Watanabe, Voogd and Hawkes2010). That is, the pattern of ZII heterogeneity is highly conserved and is likely critical for fundamental cerebellar function.
(A) A ventrolateral view of the pigeon cerebellum. (B–D) Cerebella immunoreacted for ZII. (B) A coronal section through folia IXcd and X. The ZII+ stripes are numbered 1–7 (medial to lateral) from the midline. The +/− ZII pairs from P2+ to P6− are indicated in IXcd. In X, there are no stripes as all PCs are ZII+. (C) A higher magnification of P5−/P6+. (D) A cerebellar wholemount (ventroposterolateral view) processed for ZII illustrating the sagittal stripes in folium IXcd. The “?” indicates a satellite stripe only one to three PCs in width that was seen in the middle of the P1− stripe. (E) and (F) The patterns of optic flow that maximally excite the CSA of VA and HA PCs in the left flocculus. (G) A schematic of how the VA and HA PCs are organized in the flocculus. Zones 0 and 2 contain VA neurons, whereas zones 1 and 3 contain HA neurons. Scale bars: 1 mm in (A) and (D); 250 μm in (B); 100 μm in (C). Au = auricle, T = telencephalon, TeO = optic tectum, cp = cerebellar peduncle, sc = spinal cord.

Studies have attempted to show how the ZII stripes are related to other aspects of the parasagittal cerebellar organization, including the zonal distribution of CF and MF inputs and physiological response properties (Gravel & Hawkes, Reference Gravel and Hawkes1990; Hawkes & Gravel, Reference Hawkes and Gravel1991; Matsushita et al., Reference Matsushita, Ragnarson and Grant1991; Akintunde & Eisenman, Reference Akintunde and Eisenman1994; Chockkan & Hawkes, Reference Chockkan and Hawkes1994; Ji & Hawkes, Reference Ji and Hawkes1994; Nagao et al., Reference Nagao, Kitazawa, Osanai and Hiramatsu1997; Voogd et al., Reference Voogd, Pardoe, Ruigrok and Apps2003; Sugihara & Shinoda, Reference Sugihara and Shinoda2004, Reference Sugihara and Shinoda2007; Voogd & Ruigrok, Reference Voogd and Ruigrok2004; Wadiche & Jahr, Reference Wadiche and Jahr2005; Gao et al., Reference Gao, Chen, Reinert and Ebner2006; Pijpers et al., Reference Pijpers, Apps, Pardoe, Voogd and Ruigrok2006; Sugihara et al., Reference Sugihara, Marshall and Lang2007; Sugihara & Quy, Reference Sugihara and Quy2007; Pakan & Wylie, Reference Pakan and Wylie2008; Ruigrok et al., Reference Ruigrok, Pijpers, Goedknegt-Sabel and Coulon2008; Mostofi et al., Reference Mostofi, Holtzman, Grout, Yeo and Edgley2010; Pakan et al., Reference Pakan, Graham and Wylie2010; Paukert et al., Reference Paukert, Huang, Tanaka, Rothstein and Bergles2010) . Although these studies have provided clues as to the functional significance of ZII stripes, a comprehensive picture has yet to emerge. With respect to CF input, studies in rodents have emphasized that an olivary subnucleus projects to ZII stripes of a particular sign, either a positive or a negative, but not both (Gravel et al., Reference Gravel, Eisenman, Sasseville and Hawkes1987; Voogd et al., Reference Voogd, Pardoe, Ruigrok and Apps2003; Sugihara & Shinoda, Reference Sugihara and Shinoda2004; Voogd & Ruigrok, Reference Voogd and Ruigrok2004; Apps & Garwicz, Reference Apps and Garwicz2005; Pijpers et al., Reference Pijpers, Apps, Pardoe, Voogd and Ruigrok2006; Sugihara & Quy, Reference Sugihara and Quy2007; Ruigrok et al., Reference Ruigrok, Pijpers, Goedknegt-Sabel and Coulon2008). These studies also suggested that the ZII− and ZII+ stripes may process information from different sensory systems (Voogd et al., Reference Voogd, Pardoe, Ruigrok and Apps2003; Sugihara & Shinoda, Reference Sugihara and Shinoda2004).
The flocculus of the pigeon cerebellum is ideal for studying the relationship between ZII stripes, connectivity, and the response properties of PCs. The flocculus integrates optokinetic and vestibular information to generate compensatory eye movements (e.g., Waespe & Henn, Reference Waespe and Henn1987). In pigeons, the flocculus is the lateral half of folia IXcd and X, which comprise the vestibulocerebellum (see Fig. 1A; Wylie et al., Reference Wylie, Kripalani and Frost1993). The functional zonal organization of the flocculus has been extensively documented and is essentially identical in mammals and birds (Voogd & Wylie, Reference Voogd and Wylie2004). The complex spike activity (CSA) of floccular PCs responds best to patterns of optic flow that result from self-rotation about one of two axes: either the vertical axis (VA cells; Fig. 1E), or the horizontal axis oriented at 45 deg azimuth (HA cells; Fig. 1B; Simpson et al., Reference Simpson, Graf and Leonard1981; Graf et al., Reference Graf, Simpson and Leonard1988; Wylie & Frost, Reference Wylie and Frost1993). In several species, it has been shown that the VA and HA cells are organized into parasagittal zones, such that multiple VA zones are interdigitated with multiple HA zones (Voogd & Wylie, Reference Voogd and Wylie2004). In pigeons, two VA zones (0 and 2) are interdigitated with two HA zones (1 and 3) (see Fig. 1G). Recently, we have shown that ZII is expressed heterogeneously in IXcd as an array of seven ZII+/− stripes (Fig. 1B–1D; Pakan et al., Reference Pakan, Iwaniuk, Wylie, Hawkes and Marzban2007). Previously, we have shown that how the ZII stripes are related to CF and MF inputs (Pakan & Wylie, Reference Pakan and Wylie2008; Pakan et al., Reference Pakan, Graham and Wylie2010).
With respect to CF input to ZII stripes in the pigeon flocculus, we (Pakan & Wylie, Reference Pakan and Wylie2008) revealed an organization very different from that suggested by the rodent studies mentioned above. The VA and HA zones in the pigeon flocculus receive CF input from the caudal and rostral margins of the medial column of the inferior olive (mcIO), respectively. Injection of anterograde tracer in the caudal mcIO resulted in CFs in ZII stripes, P4+/− and P6+/−, whereas rostral mcIO injections resulted in CFs in P5+/− and P7+/−. This suggests that ZII stripes P4+/− and P6+/− correspond to the VA zones 0 and 2, whereas the HA zones correspond to P5+/− and P7+/− stripes. Therefore, whereas in the rodent studies, an olivary subnucleus was associated with either ZII+ or ZII− stripe(s) but not both; in the pigeon flocculus, the CF projection encompassed pairs of ZII+/− stripes. Also, both the ZII+ and ZII− stripes in the pigeon flocculus appear to receive CFs carrying visual information.
Because these data from the pigeon flocculus are so unique, and contrary to what has been shown in rodents, it is necessary to confirm them with a technique that can address the possible shortcomings of the study by Pakan and Wylie (Reference Pakan and Wylie2008). With the injections of tracer in the mcIO, it is possible that spread of the injection or uptake by fibers of passage contaminated our findings. One could also argue that it is possible that visual neurons are not the only functional type found in the subnuclei of the mcIO and that the visual neurons project to either the ZII+ or the ZII− stripes, whereas a separate functional class of neurons project to the stripes of the opposite sign. To address these possibilities, in this study, we recorded the CSA of floccular PCs, which reflects CF input (Eccles et al., Reference Eccles, Llinas and Sasaki1966), marked the locations of the VA and HA zones, and visualized the ZII expression pattern in the flocculus using immunohistochemical techniques. We found that a functional zone defined by CSA in response to visual stimuli spanned a ZII+/− pair.
Materials and methods
Surgery and electrophysiological recording procedures
The methods reported herein conformed to the guidelines established by the Canadian Council on Animal Care and were approved by the Biosciences Animal Care and Policy Committee at the University of Alberta. Silver King and Homing pigeons (Columba livia) were anesthetized by an intramuscular injection of a ketamine (65 mg/kg)/xylazine (8 mg/kg) cocktail. Supplemental doses were administered as necessary. Animals were placed in a stereotaxic device with pigeon ear bars and a beak bar adapter so that the orientation of the skull conformed to the atlas of Karten and Hodos (Reference Karten and Hodos1967). The left flocculus was accessed by removing the bone surrounding the semicircular canals, as the dorsal surface of the flocculus [folium IXcd and the auricle (Au)] lies within the radius of the anterior semicircular canal. This exposure allows easy access to the dorsal surface of folium IXcd, including the VA zones (zones 0 and 2) and the HA zones (zones 1 and 3) (see Fig. 5A for flocculus exposure). Extracellular single-unit recordings were then made using glass micropipettes filled with 2 m NaCl (tip diameters of 3–5 μm). Electrodes were advanced using a hydraulic microdrive (Frederick Haer & Co. Bowdoin, ME), and raw signals were amplified, filtered, and fed to a data analysis system [Cambridge Electronic Designs (CED) 1401plus, Cambridge England]. Using Spike2 (CED), spikes were sorted and peristimulus time histograms were constructed.
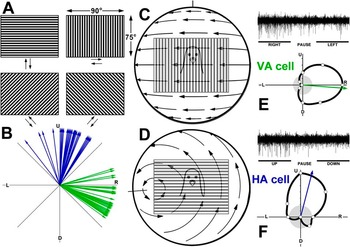
The CSA of PCs was recorded from the molecular layer and identified based on their characteristic spontaneous firing rate of about 1 spike/s. Isolated units were first stimulated with a large handheld stimulus, which consisted of visual noise, to determine if the cell was sensitive to visual stimulation. By moving this stimulus in different areas of the panoramic binocular visual field, the optic flow preference of each unit was qualitatively determined. The visual test stimuli were then back projected onto a screen measuring 90 × 75 deg (width × height) that was positioned in the frontal visual field (from 45 deg ipsilateral to 45 deg contralateral azimuth) (see Fig. 2C and 2D). The stimuli consisted of drifting square wave gratings of an effective spatial and temporal frequency (0.5 cycles per deg, 0.5 Hz), generated by a VSGThree (Cambridge Research Systems, Rochester, England). Direction tuning was established by measuring the responses to motion in eight directions, 45 deg apart (see Fig. 2A). Responses were averaged over at least three sweeps, where each sweep consisted of 4 s of motion in one direction, a 3 s pause, and 4 s of motion in the opposite direction, followed by a 5 s pause (see Fig. 2E and 2F). Using SigmaPlot, direction tuning curves were plotted, and a preferred direction for each unit was determined by calculating the peak of the best-fit cosine to the tuning curve (see Fig. 2E and 2F). A modulation index (MI) was also calculated for each unit: MI = (maximum response − minimum response)/(maximum response + minimum response). Thus, if the maximum response was twice that of the minimum response, MI = 0.33.
CSA of PCs in response to optokinetic stimuli. (A) Directional tuning of CSA was recorded in response to drifting gratings, which measured 90 deg wide × 75 deg high. Responses to motion in eight directions, 45 deg intervals, were obtained. (C) and (D) The patterns of optic flow from the natural environment that would maximally stimulate CSA of VA and HA PCs in the left flocculus. The approximate position of the whole-field stimulus that we used for directional tuning is superimposed on the optic flow patterns in the frontal field. The directional tuning of individual VA and HA neurons are shown in (E) and (F), respectively. The tuning curves plot the firing rate as a function of direction of motion in polar coordinates. The gray circles represent the spontaneous rates, and the arrows indicate the peak of the best-fit cosine to the tuning curve. The peristimulus time histograms show the responses of a VA neuron to a single sweep of horizontal motion (E, top) and a HA neuron to a sweep of vertical motion (F, top). Each sweep consisted of 4 s of motion in one direction, followed by a 3 s pause, then 4 s of motion in the opposite direction. The distribution of the preferred directions of all VA and HA neurons are shown in (B). U, D, R, and L = upward, downward, rightward, and leftward motion.

These procedures do not truly provide the information on the preferred axes of rotation of the HA and VA neurons [as did Graf et al. (Reference Graf, Simpson and Leonard1988) and Wylie and Frost (Reference Wylie and Frost1993) with stimuli generated by a planetarium projector] but rather the preferred directions to motion in the frontal region of the visual field. However, this does allow for a definitive distinction of HA and VA neurons: VA neurons show maximum excitation/inhibition to rightward/leftward motion and little modulation to vertical motion, whereas HA neurons show maximum excitation/inhibition to upward/downward motion and little modulation to horizontal motion. It has been shown in rabbits (Kano et al., Reference Kano, Kano and Maekawa1990) and repeatedly in pigeons (Wylie et al., Reference Wylie, Kripalani and Frost1993, Reference Wylie, Brown, Barkley, Winship, Crowder and Todd2003; Winship & Wylie, Reference Winship and Wylie2001, Reference Winship and Wylie2003) that these procedures are effective in quantifying and distinguishing VA and HA neurons.
Several electrode penetrations were made to map out the locations of the VA and HA zones on the exposed surface of the flocculus (e.g., as illustrated in Fig. 5A). In order to mark some of the recording sites, and thus reconstruct the recording locations, we made injections of red and green fluorescent tracers at as many as four locations in the flocculus from which we had recorded CSA to visual stimuli. (Note that the tracers were only used as fluorescent dyes to mark the recording sites rather than tracers to examine projections; see footnote belowFootnote 1.)
For accurate placement of the injection electrodes and reconstruction of the electrode tracts, we relied on stereotaxic coordinates and photographs of each electrode placement (e.g., Fig. 5A). The injection electrodes were micropipettes (tip diameter 20–30 μm) containing 10% biotinylated dextran amine [BDA: either miniruby D-3312 (red) or miniemerald D-7178 (green); 10,000 molecular weight; Invitrogen, Carlsbad, CA], 1% cholera toxin subunit B [CTB: either CTB-AlexaFluor 488 (green) or 594 (red) conjugate; Molecular Probes, Eugene, OR], or fluorescent latex microspheres (referred to as Lumafluor; Lumafluor Corp, Naples, FL). For the BDA and Lumafluor, 0.01–0.05 μl was pressure injected using a Picospritzer II (General Valve Corporation, Fairfield, NJ) at the site of recording. CTB was iontophoresed for 5–10 min (+4 μA, 7 s on, 7 s off). The advantage of using CTB was that we could record with the injecting electrode to confirm the response type as VA or HA and the injections tended to be smaller. Lumafluor was only used in our initial three experiments and not subsequent experiments because the injections were larger than desired.
At the end of the experimentsFootnote 1, the pigeons were deeply anesthetized with sodium pentobarbital (100 mg/kg) and immediately transcardially perfused with phosphate-buffered saline (PBS; 0.9% NaCl, 0.1 m phosphate buffer) followed by 4% paraformaldehyde in 0.1 m PBS (pH 7.4). The brain was extracted from the skull and immersed in paraformaldehyde for 7 days at 4°C. The brain was then embedded in gelatin and cryoprotected in 30% sucrose in 0.1 m PBS overnight. Using a microtome, frozen serial sections through the cerebellum in the coronal plane were cut (40 μm thick) and collated into two series.
Immunohistochemistry
ZII expression was visualized using established immunohistochemical techniques described previously (Pakan et al., Reference Pakan, Iwaniuk, Wylie, Hawkes and Marzban2007). Briefly, tissue sections were rinsed thoroughly in 0.1 m PBS and blocked with 10% normal donkey serum (Jackson Immunoresearch Laboratories, West Grove, PA) and 0.4% Triton X-100 in PBS for 1 h. Tissue was then incubated in PBS containing 0.1% Triton X-100 and the primary antibody, mouse monoclonal anti-ZII (kindly provided by Richard Hawkes, University of Calgary; Brochu et al., Reference Brochu, Maler and Hawkes1990) for 60–75 h at room temperature.
Sections were then rinsed in PBS and were incubated in a fluorescent secondary antibody. Because recording sites were marked with injections of green and red tracer in the same animal, alternate series were visualized with Cy3 (red-) or Cy2 (green-) conjugated donkey anti-mouse antibody (Jackson Immunoresearch Laboratories: diluted 1:100 in PBS, 2.5% normal donkey serum, and 0.4% Triton X-100) for 2 h at room temperature. The tissue was then rinsed in PBS and mounted onto gelatinized slides for viewing.
Statistical analysis
The recorded HA and VA units were localized to particular ZII stripes. To see if there were any differences in the MI or preferred directions of VA and HA cells in the different stripes, we performed one-way analysis of variances (ANOVAs) with the data grouped according to ZII stripe.
Microscopy and image analysis
Sections were viewed with a compound light microscope (Leica DMRE, Wetzlar, Germany) equipped with the appropriate fluorescence filters (rhodamine and FITC). Images were acquired using a Retiga EXi FAST cooled mono 12-bit camera (Qimaging, Burnaby, BC) and analyzed with Openlab imaging software (Improvision, Lexington, MA). Adobe Photoshop was used to compensate for brightness and contrast.
Nomenclature of the pigeon flocculus
As in mammals, the cerebellum in birds is highly foliated but is restricted to a vermis without hemispheres (see Fig. 1A). Folia IXcd (uvula) and X (nodulus) comprise the vestibulocerebellum and merge rostrolaterally to form the Au (Fig. 1A). The flocculus, defined as the area containing VA and HA responses, is localized in the lateral half of the vestibulocerebellum (Wylie et al., Reference Wylie, Kripalani and Frost1993). The numbering of the floccular zones, 0–3 as shown in Fig. 1G, follows that used for rats and rabbits (Voogd & Wylie, Reference Voogd and Wylie2004).
Results
Electrophysiological recording of visual response properties
The data we report are based on experiments in 12 pigeons. The CSA at 68 sites in the left flocculus was recorded and localized. All cells showed significant directional tuning, and the neurons were identified as either VA (n = 35) or HA neurons (n = 33), with the VA neurons responding best to rightward motion in the frontal field, and the HA neurons responding best to upward motion in the frontal field. The response properties of HA and VA neurons in rabbits and pigeons to large-field visual stimuli have been discussed in detail in previous reports (Graf et al., Reference Graf, Simpson and Leonard1988; Kano et al., Reference Kano, Kano and Maekawa1990; Wylie & Frost, Reference Wylie and Frost1993; Wylie et al., Reference Wylie, Kripalani and Frost1993). Representative direction tuning curves of VA and HA neurons are shown in Figs. 2E and 2F and 4A. Of the 68 recording sites, 11 of these were in folium X, and 57 were in IXcd (30 VA, 27 HA). The distributions of the preferred directions of the VA and HA neurons are shown in Fig. 2B. The average MI was 0.53 ± 0.024 (mean ± s.e.m.).
ZII immunohistochemistry
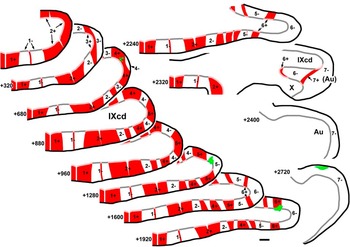
After ZII expression was visualized in the coronal sections throughout the cerebellum, using immunohistochemical techniques, the locations of the 57 recording sites in IXcd could be assigned to a particular ZII stripe. In the cerebella of all animals, we observed the expected pattern of ZII immunoreactivity in folium IXcd (Figs. 3–5) consisting of seven ZII+/− stripes. We used the nomenclature from Pakan et al. (Reference Pakan, Iwaniuk, Wylie, Hawkes and Marzban2007), whereby the most medial positive stripe is designated as P1+ (or simply 1+) and the number increases as the stripes move laterally to P7+ (see Fig. 4D and 4E; Brochu et al., Reference Brochu, Maler and Hawkes1990; Eisenman & Hawkes, Reference Eisenman and Hawkes1993; Ozol et al., Reference Ozol, Hayden, Oberdick and Hawkes1999; Sillitoe & Hawkes, Reference Sillitoe and Hawkes2002; reviewed in Sillitoe et al., Reference Sillitoe, Marzban, Larouche, Zahedi, Affanni and Hawkes2005). The width of individual stripes can vary both between animals as well as along the rostrocaudal axis of the cerebellum within animals. Therefore, in designating the stripe numbers, it is important to complete an examination of all sections throughout the rostrocaudal extent of the vestibulocerebellum. Nonetheless, the seven ZII+/− stripe pairs were easily identifiable. A reconstruction is offered in Fig. 3. A series of 12 drawings spanning the rostralcaudal extent of folium IXcd are shown. Abutting the midline is a wide ZII+ stripe (P1+) followed by a wide ZII− stripe (P1−). In most cases, in the middle of the P1− stripe, there is a thin ZII+ stripe that is one to three PCs wide (see “?” in Fig. 1D). P2+ is consistently wide throughout the rostral–caudal extent of IXcd, and there was almost always a “notch” about 50 μm wide in the middle that appeared to contain no PCs (Pakan et al., Reference Pakan, Graham and Wylie2010). The P3+/− stripe pair was relatively thin, with the P3− stripe becoming thinner rostrally. The P4− stripe also became thinner rostrally. In P5−, a thin ZII+ stripe, one to two PCs in width, was sometimes seen (see also Fig. 1D). The P6– and P7– were quite a bit wider than their ZII+ counterparts. This was particularly true for the P7+ stripe, which was about 5–10 PCs wide and only seen in a few sections at the caudal end of the Au.
Serial sections through folium IXcd show a reconstruction of the ZII stripes. Sections are arranged caudal (top left) to rostral (bottom right), and the distances (in microns) relative to the caudal-most section are indicated. The ZII+ stripes are shown as red in the molecular layer and pink at the PC layer. Likewise, the ZII− stripes are shown as white/gray. Four injection sites from this case have been pseudocoloured green. From caudal to rostral, the injection sites were red BDA, green BDA, green Lumafluor, and red Lumafluor. Scale bar = 300 μm.

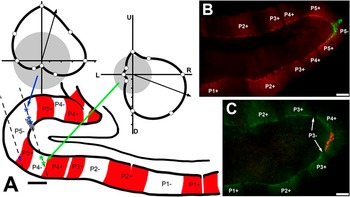
(A) A drawing of a coronal section through folium IXcd is shown with the ZII+ and ZII+ stripes indicated, respectively, by red and white shading in the molecular layer. The two dashed lines indicate two parallel electrode penetrations separated by 300 μm in the mediolateral plane. The blue and green asterisks, respectively, indicate locations where HA and VA neurons were recorded. The shaded gray area in dorsal lamella along the right track indicates an injection site. Representative direction tuning curves are shown for each type of neuron. Firing rate is plotted as a function of direction of motion in polar coordinates. The gray circles represent the spontaneous rates, and the arrows indicate the peak of the best-fit cosine to the tuning curve. (B) and (C) Coronal sections through IXcd that have been immunoreacted for ZII. Both sections contain BDA injection sites. An HA cell was recorded at the injection site in (B) (P5−), and a VA cell was recorded at that in (C) (P4+). Scale bars: = 250 μm in (A); 300 μm in (B, C). U, D, R, and L = upward, downward, rightward, and leftward motion.

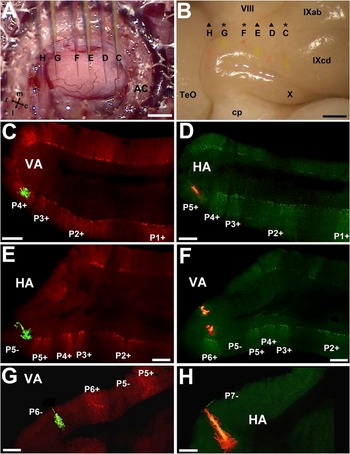
Results from a single experiment are shown. (A) The view of the surface of the exposed flocculus. This is the superimposition of six photos, such that the locations of six injection electrodes (C–H) filled with either red BDA (D, F, H) or green BDA (C, E, G) are shown. (B) The dissected brain. Traces of the six injections can clearly be seen on the surface. VA neurons were recorded at C, F, and G, whereas HA neurons were recorded at D, E, and H. (C–H) Coronal sections through the flocculus that have been immunoreacted for ZII to illustrate the locations of all the injections. Scale bars: 1 mm in (A, B); 300 μm in (C–H). AC = anterior canal; TeO = optic tectum; cp = cerebellar pedencle; m, l, r, and c = medial, lateral, rostral, and caudal.

When the ZII expression pattern was visualized in conjunction with the location of the specific recording sites, the results were unequivocal: VA cells were found in the 4+/− and 6+/−, and HA cells were found in the 5+/− and 7– stripes (Figs. 4 and 5). In Fig. 3, four injection sites are shown in the series of drawings. VA cells were recorded at the injections in the P4+ and P6+ stripes, and HA cells were recorded at the injection sites in the P5− and P7− stripes. In Fig. 4A, a drawing of a coronal section through IXcd is shown, with the ZII+ stripes indicated in red. The locations of six recording sites along two electrode penetrations (dashed lines) separated by 300 μm are shown, and the green and blue asterisks, respectively, indicate sites where HA and VA CSA was recorded. The gray shaded area along the rightmost track indicates a marking injection. Representative tuning curves for HA and VA neurons are shown. At four sites (three in P5− and one in P5+), HA neurons were recorded, and at two sites (both in P4−), VA neurons were recorded. Fig. 4B and 4C shows photomicrographs from a different case. In Fig. 4B, HA CSA was recorded, and an injection of green BDA was found in P5−. In Fig. 4C, red BDA was injected where a VA neuron was recorded, and the injection was found to be in P4+.
Fig. 5 shows data from our most comprehensive case in which six injections of BDA were made. Panel A shows the view of the flocculus through the surgical microscope with the six injection pipettes superimposed. Those marked C, E, and G contained green BDA, whereas the others contained red BDA. When the perfused brain was dissected, the six injections could be clearly seen under a dissecting microscope (B). At sites C, F, and G, VA CSA was recorded, whereas HA neurons were recorded at sites D, E, and H. As shown in the corresponding panels with the ZII expression pattern visualized in coronal sections, VA injections were localized to stripes P4+ (Fig. 5C), P6+ (F), and P6− (G), whereas HA injections were found in P5+ (D), P5− (E), and P7− (H).
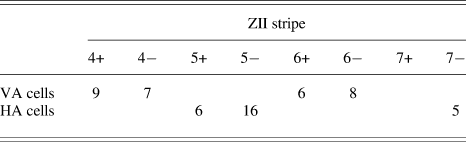
From all 12 cases, the distribution of VA and HA CSA within the ZII stripes is shown in Table 1. Of the 30 VA recordings in IXcd, 9, 7, 6, and 8 cells were localized to ZII stripes P4+, P4−, P6+, and P6−, respectively. Of the 27 HA recordings in IXcd, 6, 16, and 5 were localized to ZII stripes P5+, P5−, and P7−, respectively. Unfortunately, no recordings were obtained from the P7+ ZII stripe, which is not surprising as it is so small.
Distribution of VA and HA neurons in the zebrin stripes of folium IXcd in the pigeon cerebellum

The preferred directions and MIs of VA units were not significantly different for those recorded in the P4+, P4−, P6+, and P6− stripes. Likewise, the preferred directions and MIs of HA units were not significantly different for those recorded in the P5+, P5−, and P7− stripes (one-way ANOVAs, all P > 0.05).
Discussion
Zebrin stripes and the physiological properties of PCs
In the present study, we showed an explicit correlation between the response properties of PCs across a series of ZII+/− stripes in the flocculus. Although it has been known for over 20 years that ZII is expressed in parasagittal stripes (Brochu et al., Reference Brochu, Maler and Hawkes1990), there are few studies that directly address how these stripes relate to zones defined by physiological properties. Sugihara et al. (Reference Sugihara, Marshall and Lang2007) showed that synchronicity of CSA was higher among PCs within a ZII stripe. Although they did not look at the response properties of PCs, Gao et al. (Reference Gao, Chen, Reinert and Ebner2006) found that parallel fiber stimulation results in parasagittal bands of decreases in activity along a folium that correspond to the location of ZII stripes. Most closely related to the present study, Mostofi et al. (Reference Mostofi, Holtzman, Grout, Yeo and Edgley2010), in an eye-blink conditioning paradigm, found that periocular-evoked CSA in the rabbit cerebellum was localized to a single ZII stripe: stripe P5− in the hemisphere, corresponding to the C3 zone, which receives somatosensory input via the dorsal accessory olive. The present study extends the field by showing the physiological correlates of an array of ZII stripes at a systems level. We maintain that this is the only study showing how a series of adjacent ZII+ and ZII− stripes are tied to specific physiological functions as measured in the responses of PCs to natural stimulation.
Olivary inputs to zebrin stripes
Several studies in rodents have examined how the sagittal zones of olivary afferent terminals are related to the sagittal ZII stripes (Voogd et al., Reference Voogd, Pardoe, Ruigrok and Apps2003; Sugihara & Shinoda, Reference Sugihara and Shinoda2004; Voogd & Ruigrok, Reference Voogd and Ruigrok2004; Pijpers et al., Reference Pijpers, Apps, Pardoe, Voogd and Ruigrok2006; Sugihara & Quy, Reference Sugihara and Quy2007). For example, Pijpers et al. (Reference Pijpers, Apps, Pardoe, Voogd and Ruigrok2006) investigated the collateral terminations of CFs from small retrograde tracer injections in the cerebellar cortex and correlated the resulting terminal pattern with zebrin stripes. They found that the labeled CF collaterals had the same ZII signature as that of the injection site. Voogd et al. (Reference Voogd, Pardoe, Ruigrok and Apps2003) investigated the distribution of CFs to the copula pyramidis and the paramedian lobule in relation to the pattern of ZII stripes in the rat. Olivocerebellar fibers originating from the rostral–dorsal accessory olive innervate the ZII− stripes of the C1 and C3 zones, and the rostral–medial accessory olive and principal olive innervate, respectively, the ZII+ stripes of the C2 and D zones. Voogd and Ruigrok (Reference Voogd and Ruigrok2004) investigated the CF projections to the vermis of the cerebellum in relation to ZII stripes in rats. They found that small injections in various inferior olivary subnuclei produced CF bands, which were generally confined to either a positive or a negative ZII stripe but not both. In a comprehensive study of the entire cerebellum, Sugihara and Shinoda (Reference Sugihara and Shinoda2004) identified olivocerebellar projections to ZII compartments by labeling CFs with BDA injected into numerous olivary subnuclei in rats. They found that the principal olive and several medial subnuclei innervated zebrin-positive stripes, whereas the centrocaudal portion of the medial accessory olive innervated zebrin-negative stripes in the vermis. The dorsal accessory olive and neighboring regions innervated zebrin negative and lightly positive stripes in the hemisphere and the rostral and caudal pars intermedia. To reiterate, all these studies emphasize that subnuclei in the inferior olive (IO) innervate either ZII+ or ZII− stripes but not both. This strongly suggests that ZII+ and ZII− stripes are functionally different. The results from the pigeon flocculus reveal a different organization. In Pakan & Wylie (Reference Pakan and Wylie2008), injections into either the rostral or the caudal mcIO resulted in CF labeling in sagittal strips that spanned a ZII+ and ZII− stripe. Despite the possible shortcomings of olivary injections (spread, uptake by fibers of passage, etc.), the implication that the adjacent ZII+ and ZII− pair has similar function was upheld in the present study: adjacent ZII+/− pairs in the flocculus receive identical olivary information. Whether this type of organization is unique to the flocculus or the avian cerebellum remains to be seen.
Functional organization of the pigeon flocculus in relation to the zebrin stripes
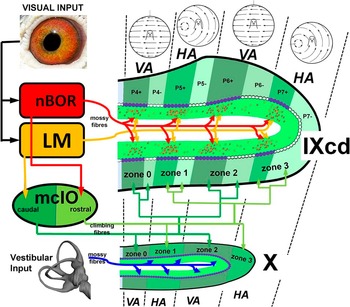
The functional unit of the cerebellum is the cerebellar “module” (Voogd & Bigaré, Reference Voogd, Bigaré, Courville, de Montigny and Lamarre1980; Apps & Garwicz, Reference Apps and Garwicz2005) that consists of three parts: (i) a subnucleus of the IO, (ii) the parasagittally oriented zone (or zones) of PCs to which CFs from the IO subnucleus project, and (iii) the corticonuclear targets of those PCs. In Fig. 6, we show the modular organization of the pigeon flocculus, but without the corticonuclear targets, and how it relates to ZII immunoreactivity. In addition, we show how visual optic flow and primary vestibular information reaches the flocculus via MF and CF systems. The pigeon flocculus thus consists of two modules; a VA module and an HA module. Each module consists of two separate zones spanning folia IXcd and X: VA zones 0 and 2 and HA zones 1 and 3. Previously, we have shown that the VA zones receive input from the caudal half of the mcIO, whereas the HA zones receive input from the rostral mcIO (Wylie et al., Reference Wylie, Winship and Glover1999; Winship & Wylie, Reference Winship and Wylie2003; Pakan et al., Reference Pakan, Todd, Nguyen, Winship, Hurd, Jantzie and Wylie2005). The optic flow inputs to the mcIO originate in two retinal recipient nuclei: the nucleus of the basal optic root (nBOR) and the pretectal nucleus lentiformis mesencephali (LM). The input to the caudal and rostral mcIO is largely from LM and nBOR, respectively (Wylie, Reference Wylie2001; Pakan et al., Reference Pakan, Graham and Wylie2010). Two lines of evidence reinforce the idea that the VA zones 0 and 2 correspond to ZII stripes P4+/− and P6+/−. First, in the present study, we found that recording locations of VA cells were localized to these ZII stripes. Second, Pakan et al. (Reference Pakan and Wylie2008) injected anterograde tracer into the caudal mcIO and found two distinct bands of CFs spanning IXcd and X. In IXcd, the labeled CFs were in the P4+/− and P6+/− stripes. Likewise, similar information shows that the HA zones 1 and 3 correspond to ZII stripes P5+/− and P7+/−. In the present study, we found that recording locations of HA cells were localized to the P5+, P5−, and P7− stripes. After injections of anterograde tracer into the rostral mcIO, Pakan et al. (Reference Pakan and Wylie2008) found two distinct bands of CFs spanning IXcd and X. In IXcd, the labeled CFs were in the P5+/− and P7+/− stripes. Thus, although we were not able to localize any cells to the P7+ stripe in the present study, from the CF data of Pakan et al. (Reference Pakan and Wylie2008), we infer that HA zone 3 includes the P7+ stripe. (Likely, we were not able to localize any recordings from this stripe because it is quite small, only a few PCs wide.)
Organization of the pigeon flocculus: correlating physiology, anatomy, and intrinsic immunochemistry. The organization of the VA and HA zones are shown in relation to MF and CF inputs and the distribution of ZII. ZII+ PCs are represented as purple, whereas ZII− cells are white. The visual optic flow inputs originate in both the nucleus of the nBOR and pretectal nucleus LM. This optic flow information reaches both folia IXcd and X as CF inputs via from the mcIO. nBOR and LM also project directly to IXcd as MFs, which terminate primarily adjacent to ZII+ stripes (red and yellow dots in the granular layer). Primary vestibular inputs reach X as MFs. See text for more details.

Do ZII+ and ZII− PCs within a floccular zone have differential functions?
It therefore appears that each zone in the flocculus consists of two subzones showing heterogeneous ZII immunoreactivity (i.e., a ZII+ subzone and a ZII− subzone). Despite the fact that the CSA of all PCs in a given zone seem to respond to optic flow in a homogeneous manner, it is possible that the ZII+ and ZII− cells are functionally different. The flocculus integrates multisensory information for the generation of compensatory eye movements and more specifically for the plastic modification of the vestibuloocular reflex (Miles & Lisberger, Reference Miles and Lisberger1981). It has been suggested that the ZII+ and ZII− PCs differ in their role in synaptic plasticity (Nagao et al., Reference Nagao, Kitazawa, Osanai and Hiramatsu1997; Wadiche & Jahr, Reference Wadiche and Jahr2005; Paukert et al., Reference Paukert, Huang, Tanaka, Rothstein and Bergles2010), but how the ZII+ and ZII− stripes may contribute differently to the plasticity of the vestibuloocular reflex is unknown.
The scant data available does allow for some preliminary observations as to the differential functioning of ZII− and ZII+ PCs. Sugihara et al. (Reference Sugihara, Marshall and Lang2007) recorded from multiple PCs and found that the tendency for CSA to occur synchronously (i.e., within 1 ms) was higher for PCs within a ZII− or ZII+ stripe. Applied to the pigeon flocculus, based on these data, one would predict that the CSA of PCs within a ZII+ or ZII− stripe in IXcd should tend to fire synchronously. Furthermore, those within the ZII+ stripe in IXcd may fire synchronously with PCs in the same zones in X, which are all ZII+. Pakan et al. (Reference Pakan, Graham and Wylie2010) also showed that the ZII+ and ZII− stripes in IXcd also receive differential MF inputs (Fig. 6). In addition to providing input to the mcIO, the LM and nBOR also project directly as MFs to IXcd but not X (Clarke, Reference Clarke1977; Brecha et al., Reference Brecha, Karten and Hunt1980). Given that there is a differential projection from LM and nBOR to the mcIO, one might expect that the nBOR and LM preferentially target the HA and VA zones, respectively. This is not the case. Pakan et al. (Reference Pakan, Graham and Wylie2010) showed that after injections of anterograde tracer in nBOR and LM, MF terminal labeling from both LM and nBOR was equally distributed to all floccular zones. However, a disproportionate amount of the terminal rosettes were in the granular layer adjacent to ZII+ stripes in IXcd. If one assumes that this translates to heavier input from the nBOR and LM to the ZII+ PCs via granule cell axons, then the simple spike activity of ZII+ PCs in IXcd would be more responsive to optic flow stimuli. [This assumption, however, is challenged by the findings of Barmack and Yakhnista (2008). After microinjections of retrograde tracer in the molecular layer of the mouse uvula, retrogradely labeled granule cells were widespread, and thus, there may be little topographic specificity between the MF afferents and PC simple spike activity. Moreover, Barmack and Yakhnista (2003) showed that much of the simple spike modulation is due to CSA likely acting via interneurons.] The simple spike activity of PCs in folium X might be entirely different from IXcd. LM and nBOR do not project to X, but a primary vestibular projection is almost exclusive to X (Schwarz & Schwarz, Reference Schwarz and Schwarz1983). Thus, within a module, simple spike activity of PCs in IXcd and X will be dominated by visual and vestibular inputs, respectively. The CSA in IXcd and X, however, will be driven by visual stimulation, but with different timing in the ZII+ and ZII− subzones.
Taken together, the points raised above emphasize that in considering the organization of the cerebellum, one must consider more than the sagittal zone (for review, see Apps & Hawkes, Reference Apps and Hawkes2009). Clearly, there is a sagittal organization of CF inputs, which traditionally define the zones, but the heterogeneity of ZII expression shows that these zones can be further subdivided. The idea of such sagittal organization, termed microzones, is not new (Andersson & Oscarsson, Reference Andersson and Oscarsson1978); however, our demonstration that a functional zone defined by CSA responsiveness contains ZII+ and ZII− subzones is unique. The pattern of MF projections to the flocculus indicate that there is also a transverse organization of sensory information in the flocculus, in this case, visual optic flow inputs to IXcd and primary vestibular inputs to X. The pattern of MF inputs from nBOR and LM to IXcd also indicates that there is an interaction between the transverse and sagittal dimensions as these MF inputs to IXcd preferentially target the ZII+ zones. Thus, although all PCs in a sagittal zone may share a common olivary input and have similar CSA, in terms of function, there may be a mosaic or patchy organization within the zone (Apps & Hawkes, Reference Apps and Hawkes2009).
Several pieces are needed to complete the picture of sensory organization in the flocculus. Most notably, are there inputs that preferentially target the granular layer adjacent to the ZII− stripes in IXcd? MF projections to IXcd also arise from the vestibular nuclei, spinal cord, and pontine nuclei (Freedman et al., Reference Freedman, Feirabend, Vielvoye and Voogd1975; Clarke, Reference Clarke1977; Vielvoye & Voogd, Reference Vielvoye and Voogd1977; Necker, Reference Necker1992; Pakan & Wylie, Reference Pakan and Wylie2008). Do the PCs in the ZII+ and ZII− stripes within a zone have different projections? Previously, we showed that the VA and HA zones project to several nonoverlapping areas in the vestibular and cerebellar nuclei (Wylie et al., Reference Wylie, Brown, Barkley, Winship, Crowder and Todd2003). In rats, Sugihara et al. (Reference Sugihara, Fujita, Na, Quy, Li and Ikeda2009) have shown that ZII+ and ZII− PCs project to different areas in the vestibular and cerebellar nuclei.
ZII in the flocculus of rodents and primates
As the present study is the first demonstration of a correlation between zebrin stripes and physiologically defined zones in the cerebellum at a systems level, it is unclear if our results generalize to other systems in the cerebellum. Moreover, it is unclear if our results can generalize to the flocculus in mammalian species. As reviewed by Voogd and Wylie (Reference Voogd and Wylie2004), to say that the organization of the flocculus appears highly conserved cannot be overstated. In all animals studied (pigeon, rabbit, cat, monkeys, rat, and mouse), the flocculus consists of a number (4–7) of interdigitated VA and HA zones. The response properties of neurons, the pattern of olivary input, and the projection patterns of the HA and VA zones are strikingly similar across aves and mammals. Despite the fact that the distribution of ZII immunoreactivity is generally conserved in avian and mammalian cerebella (Pakan et al., Reference Pakan, Iwaniuk, Wylie, Hawkes and Marzban2007; Iwaniuk et al., Reference Iwaniuk, Marzban, Pakan, Watanabe, Hawkes and Wylie2009; Marzban et al., Reference Marzban, Chung, Pezhouh, Feirabend, Watanabe, Voogd and Hawkes2010), studies of ZII immunoreactivity in rats and mice do not reveal stripes in the flocculus: rather the flocculus appears uniformly ZII+ (Brochu et al., Reference Brochu, Maler and Hawkes1990; Eisenman & Hawkes, Reference Eisenman and Hawkes1993). However, in the rodent flocculus, other molecular markers, for example, heat shock protein 25 (Hsp25), are expressed heterogeneously as a series of parasagittal stripes (Armstrong et al., Reference Armstrong, Krueger-Naug, Currie and Hawkes2000). Schonewille et al. (Reference Schonewille, Luo, Ruigrok, Voogd, Schmolesky, Rutteman, Hoebeek, De Jeu and De Zeeuw2006) investigated the correspondence of the HA and VA floccular zones in mouse with Hsp25. The relationship between the optokinetic zones and the Hsp25 stripes was completely different to what we found in the present study in relation to ZII. An Hsp25-positive stripe encompassed zones 1 (HA) and 2 (VA), and an Hsp25-negative stripe encompassed zones 3 (HA) and 4 (VA).
The uniformly ZII+ flocculus observed in rodents may be the exception rather than the rule for mammals. Fujita et al. (Reference Fujita, Oh-Nishi, Obayashi and Sugihara2010) examined ZII expression in marmosets (Callithrix jacchus). They showed that the flocculus did have ZII stirpes, with four ZII+/− pairs. Whether the VA and HA zones in the marmoset, each span a ZII+/− pair as in the pigeon remains to be seen.
Acknowledgments
We would like to thank Dr. Richard Hawkes from the University of Calgary for kindly providing us with the ZII antibody. This research was supported by funding to D.R.W. from the Canadian Institute for Health Research and the Canadian Foundation for Innovation. D.R.W. was supported by funding from the Canada Research Chairs Program. J.M.P.P. was supported by graduate scholarships from Natural Science and Engineering Research Council of Canada (NSERC), Alberta Ingenuity Fund, and Killam. D.J.G. was supported by graduate scholarships from NSERC. We thank A. Iwaniuk for his comments.