




No CrossRef data available.
REAL-TIME ECONOMETRICS
Published online by Cambridge University Press: 08 February 2005
Abstract
This paper considers the problems facing decision makers using econometric models in real time. It identifies the key stages involved and highlights the role of automated systems in reducing the effect of data snooping. It sets out many choices that researchers face in construction of automated systems and discusses some of the possible ways advanced in the literature for dealing with them. The role of feedbacks from the decision maker's actions to the data generating process is also discussed and highlighted through an example.
Information
- Type
- Research Article
- Information
- Copyright
- © 2005 Cambridge University Press
1. INTRODUCTION
The focus of econometric analysis has predominantly been on retrospectively estimating and interpreting economic relationships. However, in many uses of econometric models by businesses, governments, central banks, and traders in financial markets the focus is on making decisions in real time, and hence there is an urgent need to develop robust interactive systems that use econometric models to guide decisions in real time. This use of econometric methods is of course not without precursors and is closely related to the development of sequential analysis pioneered by Wald (1947) and recursive estimation methods proposed by Brown, Durbin, and Evans (1975) for use in real-time quality control.1
Sequential or recursive techniques have also been used extensively in biomedical research and engineering. Dawid (1984) has been advocating the use of probability forecasting in sequential statistical analysis, known as the “prequential approach.”
Automated systems are bound to become an important tool for the development of real-time econometrics, and the dialogue between Granger and Hendry (Granger and Hendry, 2005) is a pertinent reminder of many of the challenges facing designers and users of such systems. By setting out in advance a set of rules for observation windows and variable selection, estimation, and modification of the econometric model, automation provides a way to reduce the effects of data snooping and facilitates learning from the performance of a given model when applied to a historical data set.
In this paper we set out what we see as the three key stages in real-time automated econometric modeling, namely, model construction, monitoring and modification, and the model innovation process. The first stage, model construction, sets out the objective function, chooses the estimation method, selects variables and functional forms, and seeks to cross-validate the “best” or the “average” model. The second stage sets out procedures for monitoring and evaluating the performance of the econometric model in real time and, if deemed necessary, undertakes the necessary modifications. This involves deciding on statistical decision-based evaluation criteria used to determine whether the performance of the econometric model is satisfactory. Finally, the third stage involves deciding which alternative new modeling strategies to consider in case of unsatisfactory performance and even a criterion for dispensing with the econometric modeling approach altogether if there is systematic evidence of a breakdown.
The plan of the paper is as follows. As a way of furnishing a concrete illustration of the issues involved in real-time econometric modeling, Section 2 considers a relatively simple, one-period portfolio decision problem from finance. Section 3 sets out the forecasting and decision problem that underlies automated systems. Sections 4 and 5 consider model construction, monitoring, modification, and innovation. Section 6 outlines some future areas of research.
2. AN ILLUSTRATION FROM FINANCE
Consider a portfolio of long and short (dollar) positions at time T, represented by the s × 1 vector dT, and denote the s × 1 vector of returns associated with the underlying assets over the subsequent period by rT+1. Abstracting from transaction costs, the value of this portfolio at the end of T + 1 is given by

Suppose the loss (the negative of utility) function of some trader is of the constant absolute risk aversion type:

with the expected loss computed conditional on the information set,

, that contains rT, dT and their lagged values and also observations on a number of other state variables (besides rT) that we denote by zT. Further, for the time being suppose that the risk aversion coefficient, φ, is sufficiently large so that one can safely assume that changes in a trader's short and long positions will not influence the probability distribution of asset returns, rT+1, conditional on

; namely, there are no market impacts from the trades:

.
In the presence of model and parameter uncertainty a trader faces a number of important choices:
- Which probability distributions to consider for returns? For example, whether to assume the returns have a multivariate Gaussian distribution or a mixture of multivariate normal densities or opt for multivariate student t. The form of the probability distribution of asset returns (particularly in the tails) has important implications for risk management, although it is true that many estimation and model selection procedures are robust (in large samples) to the choice of the distribution of asset returns.
- How to model mean returns? There are many factors that could be
considered, say, as linear or nonlinear functions of
xT =
{rT,zT} and
possibly their lagged values, and it seems unlikely that the same set
of candidate factors would have been relevant historically. The sheer
size of the possible factors that could be considered, the relatively
short time series that are typically available,2and the time constraint that often exists between the collection and compilation of data at close of one market and the issuance of trade orders for execution at the start of another market place important restrictions on the search process across the possible factors and how it is implemented. This might introduce a certain degree of randomization in model selection (model averaging) procedures, and search algorithms such as the recursive modeling method, to be reviewed subsequently.
At daily frequencies large data sets are available for some assets, such as yen and Euro dollar rates, but even in the case of these assets one might not wish to use all the data available in forecasting because of the possibility of structural change in asset markets; a topic that we shall return to under the choice of “data window.”
- Which specifications to consider for modeling of asset return volatilities? In addition to the search problems discussed earlier, one is also faced with the problem of dealing with large correlations typically encountered across asset returns and the possibility that such correlations may vary across time, rising at times of crisis and falling in calmer periods.
Risk management considerations also dictate that the loss function (2) is augmented with the following value at risk (VaR) constraint:

where Vα is the maximum loss tolerated over any one trading day with probability α (often taken to be 1%). It is clear that the minimization of the expected loss function in (2) subject to the VaR constraint in (3) requires a complete specification of the probability distribution of asset returns. To simplify the exposition we suppose that in the search the trader focuses on the class of multivariate Gaussian specifications drawn from the set

:

as well as the Bayesian model average and other combinations. Here μiT and ΣiT denote the time-T conditional mean and conditional variance-covariances of asset returns, respectively, assuming model Mi holds. Note that μiT and ΣiT would typically depend on one or more elements of xT and their lagged values with a number of unknown parameters that need to be estimated or integrated out of the decision process. Abstracting from parameter uncertainty we first note that, under Mi,

and

where Φ(.) stands for the cumulative distribution function of a standard normal variate. Denoting the α% left tail of the standard normal distribution by −cα, the VaR constraint can also be written as

The Lagrangian for minimizing −φdT′ μiT + ½φ2dT′ΣiTdT subject to (5) is

Because there are s positions to be determined with one VaR constraint we proceed initially by ignoring the VaR constraint (setting λ, the Lagrange multiplier, to zero). In this case the optimal positions under model Mi are given by

We now check to see under which conditions these positions also satisfy the VaR constraint (3). Substituting (7) in (5) we have

where siT = (μiT′ΣiT−1 μiT)1/2 is the multivariate Sharpe ratio (in absolute value) under model Mi. Therefore, the positions given in (7) satisfy the VaR constraint if the risk aversion coefficient is sufficiently large such that

otherwise the optimal solution that satisfies the VaR would be

Combining the two solutions, we have

where

The realized value of the loss function under model Mi is now given by

where we have replaced (μiT, ΣiT) by their estimates based on a given data or observation window. A decision-based evaluation exercise can now be carried out whereby the performances of the alternative models are compared in terms of their associated realized losses over a given evaluation period, (R + 1,T):

where

are the recursive estimates of μi,t−1 and Σi,t−1 based on observations up to and including time t − 1.
3Decision-based evaluation techniques are discussed in Granger and Pesaran (2000a, 2000b) and reviewed and developed further in Pesaran and Skouras (2002).
2.1. Feedback Effects
Although feedback effects are likely to be less important in trading than in macroeconomic decision making, i.e., when considering the effect of monetary policy, they can and do exist in trading by large financial corporations, and the preceding application can be readily adapted to show the additional issues that could arise when the possibility of feedbacks from dt to xt is recognized by the decision maker. For simplicity of exposition let s = 1 and suppose that such feedback only takes place through the effects of changes in trade positions on returns. Assume also that the change in the trade position decided at the end of period T is filled some time during the interval (T;T + 1], ΔdT+1 = dT+1 − dT = dT* − dT, or more generally dt+1 = dt* for all t. Under this setup a simple model of returns that allows for feedback is given by

where Mi,T denotes the return regression model assumed by the trader to hold at the end of period T. The coefficient ψi ≥ 0 measures the trader's perception of his market impact under Mi,T.4
It is assumed that the trader does not observe the trade positions of others in the market.
Abstracting from VaR considerations, in this case we have

Under zero market impact, ψi = 0, this solution reduces to the standard mean-variance result, βi′xiT /φσiT2. To implement dT+1, the trader would need to estimate the parameters {ψi, βi} and the return volatility, σiT2. Because these parameters are specific to the model used by the trader they can, at best, be estimated for the particular model that had been used by the trader during the estimation period prior to date T. In reality, the trader might have used many different models in the past, and in that case historical observations on dt,rt, and xt, t = T,T − 1,…, would not be relevant to the estimation of the parameters of model Mi,T. The problem arises more clearly if the trader in fact wishes to consider a counterfactual exercise with respect to any model, say, Mj,T, which has been used by him or her in the past. It is not clear how historical data could be used by the trader to estimate the market impact coefficient, ψj, under Mj,T. One way to get around this problem is by generating a sample that is consistent with the counterfactual policy. Such experiments can be costly, though, and are typically not available for econometric estimation purposes.
This application shows many choices that a decision maker will be faced with, even if the nature of the decision problem and the space of assets to be traded are taken as given. In what follows we consider some of these issues more generally and the type of solutions suggested in the literature for dealing with them.
3. THE DECISION PROBLEM
We shall focus on a single-period forecasting and decision problem, but many of our comments also apply to multiperiod decisions. The decision problem, as it is usually setup, presumes the existence of a unique time invariant loss function, [ell ](dT,xT+1, φ), where dT is the s × 1 vector of decision variables set at the end of period T, xT+1 the k × 1 vector of state variables realized over the period from T to T + 1, and φ is a vector of fixed coefficients. Decisions are implemented during the period (T,T + 1).
5To simplify the exposition we assume that the decision can be exactly implemented.

, which at least contains {dT,xT} and their past values. The decision variables are then derived by solving the following optimization problem:

where

is the set of feasible actions at time

is the decision maker's time-T estimate of the probability forecast density function of xT+1 conditional on

is the domain of variations of xT+1 assumed to be known at time T. In cases where the loss function is quadratic in dT only a conditional point forecast of xT+1, namely,

, will be needed, but in general the whole probability density is required.
At each decision point, T, the decision maker faces considerable uncertainty regarding the choice of

and might also be uncertain about the choice of the loss function and/or its parameter values and also the measurement of some of the state variables. But in what follows we suppose that the loss function is known to the decision maker and abstract from data uncertainty. Neither complication is germane to the issues that we wish to raise here.
The decision process is further complicated when the implementation of the decision (or “action” by the decision maker) influences the “true” conditional probability distribution of the state variables, xT+1, which we denote by

. The possibility that changes to dT might affect

has further implications for econometric model construction and evaluation, which we highlight in Section 4.
3.1. Formulation and Selection of Models
For a given loss function and a time series of past measurements,

on the decision and state variables zt = (dt,xt), the single most important task facing the decision maker at time T is the choice of the forecasting model,

. The real-time nature of the decision making process recognizes that the forecasting model and its parameters might need updating at the start of each decision period (say, prior to opening of markets). This could involve simple updating of parameters of a given model (keeping the specification of the model fixed) or updating the model by searching over a prespecified set of models or might even involve searching over new models including new variables/factors, functional forms, or dynamic specifications not considered as feasible or of potential usefulness prior to date T. These three levels of model updates can be viewed as “recursive estimation,” “recursive modeling,” and “innovative modeling,” respectively. Clearly, recursive modeling involves recursive estimation but not vice versa, and innovative modeling could encompass both recursive modeling and recursive estimation.
Selection of a model for use in decision making involves providing an answer to a counterfactual exercise, namely, a comparative analysis of the losses that would have been realized in the past under alternative specifications of the forecasting model (and hence the decision rules). Assume that

, the data generating process (DGP), is unknown and suppose that at time T the decision maker is faced with a set of forecasting models,

. Each model, Mi, is defined by the conditional probability density function of xt defined over the estimation period t = T0,T0 + 1,…,T, (T0 ≥ 1), and the forecasting period, t = T + 1, in terms of a ki × 1 vector of unknown parameters, θi, assumed to lie in the compact parameter space, Θi:

Conditional on each model, Mi, being true it will be assumed that the true value of θi, which we denote by θi0, is fixed and remains constant across the estimation and prediction periods and lies in the interior of Θi.6
Phillips (1996) discusses the possibility that none of the models in

represents the true DGP in which case the best (local) approximation is being sought.

which depends on the unknown parameters of the selected forecasting model,

. To derive an operationally feasible decision rule, one would need to replace θi with a suitable estimate or eliminate such parameters by integrating them out with respect to their posterior distributions using Bayesian techniques. Under both approaches we have

where ψi(.) represents the vector of decision rules that depends on the loss function and its parameters, φ, the choice of the forecasting model, Mi, and the particular procedure used to deal with the unknown coefficients, θi.
Under Mi, the estimation of θi, or derivation of its posterior distribution, can be based on the joint likelihood function of zt defined over the “observation window”: t = T0,T0 + 1,…,T:

where

is the conditional density of the decision variables assuming model Mi holds. In general, there are complicated restrictions linking the solutions to the decision and estimation problems. However, in the case of atomistic agents where the feedback effects of dt on xt can be ignored so that

the estimation and decision problems are decoupled, and estimation can be based on the likelihood of the state variables alone:

This in turn may require that the decision variables are constrained to lie in a restricted set so that their simulated values computed conditional on model Mi do not influence the state variables. In evaluation of trading strategies this requirement is usually met by restricting the trading positions to be sufficiently small or by inclusion of appropriate penalty terms in the loss function so that

, where

is a restricted subset of

.
4. SPECIFICATION SEARCH, DATA SNOOPING, AND USE OF AUTOMATED TECHNIQUES
The preceding overview of the decision and estimation problems clearly shows a number of important choices that face the decision maker, such as the choice of the forecasting model, the choice of the observation (estimation) window, the treatment of possible feedbacks from decisions onto the state variables in cases where the decisions are expected to influence the probability distribution of the state variables and comparison of the performance of alternative models, estimation procedures, and observation windows. In this section we discuss the role of automated model selection for each of these points.
4.1. Choice of Forecasting Model
Econometric modeling is often guided by existing economic theory although this will typically only be broadly suggestive of which state variables or functional form to use in the econometric model. To learn about these, the econometrician will therefore in practice undertake substantial specification searches across the set of potential models,

. The search for the “best” or an “average” model involves using the same set of realizations (historical data) many times over. The outcome could also depend crucially on the choice of the criterion function (likelihood or utility), the extent to which model complexity is penalized, and the particular model space over which the search is carried out. As a result the in-sample penalized performance of the model selected is not an unbiased estimator of the model's subsequent (out-of-sample) performance and can severely underestimate the true loss.
7Leamer (1978) was one of the first in the econometrics literature to highlight this problem.
One way to deal with this problem is to assess the statistical significance of the best model in the context of the specification search that preceded it. This is the approach taken, e.g., by Sullivan, Timmermann, and White (2001), who bootstrap performance statistics to evaluate the significance of the best model drawn from a larger universe. This method provides a correction to the standard p-value that conditions on one model (as if it were prespecified) and therefore ignores the search that preceded it.
Automation can assist in reducing, but not eliminating, the effects of data snooping and pretest bias. Subjective opinions about specific variables and functional forms are likely to benefit significantly from hindsight as such opinions will be formed after gaining experience with different modeling strategies on an existing data set. Automated data-driven model selection procedures do, to some extent, take the choice of model out of the hand of the modeler, although it is more difficult to reduce hindsight in the choice of the model set,

, or in the innovative modeling stage, i.e., when choosing how to revise and modify

over time.
8Clearly, the extent to which biases in subjective choices can be reduced depends on the dimensionality of

. If

only contains a few explanatory variables and functional forms that the modeler (with the benefit of hindsight) knows work well, then data snooping biases will not be reduced by much. Only if the data and model set are sufficiently large will the hindsight in the choice of a particular model be reduced.
4.2. Variable Selection
Let

denote the time-invariant universe of all possible prediction variables that could be considered in the econometric model, whereas Nxt is the number of regressors available at time t so

. The number of regressors, Nxt, is likely to grow at a faster rate than the sample size, T. At some point there will therefore be more regressors than time-series observations. However, most new variables will represent different measurements of a finite number of underlying economic factors such as output/activity, inflation, and interest rates.
Rather than searching over all possible combinations of predictor variables at random, a sensible approach is to first categorize variables and then choose one or a few variables from each category. Alternatively, regressors can be clustered in advance according to a simple algorithm that measures their correlation or by grouping them according to what they measure (e.g., interest rates, inflation measures). One possibility, considered, e.g., by Stock and Watson (2002), is to extract common factors and use the most important of these in forecasting.
4.3. Recursive Modeling
In Pesaran and Timmermann (1995, 2000) we proposed a recursive modeling approach that exemplifies many of the points mentioned thus far, including how to estimate μit in Section 2. Consider an Nxt × 1 column vector vi with a string of Nxt ones or zeros, where a one in the jth row means that the jth regressor is included in the model whereas a zero in the jth row means that this regressor is excluded from the model. Then each possible model at time t can be identified by the Nxt-digit string of zeros and ones corresponding to the binary code of its number. Without loss of generality, consider forecasting the first element of Xt+1,Yt+1 = e1t′Xt+1 (where e1t′ is an Nxt-vector with unity in the first position and zeros elsewhere) at time t + 1 by means of linear regressions

where Xτ,i is a vector of regressors obtained as a subset of the regressors in contention, Xτ, and Mi(τ) denotes the ith regression model at time τ. Notice that this gives a total of 2NxT possible models. When NxT is large, a comprehensive (global) search is therefore not feasible, and the approach could be modified by using Monte Carlo chain, simulated annealing, genetic algorithms, or a method such as PcGets.
Conditional on Mi(τ), and given the observations Yτ+1, Xτ,i, τ = 1,2,…, T − 1, the parameters of model Mi can be estimated by least squares. Denoting these estimates by

, we have

These ordinary least squares (OLS) estimates are fairly simple to compute and

could be used as an estimate of μiT in our finance example in Section 2. The choice of XT,i to be used in forecasting of YT+1 can be based on a number of likelihood-based model selection criteria suggested in the literature, such as Akaike's information criterion (AIC), Schwarz's Bayesian information criterion (BIC), or the posterior information criterion (PIC) of Phillips and Ploberger (1994), which applies to both stationary and nonstationary data.
This approach can of course readily be generalized to allow for nonlinear effects through indicator type variables as in threshold autoregressive models, Markov switching, or more complicated nonlinear indicators. As argued by Phillips (1996) it can also be used to choose design parameters such as whether or not to impose a unit root, choice of cointegration rank, and deterministic trend degree, etc., in broad classes of models such as reduced rank regressions, vector autoregressions (VARs), or Bayesian VARs. Whether only linear models or more general models are considered depends on the relative cost of searching across and estimating nonlinear models and the evidence of misspecification among linear models.
4.4. Model Averaging
So far we have focused on approaches that aim to select a single “best” model. More generally, the model determination process can be considered as selecting a set of weights on each of the models under consideration,

. If a single model is used only one of these weights will be nonzero, but it is possible to assign nonzero weights to several models simultaneously, to constrain the weights to add up to one (which makes sense if the individual forecasts are unbiased), and to impose nonnegativity of the weights. For example, the forecasting model under Bayesian model averaging (BMA) is given by
9
where

is the posterior probability of model Mi that is obtained from the prior distributions, the model priors Pr(Mi), and the priors for the unknown parameters, Pr(θi|Mi), and the likelihood functions of the models under consideration. BMA treats the underlying models as random variables. Markov chain Monte Carlo model composition (MC3) algorithms have been used to compute posterior probabilities for these models. Alternatively, Bayesian model selection methods based on, e.g., the model with the highest posterior probability can be used. For a discussion of related points and references to recent studies, see Section 11.3 in Koop (2003).
Note that the BMA density forecast depends on the particular set of models under consideration at time T. Model innovation concerns the evolution of the model space,

, over time, t. Conditional on

, model specification uncertainty can be taken into account by integrating the predictive density across the full set of models, i.e., by computing a weighted average of the predictive densities of each model. The weights can reflect either the (relative) likelihood values, the posterior probabilities as in (23), or the relative penalized likelihood values using a penalty term such as in the Akaike or Schwarz information criteria. Even with such approaches, it is still an open question which penalty function will yield the best results when judged according to the metric established by the economic loss function, [ell ].
Model averaging is particularly attractive in situations such as that reported by Phillips (1995) where the forecasts from the individual models are found to be very different and hence subject to a high degree of uncertainty. In the context of the asset allocation problem reviewed in Section 2, averaging could also proceed over probability density forecasts with different specifications of the conditional volatility, Σit.
A second possibility is to apply (Bayesian) shrinkage methods to the parameters of an individual forecasting model (e.g., a VAR) or to the combination weights (cf. Litterman, 1986). This is particularly attractive in the case of models with many parameters.
A third possibility is to apply the “thick modeling” method developed by Granger and Jeon (2004), which takes averages over the full set of models, suitably truncated to avoid using models with measurably poor performance.10
Recent applications of model averaging techniques in econometrics include Fernandez, Ley, and Steel (2001a, 2001b), Aiolfi and Favero (2002), and Garratt, Lee, Pesaran, and Shin (2003).
4.5. Data Window
Model instability is a real possibility due to technological or institutional changes and policy shifts. How much data to use in the modeling stage depends on the nature of possible model instability and the timing of possible breaks. To test for model instability, the full information set,

, should always be used to the extent possible. Once more is known about the nature of any model instability, an informed decision can be taken on how much data to discard.
Many classes of estimators take the form of weighted least squares. Let Xτ,i be the τth observation of the ith subset of X-variables. Further, let ωτT ∈ [0;1] be the weight on observation τ at time T. Then

This class of estimators encompasses as special cases
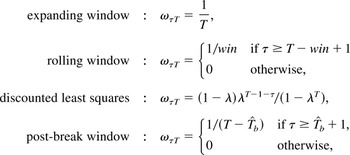
where win is some fixed, predetermined window length and

is the most recent breakpoint estimate obtained using data up to period T. Pesaran and Timmermann (2002) propose a reversed ordered (cumulative sum) CUSUM method that reverses the sequence of the data and tries to identify the most recent break in the data. This method is designed to answer how much historical data to use to estimate the parameters of a forecasting model. For example, when computing the conditional mean of stock returns, μit, one may choose only to use data after the oil price shocks of 1974 or after the stock market crash of 1987.
The expanding window method is efficient if the DGP is stationary and the model represents the true DGP. Discounted least squares is optimal in some settings with time-varying second moments, whereas the postbreak data window is optimal provided that a sufficiently large discrete break has occurred. This latter method is related to the approach of Phillips (1996) for discarding data prior to a certain time period based on the relative likelihood ratio of pairs of competing forecasting models.
4.6. Data Revisions and Measurement Errors
Macroeconomic variables in particular are often subject to important measurement errors and data revisions (cf. Croushore and Stark, 2001; Egginton, Pick, and Vahey, 2002). Where feasible, any real-time econometric model should make use of such data in all stages so as not to overstate the degree of predictability.
Financial variables such as interest rates and stock prices are typically not similarly affected by data revisions but may be subject to measurement errors—particularly when such data are fed into a computer in real time. To detect outliers that could lead to unreliable results, a filter could be designed that alerts users to aberrations more than a certain distance away from the standard range observed for a particular variable.
Other operational issues are likely to further constrain the econometric model. For a start, the time required to update a model forecast is constrained by real-time considerations. For example, if minute-by-minute trading is desired and the computation of a one-period forecast takes more than one minute, the forecast will be useless by the time it becomes available. The speed of the algorithm could therefore be an important consideration.
4.7. Cross-Validation
In view of the very large set of potential regressors in

, spurious relationships could well result from an extensive model specification search, and it is important to reduce the effects of data snooping. One strategy is to apply cross-validation techniques. This can be implemented by splitting the data set into a training sample [1; R] used to select an econometric model

and estimate its parameters to get a predictive density,

, and an evaluation sample [R + 1;T] used to evaluate the model. Because overparameterized models are likely to perform poorly in the cross-validation sample, this method can be viewed as an alternative way of penalizing for model complexity.
Cross-validation need not be based on the same metric as that used in the loss function. A range of alternative performance indicators—such as the percentage of correctly predicted signs or the Sharpe ratio in the case of a trading system—could also be used. This is important because the sampling distribution of the economic loss measure, [ell ](.), may be poorly behaved. Suppose, e.g., that the decision maker cares about the wealth generated by an automated trading system. Cumulated wealth, being the product of a sequence of returns over the trading period, is likely to have a sampling distribution with very large standard errors, so even a relatively long cross-validation sample could well lead to inconclusive results.
Cross-validation techniques have other limitations. The modeler is bound to have some knowledge of the basic characteristics of the historical data from R + 1 to T. This means that the cross-validation sample is not virgin data and could potentially bias the performance. As a case in point, an econometrician may have a data set on stock returns from 1985 to 2000 and use the first part of the data for model construction, whereas the latter half is used for cross-validation. Knowing that the last half included a sustained bull market could well bias the modeler to include “momentum” variables that would work very well in the cross-validation period although they would have little if any predictive power in the subsequent sample.
Furthermore, because the rules for the construction of the econometric system have to be “written in stone” and be in place at the outset of the cross-validation period, inevitably decision rules will be based on old data. This introduces a locality problem because it is likely that the econometric model would have worked better if more recent data could have been used to change the rules of the econometric system.
A final problem associated with cross-validation is that the statistical tests underlying the evaluation period are likely to have weak power and thus may not be very informative. One way to evaluate this loss in power is by quantifying the impact of the specification search leading to the “best” model using methods such as those adopted by Sullivan et al. (2001). Another strategy is to use stress-testing methods that either simulate or bootstrap from a model that captures salient features of the underlying data set and examines the performance of the model under a range of plausible scenarios.
4.8. Applications
Automated model selection is still a relatively recent tool, and not that much experience has yet been gained with it. Pesaran and Timmermann (1995, 2000), Phillips (1995), and Schiff and Phillips (2000) report the outcome of applications of automated model selection experiments for stock returns (portfolio allocation) and forecasts of Asia-Pacific (New Zealand) economic activity variables, respectively. Aiolfi and Favero (2002) use thick modeling to obtain recursive forecasts of asset returns. Coe, Pesaran, and Vahey (2003) provide an application of recursive modeling to the term structure of U.K. interest rates to see if econometric techniques could have been used to reduce the interest costs of managing public debt. These studies suggest that the automated procedures generally select parsimonious models whose simulated forecasting performances tend to be better than that provided by reasonable benchmarks such as forecasts based on random walk models or official forecasts (Schiff and Phillips, 2000).
These studies also point out that the best approximating model is time-varying. Phillips (1996) introduces the idea of the “lifetime” of an econometric model. Pesaran and Timmermann (2000) plot out a sequence of indicator variables tracking the inclusion or exclusion of a particular regressor in the forecasting model and find that some variables drop out after an initial inclusion period or get included in blocks in time.
Monte Carlo evidence reported by Hendry and Krolzig (2003) is also suggestive of the ability of automated modeling approaches to select key regressors at least in the context of linear models in a stationary environment.
Phillips (2003) proposes a powerful future application that would make econometric model determination software available to nonexpert users via the Web. Users choose a set of potentially relevant forecasting variables and may also provide their own data. The software then produces outputs such as graphs of forecasts surrounded by standard error bands. An extension of this idea is to link the forecasts with an objective function representing the user's attitude toward risk and an optimizer and solve for variables such as savings and portfolio choices.
5. MONITORING, MODIFICATION, AND INNOVATION
5.1. Performance Monitoring
Once a model has been selected and cross-validated using data up to time T, it is reasonable to monitor its real-time performance at regular intervals, e.g., every h periods at time T + h, T + 2h, T + 3h,…,T + nh, where n is a positive integer. The monitoring frequency, h, should be a function of the degree of model instability observed in prior periods and also of the cost of the monitoring.
The initial model is naturally maintained provided that the economic or statistical loss does not exceed some predetermined value [ell ]max:

where we recall that

is the predictive density conditional on model Mi and

If (25) is satisfied, then forecasts and decisions at time T + nh can be conditioned on Mi(T + nh). Alternatively, model rejection could be based on diagnostic tests that reflect the behavior of the forecast errors, et, an approach taken by PcGets. For example, one could monitor whether the forecast error exceeds a certain number (κ) of standard deviations of the forecasting model,

, although account also needs to be taken of possible fat tails in the distribution of the forecast errors.
5.2. Model Modification
If the criterion (25) fails to be satisfied, the model space could be expanded from

, say, where

so the new model and decision rule solve

Model modification may lead to the inclusion of an omitted factor deemed previously to be unimportant. One example of a dormant factor that came to life is oil prices during the seventies. Because oil prices varied far less prior to the 1970s, few econometric models included them, but this clearly changed subsequently.
Such modification could also be triggered automatically by some real-time monitoring system if there is evidence of a model breakdown. It is closely related to the framework for model determination proposed by Phillips (1996), which includes the possibility that the true probability measure underlying the DGP itself evolves over time due to technological or institutional shifts.
Quite independently of whether or not model performance is being considered, the parameter estimates,

, can be updated either every period (h = 1) or at regular intervals, again depending on the relative cost-benefit of such updates.
This process is very similar to the model evaluation stage used to cross-validate the econometric model over the in-sample period. It involves specifying a range of statistical performance measures that can be the basis for decisions on whether and how to modify the econometric model. As part of the monitoring, tests for structural breaks could also be undertaken. Unfortunately, existing breakpoint tests lack power against plausible (local) alternatives and in many cases do not provide precise information about the time of the break. Some breaks may, however, be large enough that they can be detected. Even when such tests indicate some form of instability they typically do not reveal the form of the instability, i.e., a breakdown in model parameters or the inclusion of new predictor variables.
5.3. Model Innovation
To avoid some of the same pitfalls involved in the initial model construction phase, the process of monitoring and modifying the econometric model in real time should be set out in advance prior to the beginning of the experiment. This amounts to specifying in advance how the model space is extended, i.e., setting out rules for constructing the sequence

. For example, one could specify rules for considering new families of models for the conditional mean, g*(Xτ,i;βi), new predictive density models f*(Xτ,i;θi), or new classes of estimators,

. Thus, if the purpose is to study the efficient market hypothesis, one could introduce new forecasting models (e.g., cointegrating regressions, neural networks, or wavelets) only at the historical point when they were introduced. Finding that a particular econometric forecasting method could have been used to generate abnormal profits 10 years prior to its invention would not be of much interest. If there are changes to the set of feasible decision rules, one also needs to set out the sequence

.
Inevitably innovative modeling relies on the modeler's judgment, and so it is typically more difficult to automate this stage than, e.g., the selection of regressors from a prespecified universe. The role of automation in this stage is therefore still an open question.
6. FUTURE RESEARCH
Much work remains to be done before the scope for success and the limitations of automated econometric models can be assessed. Little is known about the performance of different econometric approaches when models are viewed as local approximations to an evolving DGP as proposed by Phillips (1996). In general, however, parsimonious models tend to produce better out-of-sample forecasting performance than models with a large number of variables and parameters. In economics, nonstationarities take many different forms: at times the underlying DGP may be subject to sudden discrete shocks; at other times changes may evolve more gradually. The challenge is to design robust systems that can handle both types of change. One idea is to attempt to design a real-time break monitoring procedure that detects the speed of change and then conditionally chooses either fast adapting or slowly adapting forecasting models.
Another possibility is to group forecasting models by types (e.g., error correction models, stationary VARs, Bayesian VARs, time-varying parameter models), select the best model within each class, and then average across different classes of models using Bayesian type model averaging techniques. A conjecture is that averaging across very different types of models (as opposed to models that only differ by, say, their lag order) may provide robustness against larger types of change. At the same time, averaging across too many types of models may slow down the adaptation of the combined forecast following a large shift in the DGP. Much research is still needed to answer which of these effects dominates in practice.
Automated systems reduce, but do not eliminate, the need for discretion in real-time decision making. There are many ways that automated systems can be designed and implemented. The space of models over which to search is huge and is likely to expand over time. Different approximation techniques such as genetic algorithms, simulated annealing, and MCMC algorithms can be used. There are also many theoretically valid model selection or model averaging procedures. The challenge facing real-time econometrics is to provide insight into many of these choices that researchers face in the development of automated systems.
References
REFERENCES
Aiolfi, M. &
C. Favero
(2002)
Model Uncertainty, Thick Modelling and the Predictability of
Stock Returns.
IGIER Working paper 221.
Brown, R.L.,
J. Durbin, &
J.M. Evans
(1975)
Techniques for testing the constancy of regression relationships
over time. Journal of the Royal Statistical Society,
Series B
37,
149–192.Google Scholar
Coe, P.J.,
M.H. Pesaran, &
S.P. Vahey
(2003)
Scope for Cost Minimization in Public Debt Management: The Case
of the UK.
Cambridge University,
www.econ.cam.ac.uk/faculty/pesaran/cpvaug03.pdf.
Croushore, D. &
T. Stark
(2001)
A real-time data set for macroeconomists.
Journal of Econometrics
105,
111–130.Google Scholar
Dawid, A.P.
(1984)
Present position and potential developments: Some personal
views—Statistical theory, the prequential approach. Journal
of the Royal Statistical Society,
Series A
147,
278–292.Google Scholar
Draper, D.
(1995)
Assessment and propagation of model uncertainty. Journal of the
Royal Statistical Society,
Series B
58,
45–97.Google Scholar
Egginton, D.M.,
A. Pick, &
S.P. Vahey
(2002)
Keep it real! A real time UK macro data set.
Economic Letters
77,
15–20.Google Scholar
Fernandez, C.,
E. Ley, &
M.F.J. Steel
(2001a)
Benchmark priors for Bayesian model averaging.
Journal of Econometrics
100,
381–427.Google Scholar
Fernandez, C.,
E. Ley, &
M.F.J. Steel
(2001b)
Model uncertainty in cross-country growth regressions.
Journal of Applied Econometrics
16,
563–576.Google Scholar
Garratt, A.,
K. Lee,
M.H. Pesaran, &
Y. Shin
(2003)
Forecast uncertainties in macroeconometric modelling: An
application to the UK economy.
Journal of the American Statistical Association
98,
829–838.Google Scholar
Granger, C.W.J. &
D.F. Hendry
(2005)
A dialogue concerning a new instrument for econometric modeling.
Econometric Theory
(this issue).Google Scholar
Granger, C.W.J. &
M.H. Pesaran
(2000a)
A decision theoretic approach to forecast evaluation. In
W.S. Chan,
W.K. Li, &
H. Tong (eds.),
Statistics and Finance: An Interface, pp.
261–278.
Imperial College Press.
Granger, C.W.J. &
M.H. Pesaran
(2000b)
Economic and statistical measures of forecast accuracy.
Journal of Forecasting
19,
537–560.Google Scholar
Hendry, D.F. &
H.M. Krolzig
(2003)
New developments in automatic general-to-specific modeling. In
B.P. Stigum (ed.),
Econometrics and the Philosophy of Economics.
Princeton University Press.
Hoeting, J.A.,
D. Madigan,
A.E. Raftery, &
C.T. Volinsky
(1999)
Bayesian model averaging: A tutorial.
Statistical Science
14,
382–417.Google Scholar
Kass, R. &
A.E. Raftery
(1995)
Bayes factors.
Journal of the American Statistical Association
90,
773–795.Google Scholar
Koop, G.
(2003)
Bayesian Econometrics.
Wiley.
Leamer, E.E.
(1978)
Specification Searches: Ad Hoc Inference with Nonexperimental Data.
Wiley.
Litterman, R.B.
(1986)
Forecasting with Bayesian vector autoregressions: Five years of
experience.
Journal of Business & Economic Statistics
4,
25–38.Google Scholar
Pesaran, M.H. &
S. Skouras
(2002)
Decision-based methods for forecast evaluation. In
M.P. Clements and
D.F. Hendry (eds.),
A Companion to Economic Forecasting, pp.
241–267.
Basil Blackwell.
Pesaran, M.H. &
A. Timmermann
(1995)
The robustness and economic significance of predictability of stock
returns.
Journal of Finance
50,
1201–1228.Google Scholar
Pesaran, M.H. &
A. Timmermann
(2000)
A recursive modelling approach to predicting U.K. stock returns.
Economic Journal
110,
159–191.Google Scholar
Pesaran, M.H. &
A. Timmermann
(2002)
Market timing and return prediction under model instability.
Journal of Empirical Finance
9,
495–510.Google Scholar
Phillips, P.C.B.
(1995)
Automated forecasts of Asia-Pacific economic activity.
Asia-Pacific Economic Review
1,
92–102.Google Scholar
Phillips, P.C.B.
(2003)
Laws and limits of econometrics.
Economic Journal
113,
C26–C52.Google Scholar
Phillips, P.C.B. &
W. Ploberger
(1994)
Posterior odds testing for a unit root with data-based model
selection.
Econometric Theory
10,
774–808.Google Scholar
Schiff, A.F. &
P.C.B. Phillips
(2000)
Forecasting New Zealand's real GDP.
New Zealand Economic Papers
34,
159–182.Google Scholar
Stock, J.H. &
M. Watson
(2002)
Macroeconomic forecasting using diffusion indexes.
Journal of Business & Economic Statistics
20,
147–162.Google Scholar
Sullivan, R.,
A. Timmermann, &
H. White
(2001)
Dangers of data-driven inference: The case of calendar effects in
stock returns.
Journal of Econometrics
105,
249–286.Google Scholar
Wald, A.
(1947)
Sequential Analysis.
Wiley.
 You have
Access
- 36
- Cited by