Introduction
Encrusting calcifiers on coral reefs are comprised of diverse assemblages of bryozoans, calcareous algae, foraminiferans, polychaetes, barnacles and gastropod species that inhabit cryptic and exposed surfaces of reef structures (Garrett et al., Reference Garrett, Smith, Wilson and Patriquin1971; Martindale, Reference Martindale1976; Stearn et al., Reference Stearn, Scoffin and Martindale1977). Morphologically they are of low profile, with their basal surface cemented to the reef substrate (Mallela, Reference Mallela2007). These organisms play major roles on coral reefs: they stabilize coral fragments in the reef framework, enhance topographic complexity and contribute to CaCO3 deposition (Scoffin, Reference Scoffin1992; Gherardi & Bosence, Reference Gherardi and Bosence1999; Rasser & Riegl, Reference Rasser and Riegl2002). Although the important role of these organisms is well documented, few estimates of carbonate deposition by assemblages of encrusting calcifiers are available globally, with no data available for the Mexican Pacific.
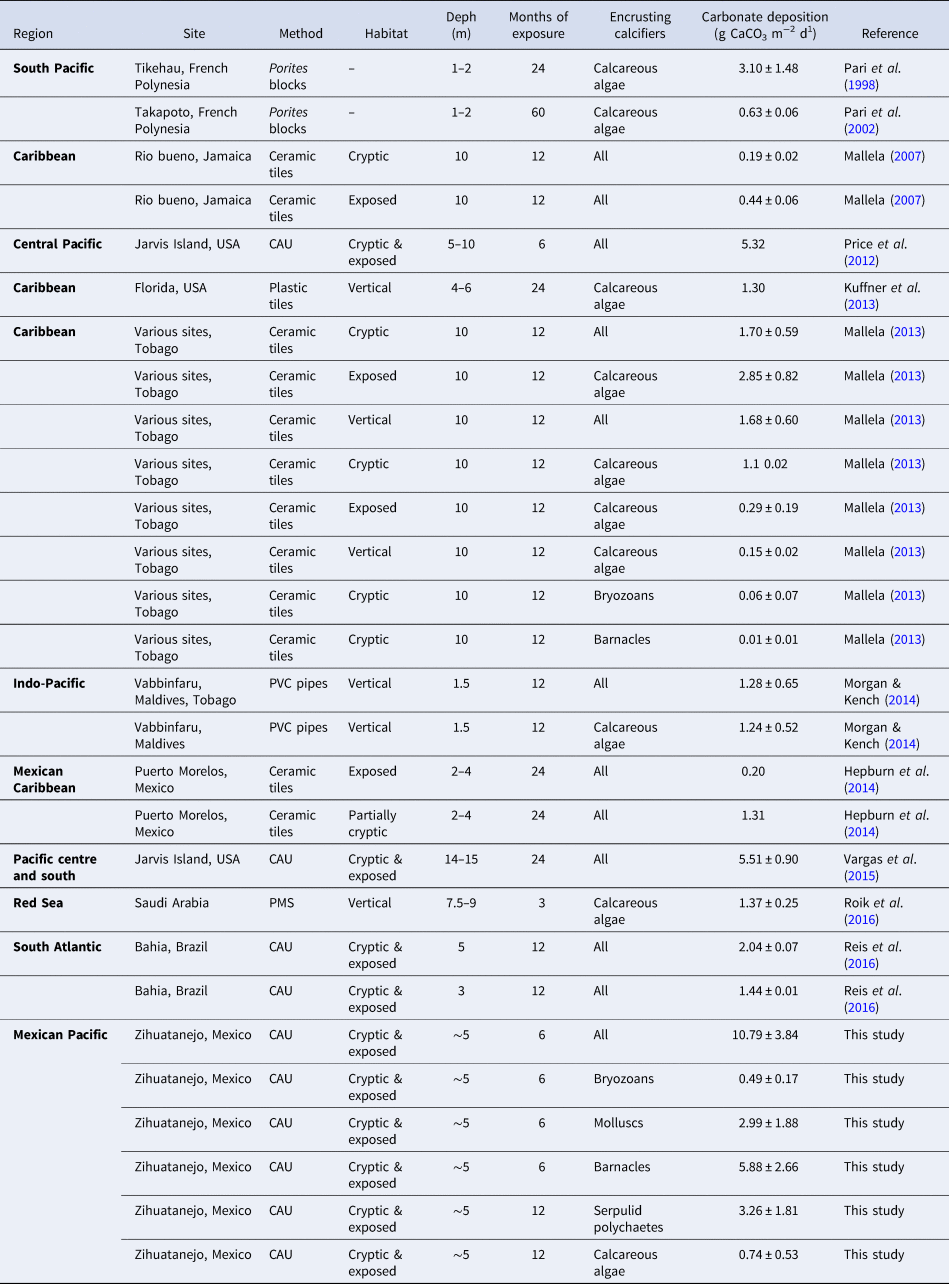
On coral reefs, the level of environmental exposure seems to be important for carbonate deposition by assemblages of encrusting calcifiers. At the level of microhabitat, for example, higher deposition of CaCO3 by encrusting calcifiers was documented in exposed habitats than in cryptic ones (Mallela & Perry, Reference Mallela and Perry2007; Mallela, Reference Mallela2013). Level of exposure seems to be related to light intensity (Steneck & Adey, Reference Steneck and Adey1976; Martindale, Reference Martindale1992; Björk et al., Reference Björk, Mohammed, Bjorklund and Semesi1995), sediment deposition (Fabricius & De'ath, Reference Fabricius and De'ath2001; Maughan, Reference Maughan2001; Azevedo et al., Reference Azevedo, Carloni and Carvalheira2006), water temperature (Vásquez-Elizondo & Enriquez, Reference Vásquez-Elizondo and Enríquez2016) and pH (Price et al., Reference Price, Martz, Brainard and Smith2012; Vargas et al., Reference Vargas-Ángel, Richards, Vroom, Price, Schils, Young, Smith, Johnson and Brainard2015). In the Caribbean for example, coral reefs affected by terrestrial runoff show low levels of carbonate deposition (Mallela, Reference Mallela2007). In the Pacific Ocean, high daily variation of pH was related to low levels of carbonate deposition in coral reefs (Price et al., Reference Price, Martz, Brainard and Smith2012). In this region, it is estimated that encrusting calcifiers produce between 1.24 and 5.51 g CaCO3 m−2 d−1 (Price et al., Reference Price, Martz, Brainard and Smith2012; Morgan & Kench, Reference Morgan and Kench2014; Vargas et al., Reference Vargas-Ángel, Richards, Vroom, Price, Schils, Young, Smith, Johnson and Brainard2015) while in the Caribbean it is estimated that carbonate deposition ranges between 0.20 and 2.85 g CaCO3 m−2 d−1 (Mallela, Reference Mallela2007, Reference Mallela2013; Kuffner et al., Reference Kuffner, Hickey and Morrison2013; Hepburn et al., Reference Hepburn, Blanchon, Murphy, Cousins and Perry2014).
Environmental degradation and climate change are related to coral reef decline around the world (Bryant et al., Reference Bryant, Burke, McManus and Spalding1998; Gardner et al., Reference Gardner, Côté, Gill, Grant and Watkinson2003; De'ath et al., Reference De'ath, Fabricius, Swetman and Puotinen2012). Extensive mass coral bleaching and coral mortality events have been documented in the Mexican Pacific as a result of the El Niño phenomenon (Reyes-Bonilla, Reference Reyes-Bonilla1993; Carriquiry et al., Reference Carriquiry, Cupul-Magaña, Rodríguez-Zaragoza and Medina-Rosas2001; Reyes-Bonilla et al., Reference Reyes-Bonilla, Carriquiry, Leyte-Morales and Cupul-Magana2002). In addition, excessive suspended sediments and organic pollution may enhance overgrowing and bioerosion of corals by sponges (Rützler, Reference Rützler2002). Due to the decline of corals on a global scale, the relative contribution of assemblages of encrusting calcifiers to the gross carbonate production of coral reefs is likely to increase (Morgan & Kench, Reference Morgan and Kench2014). Moreover, different approaches reported variation in carbonate deposition rates on artificial substrata emulating several microhabitats present in coral reefs (Price et al., Reference Price, Martz, Brainard and Smith2012; Hepburn et al., Reference Hepburn, Blanchon, Murphy, Cousins and Perry2014). The present study deals with the characterization of encrusting calcifiers settled on artificial surfaces and documents their contribution to carbonate deposition in four different microhabitats from coral reefs from Zihuatanejo, Guerrero, Mexico.
Materials and methods
Study area
Our study was performed at Zihuatanejo, Guerrero, Mexico along the coast of the southern Mexican Pacific (Figure 1A, Seaturtle.Org Maptool, 2002). A seasonal change in winds and currents occurs at this region: south-east winds and the Equatorial Counter Current prevail between May and August and south-east winds and the California Current influence this region between November and April. Monthly average temperature ranges between 18 and 32°C and the rainy season occurs from June to September (Semar-Digaohm, 2015). Coral reefs are located at two sites with different levels of anthropogenic impact. Playa Las Gatas (17°37′19.7″N 101°33′10.5″W), considered the most impacted coral community, is situated within the Zihuatanejo Bay, a tourist destination whose anthropogenic impact includes sewage outlets, urban development, anchoring, fishing and recreational snorkelling. This site harbours a less developed reef structure, with numerous coral colonies of Pocillopora verrucosa, P. capitata and P. damicornis that spread over a rocky substratum between 2 and 6 m depth and cover nearly 8% of the substratum. Several patches of dead coral matrix (15.1%) and coral rubble (9.3%) are another feature of this site. Islote Zacatoso (17°39′14.5″N 101°37′18.7″W) is considered well conserved because no obvious signs of extensive physical damage have been observed there. It is located outside the bay and has a well-developed reef structure, only visited by scuba divers and several fishermen. This locality harbours a well-developed reef framework between 1 and 10 m depth comprised mainly of P. damicornis and P. verrucosa that cover almost 66.6% of the substratum (Nava et al., Reference Nava, Ramírez-Herrera, Figueroa-Camacho and Villegas-Sanchez2014).
(A) Location of the study area: (PG) Playa Las Gatas and (IZ) Islote Zacatoso; (B) CAU (Calcification/Accretion Unit) after installation. The four surfaces exposed to the settlement of encrusting calcifiers are shown: (EUS) exposed upper surface, (CUS) cryptic upper surface, (CBS) cryptic bottom surface and (EDS) exposed underside surface.

Environmental characterization
To obtain a reference of the water quality at both sites, several critical environmental variables for coral survival were recorded (mean ± SD) in January, June and December 2015. Water transparency (m) was recorded on three consecutive days during each sampling period using standard Secchi disk depth measurements. The Secchi disk was tied to a nylon string and submerged to the maximum depth at which the disk was visible (Edinger et al., Reference Edinger, Jompa, Limmon, Widjatmoko and Risk1998). The depth was then recorded in a log, this procedure was repeated three times and data averaged per day and site. At the end of each sampling period, we get at least three averaged measures of water transparency per site. Water temperature (°C) and light intensity (lux) at 5 m depth above the bottom were recorded using a Hobo® temperature/light (waterproof) pendant data logger at each site. These devices were programmed to measure both parameters every 5 min during 72 h during each survey period. At the end of each survey all devices were collected and their temperature/light data recorded. All data collected of water temperature were averaged and data of light intensity were averaged from records made between 9:00 am and 3:00 pm. Sedimentation rate (kg m−2 d−1) was recorded using sediment traps. Traps consisted of 1-l plastic bottles (2.4 ratio of height to diameter, Carballo et al., Reference Carballo, Naranjo and García-Gómez1996). Six replicate traps were deployed 1 m above the substrate at a depth of 5 m at each site. Sediment traps were attached in pairs to three vertical PVC pipes (each 1 m long) anchored above the bottom of the reef. Sediments were collected over a period of 3–4 days and rinsed with fresh water at the laboratory prior to oven-drying and weighing (Cortés & Risk, Reference Cortés and Risk1985). To obtain the sedimentation rate, we used the following formula:
 $${\rm Sedimentation}\,{\rm (kg}\cdot {\rm m}^{-2}\cdot {\rm d}^{-1}{\rm )} = \displaystyle{{{\rm DW}} \over {(A\cdot d)}}$$
where DW = the dry weight of the sediments, A = the sediment catchment area (m2) of the traps, and d = the period (days) of sediment traps deployment.
Carbonate deposition by encrusting calcifiers
To record carbonate deposition on artificial surfaces (mean ± SD) we used Calcification/Accretion Units (CAUs, Figure 1B). Each CAU consisted of four PVC 100 cm2 surfaces (10 × 10 cm) stacked 1 cm apart in pairs and fixed to the reef framework (10 cm above the substrate and >1.0 m apart) with steel rods and marine epoxy plaster (N = 10 per site). Each CAU simplified four different microhabitats found in reef structures: exposed upper surfaces (EUS), facing up and fully exposed to light and sediment deposition; cryptic upper surfaces (CUS), facing down and protected from direct light and sediment deposition; cryptic bottom surfaces (CBS), facing up and protected from direct irradiance but exposed to sediment deposition and exposed underside surfaces (EDS), facing down and protected from direct light and sedimentation. Similar artificial surfaces have been successfully tested in experimental studies dealing with recruitment and carbonate deposition of encrusting calcifiers at the Central Pacific (Price et al., Reference Price, Martz, Brainard and Smith2012; Vargas et al., Reference Vargas-Ángel, Richards, Vroom, Price, Schils, Young, Smith, Johnson and Brainard2015) and the South Atlantic (Reis et al., Reference Reis, Karez, Mariath, de Moraes, de Carvalho, Brasileiro, da Gama-Bahia, da Cruz-Lotufo, Vieira-Ramalho, de Moura, Franchini-Filho, Pereira-Filho, Lopes-Thompson, Cardoso-Bastos, Tavares-Salgado and Amado-Filho2016).
All CAUs were deployed at 5 m depth over the bottom at each site in January 2015. After 6 and 12 months (June and December 2015), a set of five CAUs were collected and each surface was stored in a plastic bag and frozen until processing in a laboratory. Afterwards, each surface was submerged for 24 h in a solution of 4% chloride to eliminate organic matter and to clean calcareous structures. All surfaces were washed with distilled water and oven dried (70°C for 48 h). Encrusting calcifiers attached to surfaces were observed and identified with a stereoscopic microscope. All organisms were separated within five major groups: (Ca) calcareous algae, (Br) bryozoans, (Mo) molluscs (bivalves and gastropods), (Ba) barnacles and (Po) serpulid polychaetes. Carbonate deposited by each taxonomic group was scraped from each PVC surface and weighed with an analytical balance (± 0.001 g). The weight of this material was divided by both the area of the PVC surface and the number of days of deployment of CAUs, to calculate the rate of carbonate deposition (g CaCO3 m−2 d−1) per taxonomic group at each microhabitat and site. Carbonate material deposited by all taxonomic groups together on each surface we also used to calculate the overall rate of carbonate deposition per microhabitat and site.
 $${\rm Carbonate\ deposition}\,{\rm (gCaC}{\rm O}_{\rm 3}{\rm m}^{-2}{\rm d}^{-1}{\rm )} = \displaystyle{w \over {a{\cdot} t}}$$
Where w = dry weight of carbonate (g), a = area of CAU surface (m2), t = time of deployment of CAUs (days).
Data analysis
Data were analysed with R software version 3.3.2 (R Core Team, 2016). Environmental data did not meet the assumptions of normality and homoscedasticity (Kolmogorov–Smirnov test, Sokal & Rohlf, Reference Sokal and Rohlf1981) and were analysed using a series of non-parametric Kruskal–Wallis tests with Dunn's post-hoc comparisons to determine statistical differences among sampling periods and sites. Carbonate deposition rate was ln-transformed and thereafter a series of ANOVA and Student–Newman–Keuls post-hoc tests (Zar, Reference Zar1984) was performed to determine significant differences between sites, sampling periods, microhabitat and taxonomic groups. To evaluate the contribution of all taxonomic groups to carbonate deposition in all experimental surfaces, a tridimensional nMDS ordination and cluster classification analysis were developed constructing a Bray–Curtis similarity matrix (Bray & Curtis, Reference Bray and Curtis1957) based on the data of carbonate deposited per taxonomic group, which were square root-transformed and standardized beforehand (Warwick & Clarke, Reference Warwick and Clarke1991). Similarity percentages (SIMPER) analysis was performed to detect which taxonomic groups were responsible for these observed clusters (Warwick et al., Reference Warwick, Clarke and Suharsono1990; Clarke & Ainsworth, Reference Clarke and Ainsworth1993).
Results
Environmental characterization
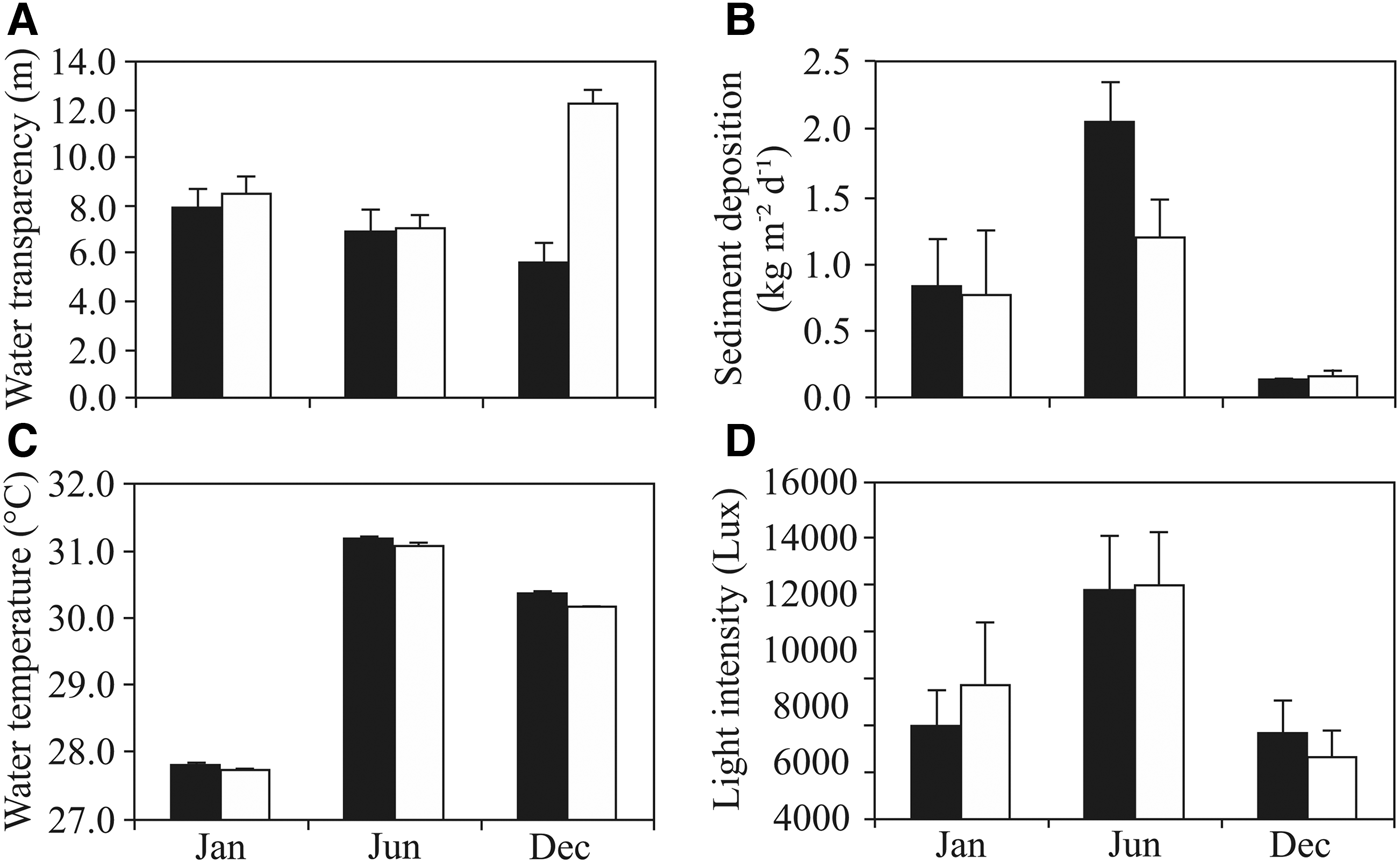
Environment data showed significant differences at each site with time (Figure 2). At Playa Las Gatas, for example, significant differences existed between sampling periods for water transparency (H = 11.37, P < 0.01). Post-hoc test confirmed that the highest transparency (mean ± SD) was recorded during January and the lowest during December (7.96 ± 0.78 m and 5.67 ± 0.78 m, respectively, P < 0.01). Similarly, at Islote Zacatoso significant differences were also observed between sampling periods (H = 19.44, P < 0.001). Post-hoc comparisons revealed that the highest record (mean ± SD) was made during December and the lowest during June (12.29 ± 0.60 m and 7.10 ± 0.56 m, respectively, P < 0.001). Water transparency also showed significant differences between sites (H = 12.80, P < 0.001). Post-hoc test indicated that these differences only occurred during December, when the highest record occurred at Islote Zacatoso (P < 0.001, Figure 2A). Sediment deposition showed temporal differences at both sites (H = 13.255, P < 0.01 for Playa Las Gatas and H = 13.947, P < 0.001 for Islote Zacatoso). Post-hoc tests indicated that sediment deposition (mean ± SD) was significantly higher in June than in December at both sites (Playa Las Gatas: 2.07 ± 0.29 kg m−2 d−1 vs 0.13 ± 0.02 kg m−2 d−1, P < 0.001 and Islote Zacatoso: 1.19 ± 0.28 kg m−2 d−1 vs 0.17 ± 0.06 kg m−2 d−1, P < 0.001). Only during June were there significant differences in sediment deposition between both sites (H = 6.708, P < 0.001), these being higher at Playa Las Gatas than at Islote Zacatoso (P < 0.01, Figure 2B). Water temperature showed significant differences during the study at both sites: Playa Las Gatas (H = 152.55, P < 0.001) and Islote Zacatoso (H = 128.58, P < 0.001). The highest records (mean ± SD) were made during June (31.18 ± 0.20°C, P < 0.001 and 31.08 ± 0.29°C, P < 0.001 respectively) and the lowest during January (27.81 ± 0.23°C, P < 0.001 and 27.75 ± 0.15°C, P < 0.001 respectively). Significant differences between sites were found only during December, when water temperature was higher at Playa Las Gatas than at Islote Zacatoso (H = 27.96, P < 0.001, Figure 2C). Light intensity showed temporal differences at both sites (H = 120.72, P < 0.001 for Playa Las Gatas and H = 81.362, P < 0.001 for Islote Zacatoso), with the highest records (mean ± SD) made during June (12,159.7 ± 2842.2 lux, P < 0.001 and 12,324.6 ± 2809.6 lux, P < 0.001 respectively) and with the lowest records made during December (7060.1 ± 2690.4 lux, P < 0.001 and 6172.9 ± 2676.6 lux, P < 0.001 respectively). No significant differences were detected between sites during the study (Figure 2D).
Environment variables recorded in Playa Las Gatas (black columns) and Islote Zacatoso (white columns) during (Jan) January 2015, (Jun) June 2015 and (Dec) December 2015. (A) Water transparency, (B) sediment deposition, (C) water temperature and (D) light intensity. The bars in the columns represent the standard deviation.

Carbonate deposition rate by encrusting calcifiers
Significant differences in carbonate deposition rate by encrusting calcifiers (mean ± SD) were found between sites. The rate was higher at Playa Las Gatas than at Islote Zacatoso during June (10.79 ± 3.84 g CaCO3 m−2 d−1 vs 2.95 ± 0.75 g CaCO3 m−2 d−1, F = 29.05, P < 0.001) and December (9.24 ± 2.59 g CaCO3 m−2 d−1 vs 2.01 ± 1.27 g CaCO3 m−2 d−1, F = 31.26, P < 0.001) (Figure 3A). At Playa Las Gatas, carbonate deposition rate among microhabitats also presented significant differences during June (F = 29.045, P < 0.001) and December (F = 31.26, P < 0.001). EDS showed the highest rate of carbonate deposition rate through this study and CBS the lowest. At Islote Zacatoso, only during June were there significant differences (F = 5.868, P < 0.01). The highest rate of carbonate deposition was recorded at CBS and the lowest at EUS (Figure 3B). The rate of carbonate deposition recorded per taxonomic group at Playa Las Gatas showed significant differences. During June (F = 41.35, P < 0.001) the highest contribution to carbonate deposition rate was made by barnacles and molluscs and the lowest contribution was made by calcareous algae and bryozoans. During December there were also significant differences among taxa, but more groups contributed to the highest rate of carbonate deposition. These were barnacles, serpulid polychaetes and molluscs while the lowest contribution was made by calcareous algae and bryozoans. At Islote Zacatoso there were significant differences in the rate of carbonate deposition among different taxa only during December (F = 5.93, P < 0.01). The major contribution was made by calcareous algae and serpulid polychaetes and less so by bryozoans (Figure 3C).
Averaged rate of carbonate deposition at both reefs during (J) June 2015 and (D) December 2015 for: (A) per site, (B) per surface and (C) per taxonomic group. (EUS) exposed upper surface, (CUS) cryptic upper surface, (CBS) cryptic bottom surface and (EDS) exposed underside surface. Groups: (CA) calcareous algae, (Br) bryozoans, (Mo) molluscs, (Po) serpulid polychaetes, (Ba) barnacles. The bars in the columns represent the standard deviation.

Variation in the contribution of calcifiers in time and space
Cluster, nMDS and SIMPER analyses helped to describe the contribution of different taxa to carbonate deposition rate among microhabitats (Table 1, Figure 4A).
Dendrogram of carbonate deposition of encrusting calcifiers based on group-average clustering using Bray–Curtis similarity (right) and 3d nMDS ordination (left) for (A) Playa Las Gatas and (B) Islote Zacatoso during (J) June 2015 and (D) December 2015. The y axis shows the similarity percentage (%). (EUS) exposed upper surface, (CUS) cryptic upper surface, (CBS) cryptic bottom surface and (EDS) exposed underside surface.

Average carbonate deposition rate (g CaCO3 m−2 d−1) of major encrusting calcifiers in groups A, B and C of Playa Las Gatas and contribution (i) to the average similarity within of each group (A = 85.83, B = 83.38, C = 83.00)

At Playa Las Gatas, group A (similarity of 85.83%) was comprised mainly of EDS, where barnacles (55.80% of contribution to the conformation of this group) maintained the highest rate of carbonate deposition during June and December. Group B (similarity of 83.38%) was comprised mainly of EUS and CUS sampled during December, where serpulid polychaetes (41.21% of contribution) showed the highest rate of carbonate deposition. Finally, group C (similarity of 83.00%) was comprised of EUS, CUS and CBS sampled during June, where molluscs (41.59% of contribution) showed the highest rate of carbonate deposition. Rate of carbonate deposition among groups at replicates of CBS sampled during December were highly heterogeneous, although both molluscs and serpulid polychaetes tended to be major calcifiers in this microhabitat.
At Islote Zacatoso, nMDS, cluster and SIMPER analysis showed three major groups (Table 2, Figure 4B). Group A (similarity of 75.36%) was comprised mainly of EUS sampled during June and December, where calcareous algae (55.71% of contribution) maintained the highest rate of carbonate deposition. Group B (similarity of 77.08%) was comprised of EDS sampled during June where barnacles (36.36% of contribution) presented the highest rate of carbonate deposition. Group C (similarity of 78%) was comprised of CUS and CBS sampled during June, where serpulid polychaetes (contribution of 29.82%) presented the highest rate of carbonate deposition.
Average rate of carbonate deposition (g CaCO3 m−2 d−1) of major encrusting calcifiers in groups A, B and C of Islote Zacatoso and contribution (i) to the average similarity within of each group (A = 75.36, B = 77.08, C = 78.43)

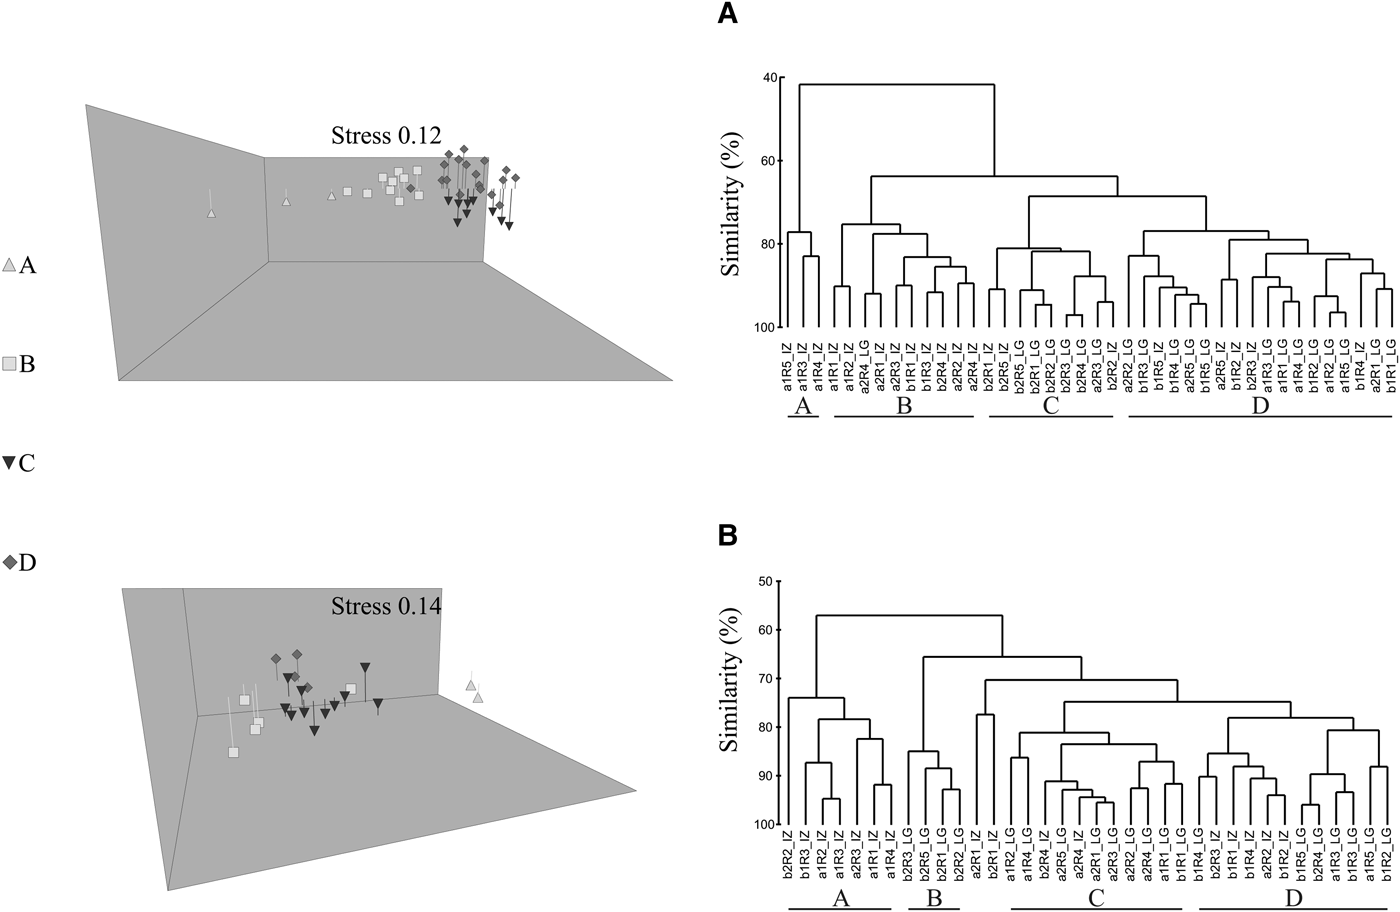
The same analysis made with samples from both sites showed four major groups during June (Table 3, Figure 5A). Group A (similarity of 79.09%) was comprised of EUS from Islote Zacatoso, where calcareous algae (81.91% of contribution) presented the highest rate of carbonate deposition. Group B (similarity of 79.91%) was comprised mainly of CUS from Islote Zacatoso, where serpulid polychaetes (contribution of 32.76%) showed the highest rate of carbonate deposition. Group C (similarity of 84.07%) was comprised mainly of EDS sampled at both sites and where barnacles (contribution of 52.93%) showed the highest rate of carbonate deposition. Group D (similarity of 80.63%) was comprised mainly of EUS and CBS from Playa las Gatas, where molluscs and barnacles showed the highest rate of carbonate deposition.
Average rate of carbonate deposition (g CaCO3 m−2 d−1) of major encrusting calcifiers in groups A, B, C and D formed at 6 months in Playa Las Gatas and Islote Zacatoso and contribution (i) to the average similarity within of each group (A = 79.09, B = 79.91, C = 84.07, D = 80.63)

Dendrogram of carbonate deposition of encrusting calcifiers based on group-average clustering using Bray–Curtis similarity (right) and 3d nMDS ordination (left) for (PG) Playa Las Gatas and (IZ) Islote Zacatoso during (A) June 2015 and (B) December 2015. The y axis shows the similarity percentage (%). (EUS) exposed upper surface, (CUS) cryptic upper surface, (CBS) cryptic bottom surface and (EDS) exposed underside surface.

During December, such multivariate analyses also detected four major clusters (Table 4, Figure 5B). Group A (similarity of 79.09%) was comprised of EUS from Islote Zacatoso, where calcareous algae presented the highest rate of carbonate deposition (contribution of 54.99%; Table 5). Group B (similarity of 87.41%) was comprised of EDS from Playa Las Gatas, where barnacles (contribution of 54.89%; Table 5) presented the highest rate of carbonate deposition. Group C (similarity of 85.02%) was comprised of EUS and CUS from Playa Las Gatas, where serpulid polychaetes (contribution of 44.00%; Table 5) presented the highest rate of carbonate deposition. Group D (similarity of 81.89%) was comprised mainly of CBS from both sites where molluscs showed the highest rate of carbonate deposition (contribution of 34.19%; Table 5).
Average carbonate deposition rate (g CaCO3 m−2 d−1) of major encrusting calcifiers in groups A, B, C and D formed at 12 months in Playa Las Gatas and Islote Zacatoso and contribution (i) to the average similarity within of each group (A = 79.77, B = 87.41, C = 85.02, D = 81.89)

Average rate ( ± SD) of carbonate deposition (g CaCO3 m−2 d−1) recorded on both reefs for all taxa of encrusting calcifiers at each microhabitat during June 2015 (J) and December 2015 (D). (EUS) exposed upper surface, (CUS) cryptic upper surface, (CBS) cryptic bottom surface and (EDS) exposed underside surface

Discussion
Our study confirms the importance of encrusting calcifiers for carbonate deposition on coral reefs from Mexican Pacific coast. Previous records of carbonate deposition at other locations are even lower than the lowest records of 2.01 g CaCO3 m−2 d−1 made at Zihuatanejo. Since some of these records have been made at well-conserved reefs, it is important to be careful with comparisons, since carbonate deposition by encrusting calcifiers at both contrasting conditions (conserved vs degraded reefs) seems to be occur on a different scale (Table 6). At well conserved coral reefs, good water quality have been related to high levels of carbonate deposition (Mallela, Reference Mallela2007, Reference Mallela2013). As an example, at Rio Bueno, in the Caribbean, the highest rates of carbonate deposition were recorded on ceramic tiles at sites with good water quality (between 0.13 and 0.54 g CaCO3 m−2 d−1). Such records were made where sedimentation rates were lower than 0.1 g m−2 d−1 and water transparency was higher than 18 m (Mallela, Reference Mallela2007). Reis et al. (Reference Reis, Karez, Mariath, de Moraes, de Carvalho, Brasileiro, da Gama-Bahia, da Cruz-Lotufo, Vieira-Ramalho, de Moura, Franchini-Filho, Pereira-Filho, Lopes-Thompson, Cardoso-Bastos, Tavares-Salgado and Amado-Filho2016), on other hand, reported carbonate deposition rates between 1.19 and 2.04 g CaCO3 m−2 d−1 on cryptic and exposed surfaces of PVC CAUs at Bahia, Brasil in South Atlantic. They also reported the highest records at sites with low sedimentation rates. At the Eastern Pacific, Price et al. (Reference Price, Martz, Brainard and Smith2012) and Vargas et al. (Reference Vargas-Ángel, Richards, Vroom, Price, Schils, Young, Smith, Johnson and Brainard2015) reported records of carbonate deposition between 5.32 and 5.51 g CaCO3 m−2 d−1, respectively in CAUs similar to those used in our study at well conserved reefs from Jarvis Island, EUA. Nonetheless, carbonate deposition rates recorded at these well-conserved sites (including records from Islote Zacatoso), tend to be lower than records made at Playa Las Gatas, the site with low water transparency and more intense sediment deposition. While sites with high water quality often coincide with high levels of light intensity and carbonate deposition at exposed surfaces (Mallela, Reference Mallela2013), at sites with low water quality (e.g. caused by high sedimentation, phytoplankton productivity, dissolved organic matter and nutrient concentrations) a different situation seems to occur: highest rates are recorded at cryptic microhabitats.
Summary of carbonate deposition rates (g CaCO3 m−2 d−1) by encrusting calcifiers recorded on different experimental surfaces throughout the world. Method: CAU (Calcification/Accretion Unit), PMS (Plastic Microscopic Slides). ‘All’ includes calcareous algae, bryozoans, molluscs, serpulid polychaetes and barnacles
At Playa Las Gatas, calcareous algae and bryozoans showed the lowest rates of carbonate deposition. This site is highly impacted by spill-out of residual waste water from the north side of Zihuatanejo Bay (Izurieta et al., Reference Izurieta, Saldaña, Inclan, Sánchez, Ordoñez, Ruiz, Mijangos, Cortes, Morales, Pérez, Vélez, Ramírez, Mejía, Botello, Páez-Osuna, Mendez-Rodríguez, Betancourt-Lozano, Álvares-Borrego and Lara-Lara2014) and such conditions have been related to low cover of reef corals, high cover of filamentous algae and high phytoplankton concentrations. The exposure of this site to continuous anthropogenic impact accounts for permanent low levels of water transparency, although these stressful conditions are more pronounced during summer, when the rainfall generates more intense runoff that carries sediments from the land (Nava et al., Reference Nava, Ramírez-Herrera, Figueroa-Camacho and Villegas-Sanchez2014). At this site, the highest rate of carbonate deposition was exerted by barnacles and molluscs during the first 6 months at EDS. Both invertebrates are rapid colonizers. In the case of barnacles, larvae settlement may take place after only several minutes of collector deployment (Geraci et al., Reference Geraci, Amrhein and Goodson2008). Additionally, EDS, exposed to water currents but not to sedimentation, may be an ideal microhabitat for rapid settlement of larvae with passive filtering behaviour. After 12 months of CAUs exposure, when sedimentation decreased and water transparency rose, carbonate deposition increased at EUS and CUS by the same taxa, with serpulid polychaetes arriving as late colonizers. Marine invertebrates with filter feeding behaviour could benefit from a high supply of suspended material (e.g. phytoplankton) that results in individuals of higher size than others from less productive areas (Sanford & Menge, Reference Sanford and Menge2001). Such environmental settings are expected to influence the development of encrusting calcifiers that consume dissolved nutrients and particulate organic matter from the water column and hinder the development of photosynthetic organisms that would have benefited from a more clear water column (Fischer et al., Reference Fischer, Krupp, Scheider, Sommer, Carpenter and Niem1995; Courtenay et al., Reference Courtenay, Gladstone and Schreider2005). In fact, at sites with a high load of organic matter and nutrients, barnacles may contribute almost 6 kg m−2 of calcareous material after only 44 days of growth (Geraci et al., Reference Geraci, Amrhein and Goodson2008).
In the opposite situation, CAUs from Islote Zacatoso showed that calcareous algae and serpulid polychaetes were major contributors of deposited carbonate at EUS throughout 12 months. Sites with high water quality often coincide with high levels of light irradiance and with dominance of calcareous algae at exposed surfaces (Mallela, Reference Mallela2007). At this site, early colonizers that deposited more carbonate at cryptic surfaces during June 2015 were barnacles and serpulid polychaetes. Both cryptic taxa may be protected from clogging and sediment burial by growing in cryptic habitats whose orientation prevents the settlement of sediment. In serpulid polychaetes, it is known that their preferred habitats are the more cryptic surfaces (Hepburn et al., Reference Hepburn, Blanchon, Murphy, Cousins and Perry2014). Such taxa exert a very important role on under-surfaces of coral reefs, where their filtering activity may concentrate high amounts of organic matter from the water column that may be liberated as organic enriched pseudo faeces that can be horizontally transported by water currents (Brock & Smith, Reference Brock and Smith1983). As was reported by Mallela (Reference Mallela2013) in the Caribbean, calcareous algae showed the highest contribution at well-illuminated exposed surfaces and both serpulid polychaetes and bivalves showed the highest contribution at cryptic surfaces. Besides, Hepburn et al. (Reference Hepburn, Blanchon, Murphy, Cousins and Perry2014) noted that carbonate production of serpulid worms recorded on ceramic tiles was also negatively correlated to sediment exposure and seemed to prosper at sites with high energy and low sediment conditions. Thus, our results agree in that the conservation state of reefs influences the composition of the structure of the encrusting community.
The present study also reaffirms that the contribution to carbonate deposition by encrusting calcifiers is different across distinct levels of environmental exposure (e.g. cryptic and exposed microhabitats) and that such contribution also is highly influenced by water quality. As with pocilloporid corals, whose contribution to carbonate deposition is near 143 g CaCO3 m−2 d−1 at well-conserved reefs (Medellín-Maldonado et al., Reference Medellín-Maldonado, Cabral-Tena, López-Pérez, Calderón-Aguilera, Norzagaray-López, Chapa-Balcorta and Zepeta-Vilchis2016), the contribution of encrusting calcifiers seems to be comparatively low again, according our data and previous studies (Table 6). Nonetheless, assemblages of calcifying invertebrates seem to be highly relevant in degraded reefs, where coral coverage is usually low. Such results indicate that carbonate sequestration continues even at coral degraded reefs where corals have been decimated. Under the present scenario of global marine ecosystems degradation, this assumption must be considered during the analysis of the balance of reef accretion.
Acknowledgements
We would like to thank Thierry Durand and Capitan ‘Chilolo’ for the logistical support provided during the sampling. Roberto Dominguez ‘Bob’ helped in correcting the English text.
Financial support
This work was supported by the following sources of funding: CONACYT-SEP No.CB-2012-01-177537 and the Scientific Research Coordination of the Universidad Michoacana de San Nicolás de Hidalgo.