


Introduction
The equilibrium lee drifts at snow fences having similar structures are scaled in proportion to fence heights, even in outdoor 1 : 30 scale model experiments (Reference TablerTabler, 1980a; Reference Nohara and TakeuchiNohara and Takeuchi, 1981), and in 1:100 scale (Reference AnnoAnno, 1987) and 1:44 scale (Reference lversenIversen, 1980) wind-tunnel experiments, using respectively activated clay and glass spheres to simulate snow. Up-wind drift is not scaled to fence height (Fig. 1). In warmer regions, up-wind drifts are larger, and their up-grade angles are steeper, than in colder regions. The cross-sections of drifts, and the wind-velocity profiles around fences, were observed as a means of investigating snow-collection mechanisms.
The maximum snow-retention capacities and lee-drift lengths have been studied in relation to the design and positioning of fences since the early experiments of Finnery (1934). Fence length is proportional to height, and the maximum snow capacity of the fence is found to be proportional to the square of the height in 50% density fencing and equilibrium lee drift in Wyoming, U.S.A. (Reference TablerTabler, 1980b). The snow-retention capacity and the length of lee drift for any fence are required to be shown as functions of depth of snow cover for each fence height and snow density. Three equilibrium drifts were measured, at a horizontal-slat fence and two porous plate-type fences, in Hokkaido, Japan.
Comparison of drifts formed by 1:30 and 1:100 scale model fences with full-scale data.

Cross-Sections of Drifts
Trenches were dug perpedicular to equilibrium snowdrifts against fences to observe the drift-forming process. The cross-section of up-wind drift is found to have the form of a regular multi-layered structure, except in the region closest to a fence, as shown in Figure 2a. However, disordered snow structure is observed in lee-drift cross-sections (Fig. 2b).
Wind Profiles of Snow Fences
The wind pattern around a snow fence can be observed by using smoke candles. The air stream made visible by smoke (Fig. 3) characteristically shows undisturbed flow to windward and diffused flow on the lee side of a fence.
Anemometers were attached to a pole at five different levels, from 25 and 275 cm above ground and these measured wind speed periodically for distances 30 m windward and 30 m leeward of each fence. The 1 m levels of wind speed, measured at 30 m windward of the fence, were taken as standard for the wind profiles shown in Figure 4. Gradual divergence of equal wind-speed curves for positions to windward within the drift area suggests that surface shear stress decreases as a fence is approached.
The surface shear stress, τ, is given by

where du/dz is the gradient of vertical wind velocity, γ is the air density, and l is Prandtle’s mixing length (Reference PlandtlePlandtle, 1925).
Threshold Wind Speed
The threshold wind speed for relocation of deposited particles, i.e. the static threshold, is dependent upon the physical characteristics of the snow and on weather conditions. The threshold wind speed for saltation, known as the dynamic threshold, also depends upon snow conditions in relation to air temperature, as indicated by curve I in Figure 5. However, the threshold for suspension of particles is less dependent upon snow and weather conditions. The intermittent threshold for suspension, observed in neutral atmospheric conditions in Hokkaido and indicated by curves II and III in Figure 5, is continuous.
To windward, saltating snow particles are deposited in front of a fence, where surface shear stresses fall below the dynamic threshold, and grow into a snowdrift. Because of the dependence of threshold surface-shear stress and drift-snow transport (Reference TakeuchiTakeuchi, 1980) on snow conditions, the shapes of up-wind drifts and their size relationship to lee drifts differ and therefore they are not scaled to fence height. Most saltating particles which pass through a fence bottom gap are transformed into suspended particles in turbulent eddies behind that fence. The snow wave patterns formed by the eddies behind lee drifts are shown in Figure 2b. It can be seen that suspended snow particles tend to settle in a sheltered area behind a fence and form a lee drift.
As the threshold wind speed for suspension is not dependent upon snow conditions, and a shelter pattern behind a fence is approximately scaled to fence height, lee drifts are consistently similar to each other and are scaled to fence height, even in small-scale models.
Drift Length and Snow-Retention Capacity of Equilibrium Lee Drifts
The lengths and snow-retention capacities of equilibrium lee drifts have been given as functions of fence height for 50% fence density by Reference TablerTabler (1980b). Both length and snow-retention capacities are required to be shown as functions of fence height, fence density, and depth of snow cover. High-density fences (60–80%) are used under deep snow-cover conditions. The lee-drift lengths shown in Figure 6 are from data measured in Hokkaido and Wyoming (Reference TablerTabler, 1987).
Cross-section of up-wind drift shows regular multi-layered structure. Cross-section of a lee drift showing disruption of regular structure.

Air stream, made visible by smoke, shows undisturbed flow in the up-wind direction and diffused flow on the lee side of a fence.

Lengths of lee drifts are approximated by

where L is length of lee drift, D is density of fence, H is fence height, and Hs is depth of snow cover.
Curves of equal wind-speed values around 2.75 m tall, porous 75% density fence with a 15 cm bottom gap.

Dynamic threshold wind speed for saltation related to temperature = curve I. Intermittent threshold for suspension = curve II. Continuous threshold = curve III (Reference TakeuchiTakeuchi and others, 1985).

Length of equilibrium lee drifts is represented both by the height and density of a fence, and by the depth of snow cover.

Maximum snow-retention capacity is represented by the cross-sectional area of equilibrium drifts. Cross-sectional areas of equilibrium lee drifts are shown in Figure 7, and have been derived using data from Figure 6 and from Reference TablerTabler (1980).
Areas of lee drifts above 50% are approximated by

Measured data yield relationships that agree well with Equations (2) and (3), in spite of differences in weather conditions, types of fence, and fence densities. Maximum snow-retention capacity of up-wind drift is found to be 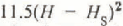 in Hokkaido and 3.6H2 in Wyoming. Half of the total snow volume is observed to pile up to windward of Hokkaido standard fences. For a tall fence, collecting a large quantity of snow on both the windward and lee sides, drift can be controlled to a small extent in the early stages of drifting. Sometimes, in Hokkaido, tall dense fences with a narrow bottom gap are used for shortening the length of the drift.
Conclusion
Cross-sectional area of equilibrium lee drifts is represented by both the height and density of a fence, and by the depth of the snow cover.

There are two different snow-collection mechanisms for a snow fence. To windward, saltating snow particles settle out of the air and suspended particles settle down in a sheltered area behind the fence. The lengths and cross-sectional areas of equilibrium lee drifts are shown as a function of both the height and density of the fence, and of the depth of snow cover. As threshold wind speed and drift-snow transport for saltation each depend on snow conditions, such a relationship cannot be obtained for up-wind drifts.
Acknowledgements
The author wishes to acknowledge the help of Mr K. Yasuda of Toha Steel Co. Ltd and Mr Y. Kaneda of the Japan Weather Association with his field work.



