Introduction
Over the first decade of the 21st century, biofuels acquired a highly positive image in the US. On this multidimensional image, domestically produced biofuels reduce the dependence of the US on imported petroleum from unreliable foreign sources and lower consumption of fossil fuel energy sources, thereby cutting emissions of greenhouse gases (GHG), creating jobs in rural America where most biofuels plants are located, and raising farm incomes by creating a second market (besides food/feed) for corn. This image of biofuels as contributing to core nationwide goals of energy security and economic growth and development has been nurtured by the renewable fuel industry, farm organisations and elected politicians. The success of this image has resulted in government subsidies, tax credits and blending mandates for biofuels and a resulting exponential growth in the production and consumption of biofuels since 2005.
The positive image of biofuels was rebutted by events in 2007–2008 that saw a sharp rise in world food prices for basic staples like corn, wheat, rice and vegetable oils. Biofuels mandates, which had positive effects notably by increasing demand for and revenue from food crops like corn, were also perceived to have negative effects. The latter included increasing food costs at home by raising feed costs for livestock producers and escalating food prices and food insecurity in the global South. Simultaneously, scientific studies suggested that biofuels’ contribution to GHG savings was modest and their effects on land use deleterious. In the US, this negative counter image of biofuels was promoted by a broad coalition under the banner of “Food Before Fuel” that included environmental groups, petroleum companies, food industry processors and retailers, and hunger groups.
Despite the wide media publicity it garnered, the negative image of biofuels had very little negative impact on US policies that promote biofuels. The US government extended and enhanced its incentives for biofuels research, production and consumption. New regulations to require environmental performance standards of biofuels applied only to future plants, not those already in existence.Footnote 1 The only nod to the negative image of biofuels was to create incentives for biofuels to be produced from non-food sources.
The American biofuels case affords lessons for governments of the conditions under which severely attacked public policies can endure, and gives us insight into the important puzzle of explaining policy change as addressed by punctuated equilibrium (PE) theory (Baumgartner and Jones Reference Baumgartner and Jones2009 [1993]). PE theory argues that transformative policy change becomes possible when a focusing event undermines the credibility of the existing policy image, heightens public and policymakers’ attention, and, with a shift in decision-making power to a new venue supportive of the new policy image, results in the loss of authority of the policy subsystem actors that had a monopoly on policy making. In laying out these conditions for transformative policy change, PE theorists have also recognised that dominant policy images do not always succumb to pressures of focusing events/crises, nor do policy entrepreneurs always succeed in their efforts to exploit focusing events and alternate policy venues to delegitimise an existing policy image and replace it with another image. Hence the question: if monopolistic policy subsystems and policy images sometimes survive and prove resilient, what allows them to do so?
An answer to this question directs attention to the strategies of political actors who turn to alternate venues, as well as those available to political actors within the monopolistic policy subsystem. The former, dealt with elsewhere, highlights the attributes of alternate venues that make them efficacious venues for shopping strategies, as well as the factors that affect advocacy groups’ choices of alternate venues (cf Pralle Reference Pralle2003). In this paper, the focus is on the opponents of policy change, that is, those who benefit from the policy status quo and who seek to maintain the monopolistic policy subsystem and policy image that support existing policies. The question under investigation is the following: what enables a monopolistic policy subsystem to successfully resist those who challenge existing policy images and who have recourse to alternate venues of authoritative decision making?
In answer to this question, this paper posits three factors that contribute to policy image resilience. The first is the congruence of a policy image with core values of the polity; the second, the multidimensionality of a policy image; and the third, the success of the policy image management strategies of subsystem political actors in maintaining cohesion among coalition supporters and responding to extra-coalition actors’ criticisms. These three factors, it is argued, explain why delegitimising focusing events do not always undermine a monopolistic policy image and policy subsystem.
To develop and provide an early test of its argument, the paper proceeds in four parts. Part I presents the theoretical argument of the paper. It reviews PE's account of policy development and change and identifies three factors that explain why policy monopolies are sometimes able to persist despite bombardment from negative policy images and mobilised critics. Part II details the development of the American biofuel policy monopoly through to an assault of the biofuel policy image from 2008 onward. Part III provides empirical support for the argument using qualitative and quantitative methods. Part IV concludes.
Theories of policy change: explaining unsuccessful policy loser mobilisation
The PE framework advanced by Baumgartner and Jones (Reference Baumgartner and Jones2009 [1993]) is one of the foremost accounts of how and when public policies change. Building on Kingdon's (Reference Kingdon2003 [1984]) attention to policy entrepreneurs and focusing events in bringing about transformative policy change, Baumgartner and Jones elaborated the crucial role of policy images and policy venues. Policy images represent public understanding of a policy, which are used by actors within the policy-making arena to communicate the goals and the meaning of a policy. They frame policy debates by identifying problems and solutions, drive actors to pursue common goals by providing the rationale for political action (Schön and Rein Reference Schön and Rein1994; Baumgartner and Jones Reference Baumgartner and Jones2009 [1993], 239) and serve as a common cognitive reference point for subsystem actors communicating with the general public and other political elites. In short, policy images are the bedrock of policy legitimacy. Policy venues are arenas of authoritative decision making, such as Congressional committees, courts or local and state legislatures (Baumgartner and Jones Reference Baumgartner and Jones2009 [1993], 32).
According to PE theory, images and venues interact to heighten the saliency of an issue. This process is driven by policy entrepreneurs who use negative or positive policy images and exploit favourable venues to push for their goals. Once policy entrepreneurs succeed and public and media attention settles, policy monopolies allow newly empowered policy actors, comprised of elected officials, knowledge-based experts, interest group representatives and public servants, to pursue their policy goals, checked only by routine monitoring of the political system. But the quiet exercise of policy decisions under the radar is eventually compromised, and Baumgartner and Jones turn to Schattschneider's (Reference Schattschneider1960) expanding scope of conflict thesis to explain why policy monopolies are subsequently broken. Actors excluded from the policy monopoly – policy losers – will typically seek to tip the balance of power by mobilising the politically apathetic. By including large numbers of favorably biased members of the public within the policy-making arena, policy losers will be in a better position to achieve their goals and, in the process, break up the closed policy monopoly.
Baumgartner and Jones (Reference Baumgartner and Jones2009 [1993], 18) recognised the need to study the “points at which a […] subsystem changes from negative to positive feedback”; that is, from self-correcting processes that induce stability and incrementalism to processes that reinforce pressures for change. Focused on policy-making episodes associated with the creation and the destruction of policy monopolies, PE theory explains the inability of policy losers to break open a policy monopoly despite the opportunistic use of focusing events/crises and the skilful exploitation of negative images on policy losers’ failure to find allies in an alternate policy venue who support their negative policy image. Whatever its merits, accounting for the persistence of negative feedback mechanisms by pointing to the failure of policy challengers to find a sympathetic alternate policy venue overlooks other factors that we argue are also important in explaining why policy losers are not always successful at breaking open policy monopolies. More specifically, a fuller account of the factors that contribute to the persistence of policy monopolies requires attention to policy image resilience and the related practice of policy image management.
Policy image resilience is defined as the capacity of a policy image embedded within a policy monopoly to respond effectively to criticism from competing policy images. Resilience can entail rejecting or fending off attacks, but it can also entail integrating external criticism into the understanding of the policy issue. Policy image resilience is enhanced by three main factors: (1) the congruence of a policy image with core values of the polity, (2) its coherent integration of multiple issue dimensions and (3) the practice of policy image management.
The first factor, proximity to core values of the polity, was originally put forward by Baumgartner and Jones (Reference Baumgartner and Jones2009 [1993], 6–9). The basic idea is that policy images that link widely shared values with their policy goals create manoeuvreing room for policy monopolies. Core values are “such things as progress, participation, patriotism, independence from foreign domination, fairness, economic growth – things no one taken seriously in the political system can contest” (Baumgartner and Jones Reference Baumgartner and Jones2009 [1993], 7).
This “taken-for-granted-ness” of core values has, however, received insufficient attention by scholars using PE theory. Other scholars (Majone Reference Majone1989; Blyth Reference Blyth2001; Cox Reference Cox2001) have used expressions such as “fit” or “resonance” with “value structure” or “widely shared beliefs” to convey the same idea that policies must relate to what can short-handedly be called “national identity”. But most social science scholars would agree today that “national identity” is not static, but rather evolves. Historical symbols are constantly mobilised to answer the problems of the day. Therefore, the mobilisation of core values, we argue, must resonate in a politically meaningful way with current national concerns – that is, the political agenda of the last few years – in order to be effective. This link between longstanding values and current national concerns – a mix of old and new containing “imprints of the past” (Merrien Reference Merrien1997; Schmidt Reference Schmidt2011, 45, citing) – creates a sense of continuity in the polity, and this sense of continuity and belonging to the polity is a precious source of policy legitimacy.Footnote 2
Multidimensionality is a second factor enhancing policy image resilience and one that PE theorists have overlooked. It refers to the diversity of rationales that comprise the policy image. Drawing on several potential lines of argumentation enhances monopolistic subsystem actors’ capacity to defend their policies against outside criticism by rejecting counter-images or claiming that they take into account some of their ideas.
Citing other policy scholars, Pralle (Reference Pralle2006, 15–23) has argued that conflict containment is facilitated by an issue definition that is “narrow, isolated and limited”, but once the scope of conflict is broadened, policy images that integrate several rationales are better equipped to win the battle.Footnote 3 When the focus of attention is heightened, the multidimensionality of policy images becomes a key advantage, because it provides subsystem actors with richer rhetorical resources.
Multidimensionality is an asset in the context of a “Schattschneider mobilization” because of venue shopping and shifts in “national mood” (Kingdon Reference Kingdon2003 [1984]). From the point of view of monopolistic actors, multidimensionality is a hedge against this political risk. When policy losers seek to shift policy-making venues or take advantage of a change of focus (Jones Reference Jones1994), adaptability becomes an advantage. Policy images that constitute a rich pool of arguments can be “used in different policy contexts for different strategic purposes” (Radaelli and Schmidt Reference Radaelli and Schmidt2004, 367; see also Häusermann Reference Häusermann2010).
The realisation of such a coherent and consistent discourse depends on the adoption of a policy image by all the policy actors comprising the coalition of interests involved. However, a multidimensional policy image may create a loose coalition whose interest group members each base support for a policy on different arguments. For example, nuclear policy can be supported by several arguments. But, if the scientific community publicly defends nuclear policy by using arguments related to innovation, the utilities industry by using energy independence, and elected officials by using national competitiveness, the supportive discourse will lack coherence and consistency. Thus, if policy images are truly multidimensional, we should be able to observe the use of the same integrated set of rationales across all interest group actors comprising the supportive coalition. This observation would correspond to the effective mutation of a “coordinative discourse”, elaborated between disparate coalition actors behind closed doors into a viable “communicative discourse” used to persuade the wider public of the appropriateness of the policy (Schmidt Reference Schmidt2002).
The third factor contributing to policy resilience is the practice of policy image management. While PE theory gives a preeminent place to agency in order to explain punctuated change, it seems to abandon the role of agency once these dramatic policy changes are adopted. Policy entrepreneurs establish policy monopolies by using windows of opportunity, or they displace policy monopolies by engaging in effective venue shopping. But, who prevents policy monopolies from being displaced when focusing events bring them into the spotlight? We argue that, in order to explain these instances of “failed punctuated change”, scholars of the policy process need to enquire into the practice of policy image management.
Policy image management is a form of collective agency practiced by the supportive coalition of monopolistic subsystem actors. It consists of policy actions and political messages that shore up support for the policy image. These actions and messages are directed towards actors either inside or outside of the supportive coalition. Actions directed towards actors inside the supportive coalition seek to maintain consensus among monopolistic actors. This internal consensus has to be proactively managed as circumstances evolve (Pross Reference Pross1992, Chapter 6; see e.g. Wyszomirski Reference Wyszomirski1998, 522–523). Mutual adjustments of policy positions have to be made internally in order to show a “united front” externally (Lindblom Reference Lindblom1965). This outcome is achieved by using “coordinative discourse”, a way of exchanging arguments that forges a collective understanding through the use of a common vocabulary and a common set of substantive ideas (Schmidt Reference Schmidt2002). For example, a recent study of central banking reform in Turkey highlights this role of a policy entrepreneur/mediator who exerts his influence to resolve conflicts within and among policy communities (Bakir Reference Bakir2009, 574).Footnote 4
Policy image management directed towards actors outside of the supportive coalition conveys the impression that monopolistic actors are taking into account the current criticism. These actions and messages are less designed to persuade policy losers, who are hostile to monopolistic actors, than they are aimed at convincing the general public and Congress that monopolistic actors are taking “responsible action”. To do so, monopolistic actors use “communicative discourse” (Schmidt Reference Schmidt2002) and adjust policy instrument “settings” and/or change policy instruments (Hall Reference Hall1993). Such “managed gradualism” was observed by Chaqués and Palau (Reference Chaqués and Palau2009, 114) in Spain's pharmaceutical policy and by Coleman et al. (Reference Coleman, Skogstad and Atkinson1996) in American, Canadian and Australian agricultural policies. Its purpose is to buy time until the media storm settles and attention levels towards the subsystem recede to a pre-crisis level.
Directing attention to the three factors that contribute to policy image resilience – the congruence of a policy image with core polity values and current national concerns, the multidimensionality of a policy image and policy image management – give us purchase on the strategies available to monopolistic subsystem actors to avoid a shift from self-correcting negative feedback to a positive feedback dynamic during periods of attacks on their policy image.
American biofuel policy development
Biofuel policy in the US can be divided into three sequential phases of a nascent policy subsystem (1970s–2000), a policy monopoly (2000–2008) and an assaulted policy monopoly (since 2008).
The nascent subsystem phase (1970s–2000) is characterised by the establishment of the necessary building blocks for the development of the biofuel industry. It laid the groundwork for future development by instituting tax credits and research and development (R&D) capacity. The oil crises of the early 1970s gave the initial impetus to biofuels by boosting the political will to act on the issue of foreign oil dependency. Part of President Carter's National Energy Plan was the 1978 Energy Tax Act, which created a tax credit for the blending of 10 per cent ethanol with regular gasoline (Congressional Research Service 2006, 104). Government-funded R&D, necessary to develop second-generation renewable fuels made from non-edible sources (as opposed to first-generation ethanol made from corn or sugarcane and biodiesel made from soy beans or canola), was provided for in the Energy Policy Act of 1992. It authorised the Department of Energy (DoE) to establish a first stage R&D programme with universities and colleges. Further R&D capacity was developed with the 2000 Biomass Research and Development Act, which created the Biomass Research and Development Board under the shared supervision of the DoE and the US Department of Agriculture. The aim, to develop commercial scale second-generation biofuel production capacity, remains elusive to this day. Private and, recently, some publicly traded companies are still striving to come up with a production process that is cost competitive with fossil fuel – despite more generous tax credits specifically targeted for cellulosic ethanol, a second-generation renewable fuel.
The advent of the policy monopoly phase (2000–2008) can be adequately explained by PE theory. A focusing event – the growing controversy around the use of methyl tert-butyl ether (MTBE) as a fuel additive – created an opportunity for the biofuels industry. In conjunction with initiatives in multiple state legislatures, this event helped to forge a policy monopoly at the federal level.
Under the Clean Air Act amendment of 1990, the Environmental Protection Agency (EPA) required that gasoline be mixed with an oxygenating agent in certain areas to reduce air pollution problems, such as smog. By the end of the 1990s, the widespread use of MTBE as an oxygenate came to be associated with underground water contamination. Storage tanks containing MTBE were leaking, contaminating drinking water in several states and emitting a particularly pungent smell, which made it hard for legislators to ignore. Moreover, as MTBE progressively became recognised as a carcinogen, several states, including California and New York, instituted MTBE bans starting in 2002 (EIA, 2003). The bans came after California was denied a waiver from the oxygenate requirements of the Clean Air Act by the US EPA. Ethanol thus became a de facto replacement for MTBE in the early 2000s because of its oxygenating and octane-enhancing properties.
Besides its chemical properties, other attributes of ethanol made it sufficiently attractive to overcome the opposition of MTBE-producing fossil fuel interests who sought to emphasise its uncertain effects as well as its higher costs. Ethanol had the advantage of being produced domestically – provided the incentives to do so were sufficiently strong – and was not widely associated with environmental controversy at that time.
Ethanol received a major boost in the 2005 Energy Policy Act. The Act, passed during a period of historically high oil prices, removed the Clean Air Act oxygenate requirements that fostered MTBE blending. More crucially, it imposed an obligation on petroleum fuel suppliers to blend ethanol with gasoline, laying the bedrock foundation of the biofuel policy framework. This Renewable Fuel Standard (known as RFS I) required 7.5 billion gallons of renewable fuel to be blended with gasoline by 2012 (EPA 2010). It created a certain market for ethanol and other renewable fuels, and in the process, transformed thinking around biofuels, changing perceptions of them as fuel additives to “full-fledged transportation fuels” (Domenici Reference Domenici2008, 3).
The multidimensional image of biofuels was fully evident by 2007. In his 2007 State of the Union Address, President George W. Bush argued that biofuels contributed to US energy independence, national security and environmental policy. The 2007 Energy Independence and Security Act (EISA), signed into law on December 2007, listed as one of its aims the desire “to increase the production of clean renewable fuels”. As Grossman (Reference Grossman2012, 47) observes and as we document later in this paper, in the Congressional debates that led up to EISA, ethanol was depicted “as a transformative technology: it would make the country largely independent of foreign (especially Middle Eastern) oil, would be home-grown, would employ many thousands of Americans, would reduce energy costs in the long run, and would be environmentally superior to fossil fuels”.
Even while EISA continues to boost biofuels, it also marks a shift to give greater incentives to biofuels produced from non-food feedstock. A new Renewable Fuel Standard (RFS II) of 36 billion gallons by 2022 was established, an almost five-fold increase from RFS I. However, EISA capped targets for ethanol produced from corn and required 21 billion of the 36 billion RFS II target to come from cellulosic and other second-generation fuels.
A second significant innovation over earlier biofuels policy in EISA is the imposition of environmental performance standards on biofuels. They are required to provide a significant reduction of GHG emissions compared with conventional oil in order to qualify for government support and count towards renewable fuel mandates. For example, under EISA, corn ethanol should emit a minimum of 20 per cent fewer GHG emissions over its life cycle compared with conventional petroleum fuels. For second-generation biofuels, the norm is 50 per cent GHG reduction for “advanced biofuels” and 60 per cent for cellulosic ethanol.
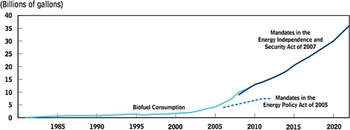
The RFS volume mandate, along with subsidies and tax credits aimed at reducing the risks that the biofuel industry and feedstock farmers bear, lent momentum to the development of the first-generation biofuels produced from corn and soy beans. Figure 1 shows this positive effect in the form of the dramatic growth in consumption of biofuels during this period. The Office of Management and Budget estimated the total value of federal biofuels tax credits, mainly composed of forgone revenue, at nearly $6 billion for the fiscal year 2009 (Congressional Budget Office 2010, 3).
Biofuel consumption, historical and projected – 1981–2022.

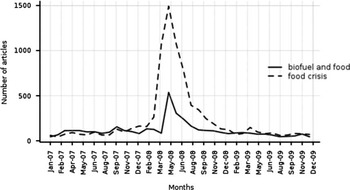
This continued support for biofuels occurred during a period when the policy monopoly was under assault. Already in 2006–2007, corn ethanol production, which accounts for the bulk of biofuel production in the US, was increasingly being criticised by environmental advocates who referenced studies that questioned its positive energy balance and its GHG reduction potential (Pimentel Reference Pimentel2003; Searchinger et al. Reference Searchinger, Heimlich, Houghton and Dong2008). By the spring of 2008, the biofuel policy monopoly was being seriously challenged. The rapid escalation in the costs of basic food staples including corn and vegetable oils (OECD 2008), and the resulting food shortages, prompted riots and protests in at least 15 developing countries. As Figure 2 shows, these events created a boost of media attention on the controversial question of “Food versus Fuel” in the US.Footnote 5
Monthly number of articles on the food crisis and on biofuels and food in Factiva-archived US newspapers from January 2007 to December 2009.

Prominent in the media discussion was the contention that biofuel production mandates contributed to this sharp rise in food prices. The World Bank estimated that biofuels accounted for as much as 75 per cent of escalated food prices (BBC 2008; World Bank 2008), while the International Food Policy Research Institute put the figure at 30 per cent (Rosegrant Reference Rosegrant2008).
Attacks on biofuel policy were fierce. For example, Foreign Affairs ran an article in their May/June 2007 edition titled “How Biofuels Could Starve the Poor” (Runge and Senauer Reference Runge and Senauer2007). For Jean Ziegler, the United Nations’ Special Rapporteur on the Right to Food, using food crops to produce biofuels was “a crime against humanity” (reported in Lederer Reference Lederer2007). Zeigler urged a five-year moratorium on biofuels production in order to stop the “growing catastrophe”, and other international organisations, including the International Monetary Fund and the FAO, called for major changes to American and European biofuels policies. Zeigler's indictment of biofuels as a “crime against humanity” featured in a host of stories about the negative impacts of biofuels carried in national media outlets like Reuters News, The Dow Jones News Service, The Washington Post, The Wall Street Journal, The New York Times, and ABC News.Footnote 6
Sensing an unprecedented opportunity to bring down policies that went against their interests, policy losers mobilised. Livestock producers, under the “Balanced Food and Fuel coalition” and a broader coalition of food industry processors, food retailers, petroleum industry, free enterprise advocates, environmentalist organisations and hunger groups under the “Food Before Fuel” banner, mounted a multimillion-dollar public relations campaign. They urged solutions to energy independence that did not compromise affordable foods and environmental sustainability. Concurrently, venue shopping occurred. On July 2008, Texas – a flagship “oil-patch and cattlemen” state – requested a 50 per cent waiver for the RFS II to the EPA, citing food prices as a concern (Streitfeld Reference Streitfeld2008). This effort at venue shopping was, however, unsuccessful when the waiver was denied.
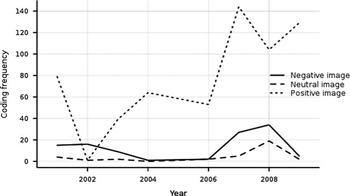
Taken together, this sequence of events, starting with doubts about biofuels’ environmental sustainability and culminating in the food riots and the “Food versus Fuel” debate and political campaign, corresponds to Wood's (Reference Wood2006, 422–426) description of “tipping events”. However, as Figure 1 and Figure 3 show, the biofuel subsystem and policy image proved resilient. Studying this instance of “failed punctuated change” offers an answer to the puzzling question of why such a widely broadcasted and “sticky message” communicated by credible messengers did not set into motion a bandwagon effect. PE theory would explain this outcome as an unsuccessful effort at venue shopping. Yet, this answer does not really give us much purchase on why, despite rising criticism of biofuel policy amidst the emergence of contradictory scientific studies and a focusing event, monopolistic subsystem actors kept making policy and biofuels’ production kept rising. We argue that a better understanding of the resilience of the biofuel policy monopoly can be garnered by attention to three factors: the congruence of the biofuel policy image with core values and current national concerns, the multidimensionality of the policy image, and the policy image management strategies of biofuel supporters. These three factors raised the tipping point's threshold – that is, the point beyond which a negative feedback dynamic transforms into a positive feedback dynamic that provokes transformational policy change.
Evolution of policy images in Congressional hearings over time – 2001–2009

Biofuels’ image and the factors that affect its resilience
To study biofuel policy images and their interaction with social and political events, we used a variety of publicly available data in the form of media accounts, biofuel industry association and environmental association press reports, official government reports and Congressional hearings. Our study also benefited from confidential interviews in Washington, DC with government officials, Congressional staffers and organised industry and environmental groups, as well as from the observation of a biofuel industry conference in Calgary, Canada including conversations with some of its participants.Footnote 7
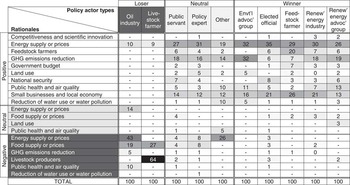
Particular emphasis was put on Congressional hearings. We did a detailed and systematic content analysis of all hearings whose main topic was biofuel policy in the eight-year period running from the 107th Congress (2001–2002) to the first session of the 111th Congress (2009), inclusively. For these hearings, we coded two elements: actors and rationales. Rationales are arguments made about biofuel policy. They are used by political actors to justify their policy position. In this sense, rationales can be tied to a policy image, be it positive, neutral or negative. Actors were first individually coded and then attributed to types (elected official, non-elected official, petroleum industry, renewable energy industry, livestock producer, feedstock farmer, expert or environmental advocate) according to their self-reported organisational tie. A comprehensive list of actor types can be found in Figure 4. A Methodological Appendix details the document selection, codebook development, coding procedure and inter-coder reliability score. Online Supplementary Material also lists each policy actor with his/her organisational tie and corresponding type.
Distribution of rationale use for each policy actor type, percentages computed with frequencies – 2001–2009.

The data derived from the above-mentioned enquiry strongly support our claim that policy image resilience in the case of biofuel policy in the US was enhanced by building on core values and a varied set of rationales integrated in a coherent and consistent discourse and by the collective practice of policy image management.
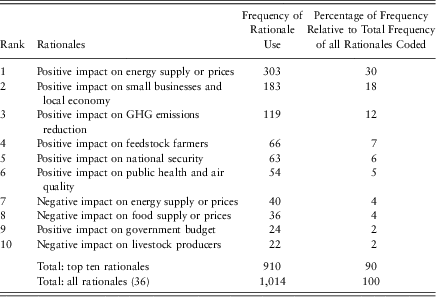
Table 1 presents the top ten rationales (out of total of 36) most frequently used in Congressional hearings on biofuels.Footnote 8 Table 1 shows that the biofuel policy image is tied to core polity-wide goals of national security via energy security and economic opportunity for Americans through the promotion of small business development, rural development and the stable supply of affordable energy.Footnote 9 The importance of energy security, “a prioritized issue among American politicians” since the oil shocks of the 1970s (Bang Reference Bang2010, 1), is denoted by the fact that the most important rationale by far is the positive impact on energy supply or prices. As oil and gasoline prices rose dramatically over 2007–2008, the image of biofuels as contributing to energy security was a particularly important pillar in biofuels’ positive image. The biofuel policy image also, notably, includes the promotion of American competitiveness through scientific innovation. In conjunction with the wider “national mood” focused first on national security following the 9/11 attacks, then on the costs of “America's dangerous addiction to oil”, and finally on the financial meltdown of 2008 and the ensuing Great Recession/sluggish recovery, this particular package of rationales of the biofuel policy image offers convenient “talking points” and potent arguments in the political debate, as many interviewees mentioned.
Top ten rationales, frequencies relative to the total frequency of all rationales (36) coded – 2001–2009

GHG = greenhouse gas
But beyond current events and the national political climate, the biofuel policy image also connects with the past. Policy debates, inside and outside of Congress, are regularly primed with discussions on “Henry Ford's original vision” of ethanol-powered cars that would “boost the rural farm economy” (Rosillo Callé and Johnson Reference Rosillo Callé and Johnson2010, 1). In this context, biofuel policy is a way to revive an old ideal that has strong roots in the country and to correct a historical trajectory that has gone bad. As an ethanol entrepreneur puts it in a letter submitted to a Senate hearing in 2001, “Mr. Ford didn't have the muscle to take on the Oil Trust. [… It is] time to remember Henry Ford and mandate ethanol in” (Gahagan and Associates 2001, 306).
Turning to the second factor strengthening policy images, multidimensionality, data also support our argument. Multidimensionality is readily apparent in Table 1. Multiple rationales linking different issues comprise the biofuel policy image, as this excerpt from the testimony of the Deputy Secretary of the Department of Energy shows: “The Administration strongly supports a renewable fuel standard that will increase the use of clean, domestically produced renewable fuels, especially ethanol, which will improve the nation's energy security, farm economy, and environment”. As we argued, multidimensionality is a resource because, in a policy-making context with multiple venues and shifting national concerns, multidimensional images can more readily fend off, reject or absorb attacks from competing policy images. Our data show that there was no clear shift in Congressional venues over time. Multiple committees and subcommittees (mostly Agriculture, Small Business and Energy) claimed jurisdiction on biofuel policy from the start. There is one notable instance of negative image dominance in the (odd) hearing of the Energy Subcommittee of the House Committee on Government Reform and Oversight in 2002. But, this instance of policy loser mobilisation in the policy monopoly phase did not result in any damage to policies promoting biofuels.
More fundamentally, multidimensionality more readily creates a coalition of supportive interests. As one Congressional staffer closely involved with the passage of the 2007 EISA observed, “Biofuels can be lots of things to lots of people. That's why we have biofuels legislation”.Footnote 10 Environmentalists join the biofuel coalition because of GHG reduction, feedstock farmers because of larger revenues and the renewable energy industry because of business growth. But as we have argued, multidimensionality is only an asset if the multiple rationales are integrated in a coherent and consistent way by the different constituent elements of the supportive coalition.
Figure 4 demonstrates that this integration existed for the positive biofuel image by showing that the most common rationales are not concentrated according to interest groups. Figure 4 plots rationales against actors in a heat map to show the distribution of rationale use. The percentages and corresponding shades of grey indicate, for each actor type, the frequency of rationale use relative to the total frequency of all the rationales used by that actor type. In short, Figure 4 shows how often each group of actors in Congressional hearings used each argument on biofuel policy. The upper right portion of Figure 4 – corresponding to the supportive coalition – exhibits an even distribution of rationale use, compared with the policy losers in the lower left portion where rationale use is clearly more concentrated. Similar results appear by plotting rationales against committees and subcommittees.Footnote 11 In biofuel policy making, it was less a case of “different committees or subcommittees [promoting] different ways of looking at the same problem” (Baumgartner and Jones Reference Baumgartner and Jones2009 [1993], 201) than a case of a multidimensional policy image being consistently carried by an integrated supportive coalition across different Congressional committees. This evidence suggests that the power of policy images might be more important than Congressional venue shifts to explain policy change or a lack thereof.
The resilience effect of multidimensional policy images can also be examined with contrasting cases. Policy monopolies that rely on a single dimensional image seem to fare badly when under attack from a negative image. This vulnerability was illustrated when the petroleum industry's effort to repudiate ethanol and defend MTBE was assaulted in the early 2000s by evidence of MTBE's negative health and environmental effects. Their argument's almost exclusive reliance on the lower price of MTBE did not prove a good strategy. The tobacco policy monopoly is another case in point. As Worsham (Reference Worsham2006) shows, Congressional hearings on tobacco policy relied only on economic benefit arguments in the 1940s and 1950s. When attention shifted towards the negative effects of tobacco on health in the 1960s, the policy monopoly was badly damaged (Baumgartner and Jones, Reference Baumgartner and Jones2009 [1993], 264–281).
The effect of the third factor, policy image management, can likewise be examined in contrast with the classic example of policy mismanagement: nuclear policy. In 1985, Forbes magazine wrote: “The failure of the US nuclear power program ranks as the largest managerial disaster in business history […]”. Taken from the opening of Morone and Woodhouse's (Reference Morone and Woodhouse1989, 1) book detailing this demise, this interpretation of events pertaining to nuclear policy has yet to be fully integrated into PE's theory of policy change. Morone and Woodhouse's main thesis is, after all, that nuclear energy goals could have been attained if industry and government decisions had engaged the nuclear programme on another, more manageable path.
Biofuel policy image management stands in stark contrast. Faced with the threat of internal division in 2006–2007, biofuel proponents crafted a novel message and accepted incremental policy changes that ensured that a sizable portion of environmental organisations remained onboard. Faced with the devastating “Food versus Fuel” debate in 2007–2008, they replied with a unified message that effectively blamed the oil industry and food processors – precisely the policy losers of biofuel policy – for food price hikes. Faced with a political climate unfavourable to government spending in the wake of the debt and deficit debate since 2009, they accepted the expiry of tax credits for corn ethanol.
Amid growing doubts that corn ethanol production is unsustainable, adjustments in the policy framework had to be made to ensure environmental organisations’ support for the further expansion of biofuel production. As discussed above, the 2007 EISA introduced GHG reduction threshold criteria for biofuels that count towards the expanded volume mandate. Interviews with policy makers in Washington all confirm that environmental groups introduced this proviso in the legislation. The shift towards second-generation biofuels in EISA naturally boosted support from environmental groups who saw this as an opportunity to “get biofuels right”. But the shift also simultaneously expanded the base for the biofuel coalition by rallying venture capitalists seeking policy support for renewable energy start-ups. Corn ethanol proponents were unhappy with these decisions, but in the end accepted them. Concurrent with these policy instruments and setting adjustments, prominent subsystem actors crafted a common message that “first-generation and second biofuels are complementary”, arguing that cutting policy support for corn ethanol would hurt the promise of second-generation expansion and pointing to examples of first-generation biofuel producers engaged in second-generation R&D.
Having a common and coherent message was also central to the management of the “Food versus Fuel” debate. In press conferences and inside Congress, ethanol proponents consistently showcased the fact that the price of raw materials in a box of Corn Flakes amount only to five cents of the total cost of the product, and that processing, packaging, marketing and transport costs as well as the profit margins – which they tied together to the petroleum industry and food processors and retailers – amount to the bulk of its price. Further reinforcing this blame narrative, they also “revealed” that the “Food before Fuel” media campaign – which they labelled a “smear campaign” and “anti-ethanol Jihad” – was purposefully orchestrated by the policy losers, pointing to a “secret document” that sought the recruitment of a top lobbyist in order to explicitly take advantage of the fact that the debate was high on the media agenda (Biofuels Digest Reference Biofuels2008; Tickell Reference Tickell2011).
Later, in the unfavourable fiscal climate of the post-2009 deficit debate, biofuel proponents understood that their image would be damaged if they pursued aggressive lobbying to extend the tax credit. They consequently accepted that the corn ethanol tax credit would expire: “We may be the only industry in US history that voluntarily lets a subsidy expire”, said a representative of the Renewable Fuels Association (quoted in Pear Reference Pear2012).
In directing attention to the policy management actions of biofuels proponents that enabled them to “weather the storm”, it is also important to recognise the occurrence of another focusing event at the height of the “Food versus Fuel” debate. Gasoline prices rose to unprecedentedly high levels over this same period. The question arises as to whether it was the high oil prices, rather than the policy management strategies of the biofuels’ coalition, that sustained biofuels’ policies. Given the positive image that had been constructed of biofuels contribution to energy security, the high gasoline prices certainly played to the biofuel coalition's advantage. Yet, high gasoline prices did not necessitate the extension of the biofuels mandate; governments could have used other policy instruments to lower consumer gasoline prices, at least in the short term. The policy management tactic of the biofuel coalition, in laying blame for high gasoline and food prices on the oil industry and deflecting it away from biofuels, is a necessary part of the explanation of the continuation of the policy monopoly.
Conclusion
The point of departure for this article is the objective of understanding better why some policy images (and policy monopolies) prove resilient when they come under bombardment. We have argued that we can make headway in this endeavour by focusing on three factors. The first of these, a policy image that includes core polity-wide values and links these politically significant historical values with current national concerns, has been signalled by PE scholars. The other two, which have not yet received attention from PE scholars, are a multidimensional policy image that creates a wide variety of opportunities for argumentative reason-giving and rhetorical political communication, and the collective practice of policy image management. Together, the three factors reintroduce the role of opportunistic agency during the period between episodes of “creation” and “destruction” of a policy monopoly by showing how monopolistic policy actors can simultaneously reject counter-images, even while making adjustments in policy instruments and settings that respond to critical images. Integrating these three factors into accounts of policy change/stasis, as illustrated by our study of biofuel policy making, can explain why and how incremental policy changes preserve the power and interest of monopolistic policy actors.
If, as we have argued here, assaulted policy images and policy monopolies can be resilient when the conditions we have posited prevail, what should we expect for American biofuel policies over the medium term? Criticisms of these policies remain amidst a mid-2012 rise in corn prices and food and feed costs, and so does the appeal to alternate policy venues to reduce or abolish biofuel mandates.Footnote 12 Under assault, the biofuel coalition continues to be cohesive and rely on its multidimensional policy image of biofuels making an essential contribution to the US economy, its energy and national security, and its rural communities (Biofuels Digest Reference Biofuel2012). This cohesiveness has proven effective, as EPA has denied a second waiver request of the Renewable Fuel Standard in November 2012.
Will these rationales continue to be persuasive insofar as they are linked to cross-party and national preoccupations? Here the evidence is mixed. On the one hand, the persistence of high unemployment levels in the American economy gives resonance to arguments that link biofuels to job creation and economic development. It also lends force to the argument that retreating from biofuel mandates will seriously undermine the investor confidence needed to get beyond corn-based ethanol and to the advanced biofuels exempt from the Food versus Fuel criticism. In the pursuit of this goal, the national security rational remains important as the Navy has since stepped up, despite criticism from the House of Representatives, to promote advanced biofuels via procurement policies and guaranteed purchase agreements. On the other hand, expanding domestic shale gas and petroleum production raises the prospect of American energy self-sufficiency within the foreseeable future and may undermine the energy and national security rationales of biofuels if America's larger energy policy is not resolutely oriented by the “all-of-the-above” leitmotiv, which includes domestically produced biofuels along with other renewable sources. In such circumstances, the policy image management strategies of the pro-biofuels coalition are likely to be seriously tested. Having already lost favourable policy instruments such as the corn ethanol tax credit, its willingness to make concessions now will hinge to an important degree on adjustments to the biofuel mandates: something it has so far resisted.
In conclusion, this paper has proposed new explanatory factors to be integrated into accounts of policy change/stasis based on the careful examination of a single case supported by indicative evidence from other policy studies (Morone and Woodhouse Reference Morone and Woodhouse1989; Coleman et al. Reference Coleman, Skogstad and Atkinson1996; Wyszomirski Reference Wyszomirski1998; Worsham Reference Worsham2006; Bakir Reference Bakir2009; Chaqués and Palau Reference Chaqués and Palau2009). Although a limited test of our theoretical argument, our informed conjecture constitutes a strong base – a plausibility probe (Eckstein Reference Eckstein1975) – on which a more systematic cross-case study of policy change/stasis could be fruitfully conducted. We have strong reasons to believe that our argument can extend to other polities, particularly to those who have multiple entry points and policy-making venues such as the EU or Germany. The degree to which the above-mentioned factors need to be qualified by national and institutional caveats would require further attention. This article hopes to have demonstrated that this attention would be warranted.
Acknowledgment
The authors thank Paul Davis for assistance with the coding, the Journal's anonymous reviewers for their helpful comments and the Social Science and Humanities Research Council of Canada for its financial support for the research on which this paper is based.
Methodological Appendix
For Figure 1
Figure taken from Congressional Budget Office (2010, 4, Figure 1). Source: Congressional Budget Office based on Energy Information Administration (2010), Tables 10.3 and 10.4, available at http://tonto.eia.doe.gov/FTPROOT/multifuel/mer/00351005.pdf; the Energy Policy Act of 2005 (Public Law 109–58); and the Energy Independence and Security Act of 2007 (Public Law 110–140).
For Figure 2
Figure 2 was computed with data from a keyword search using the Factiva search engine (http://www.dowjones.com/factiva/). It includes all United States publications indexed by Factiva as of May 2012. The search string used was “(biofuels AND food) OR (biofuel AND food) OR (ethanol AND food)” for the label biofuel and food and “(food prices) OR (food price) OR (food crisis)” for the label food crisis.
For Table 1, Figure 3, and Figure 4
These figure and tables were computed using data from a systematic content analysis of Congressional hearings. We used the GPO Access search engine to find the relevant Congressional hearings (http://www.gpoaccess.gov/chearings/index.html). The search string used was ethanol biodiesel biofuel* “renewable energy” “energy security” “food crisis”. This yielded a corpus of 29 hearings (see online Supplementary Material), 14 from the House of Representatives and 15 from the Senate, which we then coded. The coding was done with specialised content analysis computer software (QSR International 2008) using a codebook developed by the authors. The codebook was established before the full coding, based on the authors’ prior knowledge of the subject matter and on a reading of a randomly selected 10 per cent page-unit sample of the corpus. This partial pre-reading of the corpus was done to ensure that the codebook was comprehensive.
The units coded were whole paragraphs. For example, if Congressman/women X claimed that ethanol reduces GHG emissions in one sentence, the whole paragraph was coded in the “Reduce GHG emissions” rationale code and the “Congressman/woman X” actor code. If this claim spanned several paragraphs, all the contiguous paragraphs in which the claim was made were coded under the same occurrence. If the same actor made the same claim in the same hearing but at another time (in a paragraph not contiguous to the one mentioned above), that claim was coded under “Reduce GHG emissions”, but as a second occurrence, thus raising the frequency of this code. Proceeding in this manner gave us the flexibility to have instant access to comprehensive coverage of contextualised and precise textual claims made in the debate while allowing us to create quantitative indicators that show a more synoptic view. Since rationale codes are not mutually exclusive and can overlap, statistical correlations are not an appropriate method of analysis. Instead, we develop graphical representations of categories derived from PE theory to demonstrate our point. For these graphical representations, frequencies of the rationales were used (as opposed to word counts) as a way of portraying argument use in policy debates. Using quasi-sentences as a unit of analysis is an alternative way of portraying policy debates that would yield the same results in terms of frequencies of argument use. We chose to code whole paragraphs, because it allowed us to make quantitative as well as qualitative analysis.
Three separate coders, including two of the authors, did the coding. Each hearing was coded in its entirety twice by two different coders. In the first coding, actors and rationales were coded. In the second coding, only rationales were coded. The second coding was done entirely by the non-author coder. The dataset used for this paper merged actor-coding data from the first coding and rationale coding from the second coding. The duplicate coding for rationales was used to assess inter-coder reliability. The worst inter-coder reliability score within the entire set of rationale/hearing was at an 87 per cent agreement level. This worst-case level conforms to a high standard for descriptive inference. Given that we do not use the coding data to make statistical correlations, the consequences of the residual discrepancies are negligible (Krippendorff Reference Krippendorff1980, 146–148).