I. INTRODUCTION
The crystal structure of LiTaO3 (space group R3c) is isomorphous with that of LiNbO3, which is closely related to those of corundum and ilmenite (Megaw, Reference Megaw1973). The room-temperature structure of LiTaO3 has been determined by single-crystal X-ray diffraction and neutron diffraction methods (Abrahams and Bernstein, Reference Abrahams and Bernstein1967; Abrahams et al., Reference Abrahams, Hamilton and Sequeira1967; Ohgaki et al., Reference Ohgaki, Tanaka and Marumo1989; Hsu et al., Reference Hsu, Maslen, Du Boulay and Ishizawa1997). The Li and Ta atoms are on the triad axis with Wyckoff position 6a (Figure 1). The Li atom has 12 O-atom neighbors with the three of the longest (=0.345 nm) 12 Li–O bonds, and the TaO6 polyhedron shows two types of bond lengths of 0.191 and 0.207 nm. The Li atom is displaced along the c-axis with respect to the double oxygen layers by ca. 0.060 nm, and the Ta atom is ca. 0.020 nm from the mid-point between the oxygen layers (Hsu et al., Reference Hsu, Maslen, Du Boulay and Ishizawa1997).
Part of the crystal structure of LiTaO3 viewed along [110], showing coordination polyhedra for Li and Ta. Structural parameters determined by Hsu et al. (Reference Hsu, Maslen, Du Boulay and Ishizawa1997).

A combined use of the Rietveld method (Rietveld, Reference Rietveld1967), the maximum-entropy method (MEM) (Takata et al., Reference Takata, Nishibori and Sakata2001), and the MEM-based pattern fitting (MPF) method (Izumi, Reference Izumi2004) has enabled us to determine three-dimensional electron-density distributions (EDD), which efficiently disclose new structural details. The Rietveld method and MEM have a drawback in determining the EDD from X-ray powder diffraction (XRPD) data because the observed structure factors, F o(Rietveld), are biased toward the structural model assuming intensity partitioning. On the other hand, the MPF method can minimize the structural bias. Thus, the MEM and MPF analyses are alternately repeated (REMEDY cycle) until the reliability indices reach the minima (Izumi et al., Reference Izumi, Kumazawa, Ikeda, Hu, Yamamoto and Oikawa2001). Crystal structures are represented not by structural parameters but by 3D EDD in MPF.
Recently, LiTaO3 crystal, when it is codoped with Eu3+ and Ti4+, has been found to demonstrate excellent performance as the red phosphor under direct excitation of the 4f electron at 541 nm (Nakano et al., Reference Nakano, Ozono, Hayashi and Fujihara2012). In order to clarify the highly efficient photoluminescence mechanism and further improve the performance, detailed structural information is necessary for this material. In the present study, we prepared two types of powder specimens, Ti4+-doped LiTaO3 and Eu3+- and Ti4+-codoped LiTaO3, to investigate the crystal structures from XRPD data. The z coordinates of Li/Eu sites have been differed prominently among the three isomorphous structures.
II. EXPERIMENTAL
A. Syntheses
Two types of powder specimens with starting compositions of Li(Ta0.89Ti0.11)O2.945 (sample LTTO) and (Li0.977Eu0.023)(Ta0.89Ti0.11)O2.968 (LETTO) were prepared from the reagent-grade chemicals Li2CO3, Eu2O3, Ta2O5, and TiO2. Each of the well-mixed chemicals was pressed into pellets, heated at 1273 K for 3 h and continuously at 1423 K for 24 h, and followed by cooling to ambient temperature by cutting furnace power. The densely sintered pellets were finely ground to obtain powder specimens.
B. Characterization
A diffractometer (X'Pert PRO Alpha-1, PANalytical B.V., Almelo, the Netherlands), equipped with an incident-beam Ge(111) Johansson monochromator to obtain CuKα 1 radiation and a high-speed detector, was used in the Bragg–Brentano geometry. The X-ray generator was operated at 45 kV and 40 mA. An automatic divergence slit was used to keep a constant illuminated length of 5 mm on the specimen surface. Other experimental conditions were: continuous scan, experimental 2θ range from 20.0 to 135.5°, 13 823 total data points, and 4.1 h total experimental time. The crystal-structure models, equidensity isosurfaces of EDD, and two-dimensional EDD maps were visualized with the computer program VESTA (Momma and Izumi, Reference Momma and Izumi2008). Distortion parameters for the coordination polyhedra were determined using the computer program IVTON (Balic-Zunic and Vickovic, Reference Balic-Zunic and Vickovic1996).
III. RESULTS AND DISCUSSION
A. Crystal structure refinements and electron density distributions
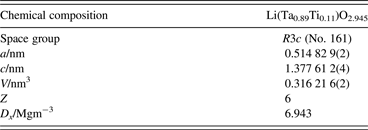
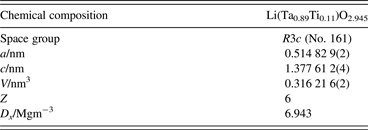
Initial structural parameters of Li(Ta0.89Ti0.11)O2.945 (sample LTTO) were taken from those determined by Hsu et al. (Reference Hsu, Maslen, Du Boulay and Ishizawa1997) for LiTaO3 (space group R3c). There are three independent sites (i.e., one Li site located at the Wyckoff position 6a, one Ta/Ti site at 6a, and one O site at 18b) in a hexagonal unit cell (Z = 6). Structural parameters of all atoms were refined by the Rietveld method using the computer program RIETAN-FP (Izumi and Momma, Reference Izumi and Momma2007) with the profile intensity data of LTTO in the whole 2θ range. A Legendre polynomial with 12 adjustable parameters was fitted to background intensities. The split Pearson VII function (Toraya, Reference Toraya1990) was used to fit the peak profiles. The refinement resulted in the reliability (R) indices of R wp = 10.60%, S (=R wp/R e) = 1.37, R p = 7.49%, R B = 3.40%, and R F = 1.51% (Young, Reference Young and Young1993). Crystal data are given in Table I, and the final atomic positional parameters and isotropic atomic displacement parameters (ADPs) are given in Table II. The MPF method was subsequently applied, so as to extract structural details and consequently improve the EDD. The EDD with 104 × 104 × 276 pixels in the unit cell, the spatial resolution of which is approximately 0.005 nm, were obtained from the MPF method using the computer programs RIETAN-FP and Dysnomia (Izumi and Momma, Reference Izumi and Momma2010). After three REMEDY cycles, R wp, S, R p, R B, and R F further decreased to 10.13, 1.31, 6.85, 1.36, and 0.67%, respectively. Subtle EDD changes as revealed by MPF significantly improve the R B and R F indices. The decreases in R indices demonstrate that the crystal structure can be seen more clearly from EDD instead of from the conventional structural parameters reported in Table II. Observed, calculated, and difference XRPD patterns for the final MPF are plotted in Figure 2(a).
(a) Comparison of the observed diffraction patterns (symbol:+) with the corresponding calculated patterns (upper solid line). The difference curve is shown in the lower part of each diagram. The vertical bars indicate the positions of possible Bragg reflections. The profile intensities collected for samples (a) LTTO. (b) Comparison of the observed diffraction patterns (symbol:+) with the corresponding calculated patterns (upper solid line). The difference curve is shown in the lower part of each diagram. The vertical bars indicate the positions of possible Bragg reflections. The profile intensities collected for samples LETTO.
Crystal data for Li(Ta0.89Ti0.11)O2.945.
Structural parameters and isotropic atomic displacement parameters (100 × B/nm2) for Li(Ta0.89Ti0.11)O2.945.

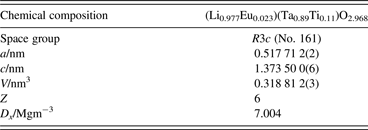
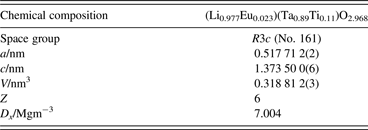
The XRPD peaks of (Li0.977Eu0.023)(Ta0.89Ti0.11)O2.968 (sample LETTO) were successfully indexed with a hexagonal unit cell, the refined unit-cell volume of which was about 0.82% larger than that of Li(Ta0.89Ti0.11)O2.945. The Eu3+ ions were assumed to be randomly distributed over the Li site. The refinement process was very similar to that of LTTO. The Rietveld refinement in the 2θ range from 20.0 to 135.0° resulted in the R indices of R wp = 7.87%, S = 1.22, R p = 6.03%, R B = 1.72%, and R F = 1.03%. Crystal data are given in Table III, and the final atomic positional parameters and isotropic ADPs are given in Table IV. We also applied the MPF method to obtain lower R indices (R wp = 7.82%, S = 1.21, R p = 6.00%, R B = 1.20%, and R F = 0.70%) after three REMEDY cycles. Observed, calculated, and difference XRPD patterns for the final MPF are plotted in Figure 2(b).
Crystal data for (Li0.977Eu0.023)(Ta0.89Ti0.11)O2.968.
Structural parameters and isotropic atomic displacement parameters (100 × B/nm2) for (Li0.977Eu0.023)(Ta0.89Ti0.11)O2.968.
Figure 3 shows the refined crystal structures of Li(Ta0.89Ti0.11)O2.945 and (Li0.977Eu0.023)(Ta0.89Ti0.11)O2.968, both of which have been confirmed to be isomorphous with that of LiTaO3. The individual equidensity isosurfaces of 3D EDD (Figure 4) are in reasonably good agreement with the corresponding atom arrangements (Figure 3). The two-dimensional EDD maps on the (110) planes show that the positions of Li and/or Eu atoms are successfully disclosed by the EDD (Figure 5). The electron-density peaks at the Li/Eu site of (Li0.977Eu0.023)(Ta0.89Ti0.11)O2.968 (ca. 0.05 nm−3) were higher than those at the Li site of Li(Ta0.89Ti0.11)O2.945 (ca. 0.03 nm−3), although the electron-density peaks at the Ta/Ti sites of these compounds were nearly the same (ca. 1.5 nm−3), which indicates that the Li and Eu atoms undoubtedly occupy the same site in the former structure. We found the peak positions of EDD from the 3D pixel data and compared them with the coordinates of all atoms that were determined by the Rietveld method. The positional deviations of all atoms in the unit cell were found to be necessarily less than 0.003 nm, which is within the resolution limit of the 3D EDD. We therefore concluded that the present structural models reasonably and satisfactorily represent the corresponding crystal structures of Li(Ta0.89Ti0.11)O2.945 and (Li0.977Eu0.023)(Ta0.89Ti0.11)O2.968.
(a) Crystal structure of Li(Ta0.89Ti0.11)O2.945. Because the occupancy of oxygen site is less than unity, the O atoms are displayed as red circle graphs for occupancy. Blue and cyan bicolor balls are for Ta (blue) and Ti (cyan) sites. (b) Crystal structure of (Li0.977Eu0.023)(Ta0.89Ti0.11)O2.968. Because the occupancy of oxygen site is less than unity, the O atoms are displayed as red circle graphs for occupancy. Blue and cyan bicolor balls are for Ta (blue) and Ti (cyan) sites. Yellow and magenta bicolor balls are for Li (yellow) and Eu (magenta) sites.
(a) Three-dimensional electron-density distributions determined by MPF with the structural models for Li(Ta0.89Ti0.11)O2.945. Isosurfaces expressed in smooth shading style for an equidensity level of 0.005 nm−3. (b) Three-dimensional electron-density distributions determined by MPF with the structural models for (Li0.977Eu0.023)(Ta0.89Ti0.11)O2.968. Isosurfaces expressed in smooth shading style for an equidensity level of 0.005 nm−3.
(a) Bird's eye views of electron densities of the Li and Ta/Ti atoms on the (110) planes of Li(Ta0.89Ti0.11)O2.945. (b) Bird's eye views of electron densities of the Li/Eu and Ta/Ti atoms on the (110) planes of (Li0.977Eu0.023)(Ta0.89Ti0.11)O2.968.
B. Structure description
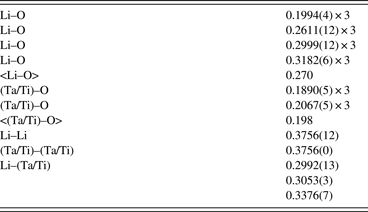
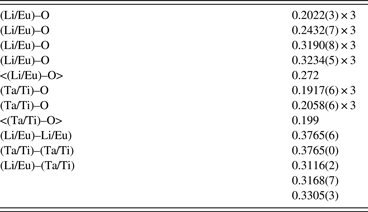
Selected interatomic distances, together with their standard deviations, are listed in Tables V and VI. The average ionic radii of Ta5+ and Ti4+ in the six-fold coordination [r(Ta5+(6)) = 0.064 nm, r(Ti4+(6)) = 0.0605 nm, and r(O2−(6)) = 0.140 nm (Shannon, Reference Shannon1976)] predicts the interatomic distance (weighted according to site occupancy) of 0.204 nm for (Ta,Ti)–O. This predicted value is in good agreement with the corresponding average interatomic distances, <(Ta,Ti)–O> , of 0.198 nm for Li(Ta0.89Ti0.11)O2.945 and 0.199 nm for (Li0.977Eu0.023)(Ta0.89Ti0.11)O2.968. The oxidation state of Li site in Li(Ta0.89Ti0.11)O2.945 is estimated to be 0.93 by the bond valence sum (Brown and Altermatt, Reference Brown and Altermatt1985; Brese and O'Keeffe, Reference Brese and O'Keeffe1991), which agrees well with 1.0 for Li+. The <Li–O> distance of [LiO12] polyhedron in LiTaO3 is 0.274 nm, which is compatible with those of Li(Ta0.89Ti0.11)O2.945 (0.270 nm) and (Li0.977Eu0.023)(Ta0.89Ti0.11)O2.968 (0.272 nm).
Selected bond lengths (nm) for Li(Ta0.89Ti0.11)O2.945.
Selected bond lengths (nm) for (Li0.977Eu0.023)(Ta0.89Ti0.11)O2.968.
With [(Ta,Ti)O6] octahedra in LiTaO3, Li(Ta0.89Ti0.11)O2.945, and (Li0.977Eu0.023)(Ta0.89Ti0.11)O2.968, the ratios of volumes of the circumscribed sphere and the polyhedron (=V S/V P) range from 3.13 to 3.15 (Table VII). Because the V S/V P-value for the regular octahedron is 3.1416 (Makovicky and Balic-Zunic, Reference Makovicky and Balic-Zunic1998), the relevant polyhedra can be described as slightly distorted octahedra. The corresponding distortion-parameter values are close to each other among the three compounds, indicating that the [(Ta,Ti)O6] octahedra are all comparable with each other. There are four ideal polyhedra with 12 vertices; they are cuboctahedron (V S/V P = 1.7772), anticuboctahedron (1.7772), icosahedron (1.6516), and maximum volume hexagonal prism (2.0944) (Makovicky and Balic-Zunic, Reference Makovicky and Balic-Zunic1998). These V S/V P values are quite different from those of [(Li,Eu)O12], ranging from 2.26 to 2.31 (Table VII); these polyhedra are distinct from any of the four ideal ones. As for the O-atom arrangements, all the polyhedra are equivalent since the corresponding r S, V S, σ, and V P values are almost the same. On the other hand, the centroid-to-Li/Eu distances (Δ-value) widely vary from 0.024 to 0.064. Accordingly, the prominent difference among the three compounds is the Δ-value for [(Li,Eu)O12]. Here we define displacement vector Δ, which connects the centroid to the Li/Eu site of the [(Li,Eu)O12] polyhedron, to more clearly describe the characteristics of the crystal structure not only by the magnitude of Δ but also by its direction. With Li(Ta0.89Ti0.11)O2.945Figure 6(a), the vector Δ is in the [001] direction with the magnitude of 0.024 nm, whereas the Δ vectors for LiTaO3 (Figure 1) and (Li0.977Eu0.023)(Ta0.89Ti0.11)O2.968 [Figure 6(b)] are in the [ $00\overline 1 $] direction with the magnitudes of, respectively, 0.064 and 0.047 nm.
(a) Comparison of parts of the crystal structures Li(Ta0.89Ti0.11)O2.945, viewed along [110]. (b) Comparison of parts of the crystal structures (Li0.977Eu0.023)(Ta0.89Ti0.11)O2.968, viewed along [110].
Polyhedral distortion parameters for LiTaO3, Li(Ta0.89Ti0.11)O2.945, and (Li0.977Eu0.023)(Ta0.89Ti0.11)O2.968.
Δ = centroid-to-cation distance; r S = radius of sphere fitted to ligands; V S = sphere volume; σ = sphericity; V P = volume of coordination polyhedron. For explanation, see Makovicky and Balic-Zunic (Reference Makovicky and Balic-Zunic1998).
*Structural parameters by Hsu et al. (Reference Hsu, Maslen, Du Boulay and Ishizawa1997).
We have confirmed that the crystal structure of LiTaO3 is flexible with respect to the substitutions of Eu for Li (Eu/(Li + Eu) ≤ 0.023) and Ti for Ta [Ti/(Ta + Ti) ≤ 0.11]. The replacement is accompanied by the displacement of the Li/Eu site along the c-axis, keeping both [(Li,Eu)O12] and [(Ta,Ti)O6] polyhedra almost undistorted. The incorporation of Eu3+ ions into the crystal structure of Li[Ta0.89Ti0.11]O2.945 would cause the overlapping of orbitals with the adjacent anions, resulting in the efficient red-light emission because of the hypersensitive 5D0–7F2 transition in Eu3+ (Nakano et al., 2012). A more detailed discussion on the photoluminescence of this material should be made based on the comparison between the electronic states of (Li0.977Eu0.023)(Ta0.89Ti0.11)O2.968 and Li(Ta0.89Ti0.11)O2.945, which would be determined from calculation by, for example, density functional theory. The reliable structural parameters, which are indispensable for the calculation, are now available for both compounds.
IV. CONCLUSION
We determined the crystal structures of Li(Ta0.89Ti0.11)O2.945 and (Li0.977Eu0.023)(Ta0.89Ti0.11)O2.968, each of which consists of two types of polyhedra [(Li,Eu)O12] and [(Ta,Ti)O6]. The validity of the structural models was confirmed by the EDD determined by MPF. The two-dimensional EDD maps on (110) showed that the positions of Li/Eu sites were successfully disclosed by the EDD. The substitutions of Eu for Li and Ti for Ta in the crystal structure of LiTaO3 displaced the Li/Eu site along the c-axis, keeping the two types of polyhedra almost undistorted.
ACKNOWLEDGMENTS
The study was partly supported by a Grant-in-Aid for Scientific Research (No. 24360273) from the Japan Society for the Promotion of Science (K. F.) and by a research granted from The Murata Science Foundation (H. N.).