INTRODUCTION
In the African tropics, although vegetation patterns broadly follow trends in rainfall amount and timing, specific vegetation types on the landscape are remarkably heterogeneous (White, Reference White1983). Nowhere is this clearer than in equatorial East Africa’s western rift, which sits at the junction of the Congo rain forest and the extensive drylands to the south. In East Africa, extraordinary gradients in vegetation composition and structure exist because of interactions of climate and topography, creating striking transitions from dense, species-rich forests to open, fire-prone bushlands over distances of only tens of kilometers. The biogeography of the East African forest/dryland border region is thus very complex and characterized by remnants and forest mosaics whose history and ecology are largely unknown. Although climate is important in maintaining these systems, many studies have shown the crucial role of disturbance in shaping East African biogeography (Campbell, Reference Campbell1996; Sankaran et al., Reference Sankaran, Hanan, Scholes, Ratnam, Augustine, Cade, Gignoux, Higgins, Le Roux and Ludwig2005; Gillson, Reference Gillson2006). However, the relationship and feedbacks between vegetation, climate, and disturbance over long time scales has not been studied in detail.
The early Holocene (10–6 ka) was characterized by wetter conditions than today over most of northern, equatorial, and southeastern tropical Africa, a period often called the African Humid Period (AHP; deMenocal et al., Reference deMenocal, Ortiz, Guilderson, Adkins, Sarnthein, Baker and Yarusinsky2000; Gasse, Reference Gasse2000). Intensified monsoonal activity during this time is thought to have resulted in forest and woodland expansion throughout much of Africa (e.g., Kröpelin et al., Reference Kröpelin, Verschuren, Lézine, Eggermont, Cocquyt, Francus, Cazet, Fagot, Rumes and Russell2008; Lézine, Reference Lézine2009). Although aridification at the end of the AHP around 6 ka was abrupt in some regions in North Africa, there is no consensus on the abruptness of the end of the AHP and of the associated vegetation transitions. In particular, in equatorial East Africa, much of what we know of vegetation change during the AHP comes from highland sediment core records, including those from the Rwenzori Mountains by Livingstone (Reference Livingstone1967). The contribution of this work to African paleoecology has been fundamental to the understanding of the history of early Holocene forests and how they responded to climate change; however, complementary records from lower altitudes are sparse (Kendall, Reference Kendall1969; Beuning et al., Reference Beuning, Talbot and Kelts1997; Ivory and Russell, Reference Ivory and Russell2016). Thus, our understanding of the timing, character, and mechanisms of the regional forest transitions during and after the AHP, at all elevations, remains unclear.
Although it is likely that high-amplitude, abrupt changes in rainfall during the Holocene helped shape the character of the vegetation today, the role of other climate variables and disturbance factors have yet to be determined. Although records are sparse, newly emerging organic geochemical reconstructions suggest that the AHP was characterized by warmer and wetter conditions, with peak warming during the mid-Holocene (~6–4ka; Weijers et al., Reference Weijers, Schefuß, Schouten and Damsté2007; Tierney et al., Reference Tierney, Russell, Huang, Damsté, Hopmans and Cohen2008; Woltering et al., Reference Woltering, Johnson, Werne, Schouten and Damsté2011; Loomis et al., Reference Loomis, Russell, Ladd, Street-Perrott and Sinninghe Damsté2012). Livingstone (Reference Livingstone1967) presaged this event, suggesting that mid-Holocene forest communities in the Rwenzori Mountains could reflect a warmer climate. However, Livingstone (Reference Livingstone1967) also noted that fluctuations in human demographics and technology could have influenced these changes during the Holocene—in fact, he was among the first paleoecologists to note the potential influence of early people on African ecosystems. Indeed, East Africa has a longer history of human-environment interactions than anywhere else on Earth. It is clear that large-scale population increases and major technological developments occurred over the Holocene and potentially before (Gowlett, Reference Gowlett2016; Stewart and Jones, Reference Stewart and Jones2016). However, difficulties in isolating the effects of climate and humans on vegetation have made it difficult to determine the influence of early people on terrestrial ecosystems (Livingstone, Reference Livingstone2001). Understanding how anthropogenic pressures, as well as feedbacks with climate, may alter vegetation is critical when mitigating future degradation.
Here we present new fossil pollen and charcoal data from multiple sediment cores from Lake Edward, Uganda, situated within the savanna-forest ecotone, and compare these to geochemical and sedimentologic records of regional climate to investigate lowland forest history and disturbance over the Holocene in equatorial East Africa. Further, we compare terrestrial and aquatic ecosystem dynamics in order to look at how climate change at the end of the AHP differentially affected systems within the lake and in the adjacent hinterland. Finally, we use regionally available records to compare lowland and highland forest change within the Edward watershed over this period. These data highlight strong impacts of rainfall, temperature, and human activities in shaping present and past ecosystems in this dynamic landscape.
MODERN SETTING
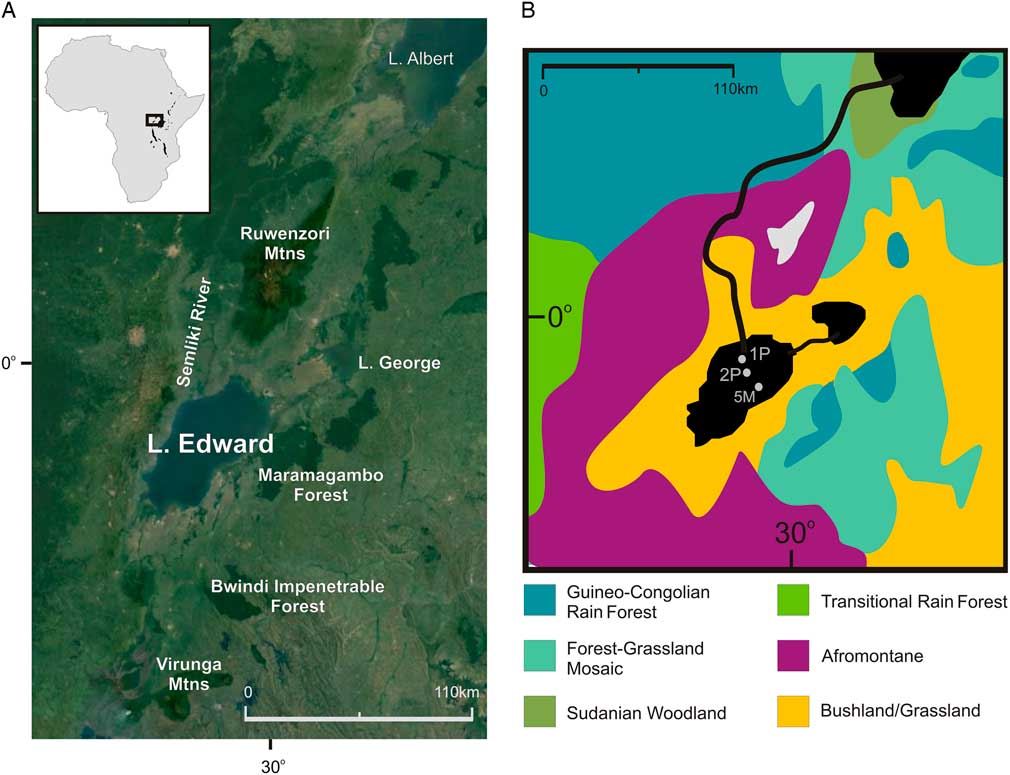
Lake Edward (0°–0°40′S, 29°20′–29°50′E; 912 meters above sea level [m asl]; Fig. 1) is a rift lake situated on the equator within the western branch of the East African rift system. The basin lies between the Rwenzori Mountains and the Virunga volcanoes and is bordered by steep topographic highs associated with a border fault to the west and more gently sloping terrain of the Kigezi highlands to the east (McGlue et al., Reference McGlue, Scholz, Karp, Ongodia and Lezzar2006). The lake itself currently occupies an area of 2325 km2 and drains a large watershed of 15,840 km2 (Russell and Johnson, Reference Russell and Johnson2006). The lake has a maximum depth of 117 m, is generally eutrophic, and is permanently anoxic below 80 m but episodically anoxic below 40 m. Lake Edward is connected to Lake George to the northeast via the Kazinga Channel and has a single outlet to the northwest, the Semliki River, which drains into Lake Albert and eventually the Nile (Beadle, Reference Beadle1981).
(color online) (A) Satellite image of equatorial East Africa including the Lake Edward watershed (Google Earth). Inset is map of Africa with study region outlined in black box. (B) Vegetation map of main phytogeographic regions within the Lake Edward watershed (after White, Reference White1983). Core locations for 1P, 2P, and 6M are shown.

Climate within the watershed is equatorial, and Lake Edward sits at the limit of the influence of Atlantic moisture (Nicholson, Reference Nicholson1996). However, as Atlantic moisture does not consistently extend as far east as Lake Edward, rainy seasons are dominated by rainfall associated with Indian Ocean monsoon. Rainfall averages 900 mm/yr at the elevation of the lake and occurs twice yearly following the passage of the Intertropical Convergence Zone (Russell et al., Reference Russell, Johnson, Kelts, Lærdal and Talbot2003). The majority of rainfall occurs from March to May during the long rains, and a second rainy season occurs from October to December during the short rains. Lowland temperature fluctuations throughout the year are negligible; however, in the highlands, diurnal temperature fluctuations are larger and can result in freezing conditions.
Vegetation around the lake today is dominated by bushlands and wooded grasslands (Fig. 1; White, Reference White1983; Beuning and Russell, Reference Beuning and Russell2004). These types include many secondary and disturbed mosaics including secondary Acacia wooded grasslands and thickets of Euphorbia. Although plants with affinities to savanna and steppe biomes dominate the vegetation at the elevation of the lake (Vincens et al., Reference Vincens, Bremond, Brewer, Buchet and Dussouillez2006), closed-canopy lowland forests are abundant at higher elevations and also as small relict patches, such as the Maramagambo Forest and Bwindi Impenetrable Forest (Fig. 1; Polhill, Reference Polhill1966). These forests are dominated by semideciduous and evergreen trees such as Myrica, Macaranga, Ulmaceae, and Moraceae. In the mountains above 1500 m asl, Afromontane forests dominate (White, Reference White1983). Vegetation zonation varies throughout the region; however, broadly, Olea capensis is typical of moister areas (1500–2000 mm/yr; 0–3 dry months) from 1500 to 2500 m asl, whereas Podocarpus, Juniperus procera, Ericaceae, and Olea africana are common in drier areas above 2000 m asl (800–1700 mm/yr; ~4 dry months; White, Reference White1983). In the higher elevations on wetter slopes above 3000 m asl in the Rwenzori, a zone of bamboo forest occurs and is topped by forests dominated by Hagenia abyssinica and ericaceous vegetation (Livingstone, Reference Livingstone1967).
METHODS
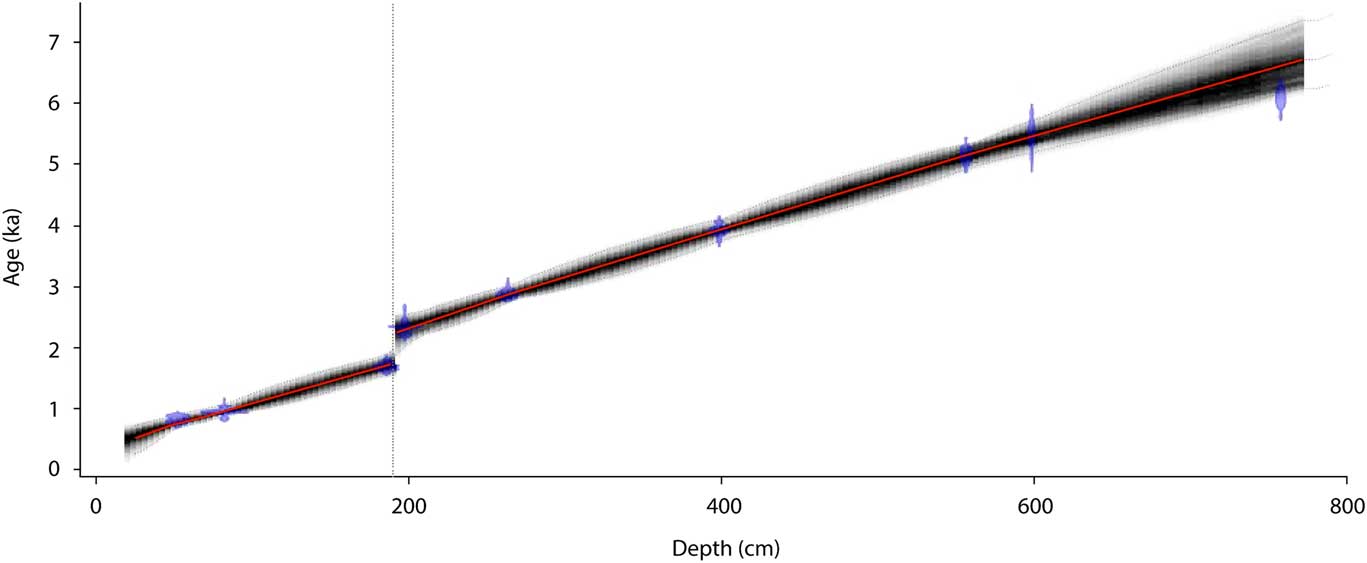
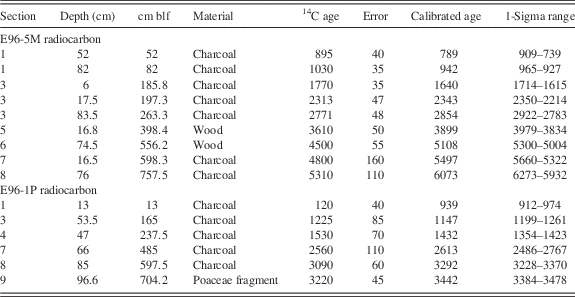
Cores E96-5M and E96-1P were collected from Lake Edward at 29 m and 60 m water depth, respectively (Fig. 1). Further details regarding the core sites are found in Russell et al. (Reference Russell, Johnson, Kelts, Lærdal and Talbot2003) and Beuning and Russell (Reference Beuning and Russell2004). Chronologies for the cores were based on nine radiocarbon dates on E96-5M and six radiocarbon dates for E96-1P measured on charcoal and wood fragments (Table 1; Russell et al., Reference Russell, Johnson, Kelts, Lærdal and Talbot2003). Here we recalibrated these ages and updated the age models using the Bacon Bayesian age modeling program in R, which was chosen in order to best fit age data including a hiatus in E96-5M (Fig. 2; Blaauw and Christen, Reference Blaauw and Christen2011). All radiocarbon dates were calibrated in Bacon using IntCal13 (Reimer et al., Reference Reimer, Bard, Bayliss, Beck, Blackwell, Bronk Ramsey, Buck, Cheng, Edwards and Friedrich2013), and all default parameters were used (Goring et al., Reference Goring, Williams, Blois, Jackson, Paciorek, Booth, Marlon, Blaauw and Christen2012) with the exception of the addition of a hiatus at 190 cm (~2 ka) marked by carbonate sands as indicated in Russell et al. (Reference Russell, Johnson, Kelts, Lærdal and Talbot2003). The age model for the short section of E96-1P is based on a linear interpolation between calibrated dates.
Age-depth model output for core E96-5M from Bacon Bayesian age modeling program in R (Blaauw and Christen, Reference Blaauw and Christen2011). All 14C dates, pictured in blue, are calibrated with IntCal13 (Reimer et al., Reference Reimer, Bard, Bayliss, Beck, Blackwell, Bronk Ramsey, Buck, Cheng, Edwards and Friedrich2013), the gray stippled lines that encapsulate the gray cloud represent the 95% confidence interval, and the red line is the best-fit model based on a weighted mean. The age model for E96-1P is based on a linear interpolation between the calibrated ages for that core in Table 1 and is only used for samples from 2237 to 1750 calyrBP to fill the hiatus in E96-5M. The stippled line at 190cm represents a depositional hiatus. (For interpretation of the references to color in this figure legend, the reader is referred to the web version of this article.)

Radiocarbon dates used for creation of age-depth relationships for E96-5M and E96-1P based on Russell et al. (Reference Russell, Johnson, Kelts, Lærdal and Talbot2003). cmblf, centimeters below the lake floor.

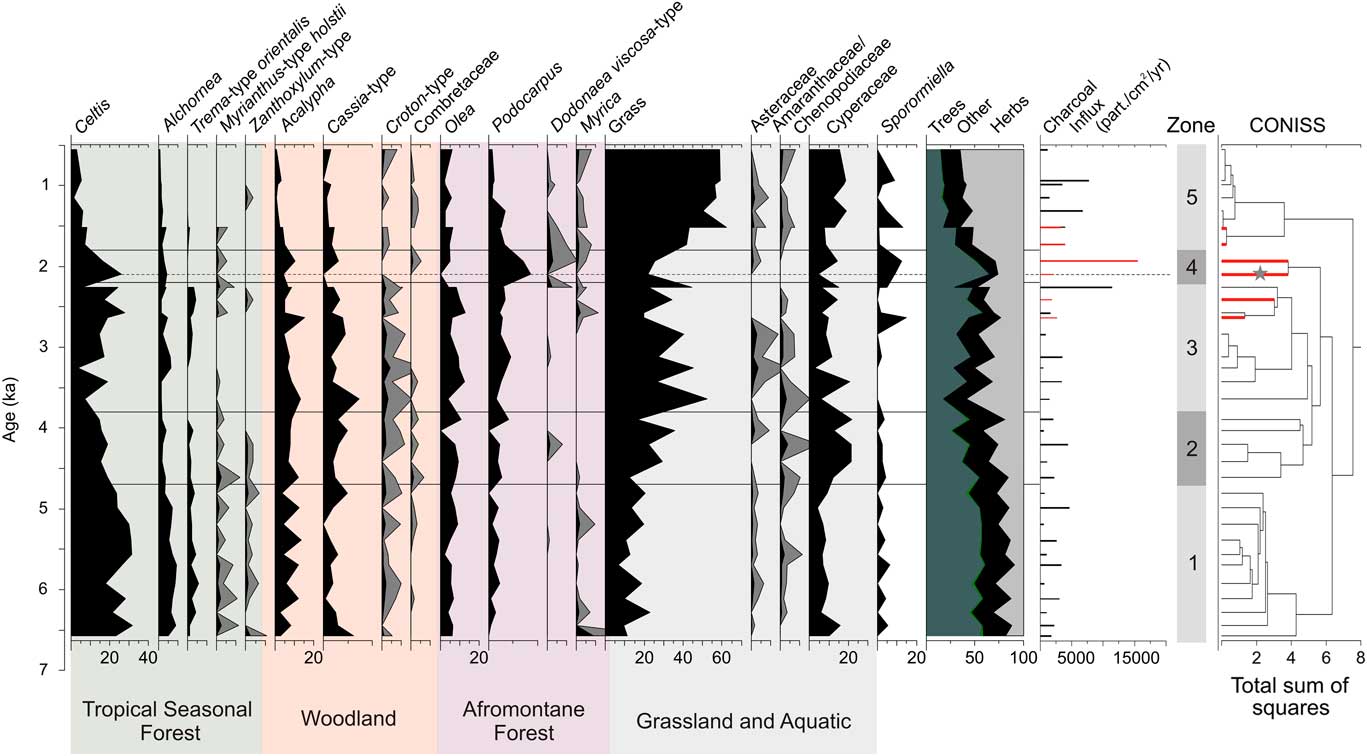
The fossil pollen record is based on a total of 36 new samples from two cores. Thirty samples were taken every ~25 cm from E96-5M (752 cm total), and the hiatus in E96-5M was filled by 6 samples from E96-1P every ~50 cm from 215 to 473.5 centimeters below the lake floor (cmblf). These 36 samples covered a period from ~6 to 0.5 ka. In order to investigate vegetation change over the entire Holocene, early Holocene samples analyzed by Beuning and Russell (Reference Beuning and Russell2004) were added to the newly analyzed late Holocene pollen record. All samples were processed using standard pollen extraction methods, including a hydrofluoric acid digestion and acetolysis (Faegri et al., Reference Faegri, Iversen, Kaland and Krzywinski1989). Lycopodium spores were added to calculate concentrations, and all samples were sieved at 10 μm to remove clays (Stockmarr, Reference Stockmarr1971). Pollen counts ranged from 300 to 500 grains per sample with the exception of 4 samples with low pollen counts (24–176 grains). We have included these samples in the interpretation of the record as broken grains are always lower than 5%, suggesting no preservation bias. The record comprised 131 pollen taxa, three types of freshwater algae, five categories of fungal spores, and microcharcoal. All naming follows the African Pollen Database (Vincens et al., Reference Vincens, Bremond, Brewer, Buchet and Dussouillez2006), and several atlases of pollen morphology were used for identifications (Maley, Reference Maley1970; Bonnefille and Riollet, Reference Bonnefille and Riollet1980). Pollen abundances were calculated against the sum of all pollen grains and fern spores minus broken grains and aquatics (Cyperaceae, Typha, and Nymphaea). Percentages for Sporormiella were calculated against the sum of terrestrial pollen types, although Sporormiella spores were not included in the sum used to calculate pollen percentages following the method of Davis and Shafer (Reference Davis and Shafer2006). Pollen stratigraphic diagrams were constructed using Tilia (Grimm, Reference Grimm1990), and zonation was determined using constrained cluster analysis with CONISS (Grimm, Reference Grimm1987). The abundance values presented in the “Results” section are a mean for a zone, unless otherwise specified.
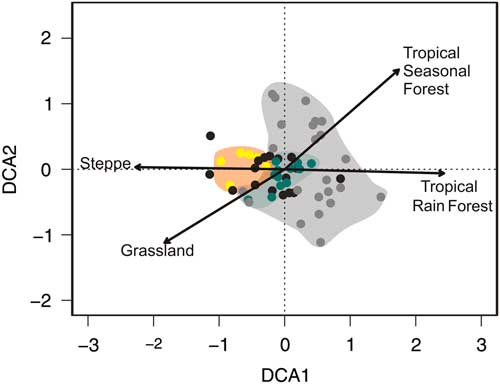
All pollen taxa are presented individually in the pollen diagram in Figure 3 in order to evaluate individual taxon responses; however, biome groupings were also constructed to look at community-scale biogeographic trends within the context of regional climate change (Fig. 4). These groupings followed biomes outlined by Vincens et al. (Reference Vincens, Bremond, Brewer, Buchet and Dussouillez2006) based on modern pollen surface samples in the region, as well as the groups of Beuning and Russell (Reference Beuning and Russell2004) for the Lake Edward basin. These groups are tropical seasonal forest, which includes Moraceae, Macaranga-type, Celtis, and Trema-type orientalis; the Afromontane group (Podocarpus, Olea, Ericaceae undifferentiated, Juniperus procera, Anthospermum, Prunus africana, Hagenia abyssinica, and Ilex mitis); woodland, represented by more open, deciduous species (Acalypha, Cassia, Combretaceae undifferentiated, and Uapaca); and wooded grassland, which includes trees and shrubs that dominate relatively open savanna landscapes (Acacia, Commiphora africana, and Lannea-type). A detrended correspondence analysis (DCA) was conducted using the vegan package in R in order to look at dissimilarity of samples and species turnover through time (Oksanen et al., Reference Oksanen, Blanchet, Kindt, Legendre, Minchin, O’Hara and Simpson2016). This analysis was conducted using all 36 newly analyzed pollen samples from E96-5M and E96-1P, as well as 23 modern surface samples from within the Congo basin rain forest available through the African Pollen Database (http://apd.sedoo.fr/accueil.htm, accessed July 18, 2014; Fig. 5). All fossil and modern samples were assigned to an African biome based on the biomization procedure of Hély et al. (Reference Hély, Bremond, Alleaume, Smith, Sykes and Guiot2006) prior to analysis, and all taxa that contributed more than 5% in a sample were considered.
Pollen percentage diagram from cores E96-5M and E96-1P (individual samples marked in red on corresponding cluster branches). Pollen abundances are relative to the pollen sum for a sample less aquatic taxa. Pollen taxa are color coded based on modern vegetation associations, and zones were determined using a constrained cluster analysis (CONISS). Gray curves for some pollen taxa represent an exaggeration of 5% of the abundances for that taxon. Dashed line with gray star indicates one sample with a very small pollen sum (24 grains). Charcoal influxes are also presented, and samples from E96-1P gave been highlighted in red. (For interpretation of the references to color in this figure legend, the reader is referred to the web version of this article.)

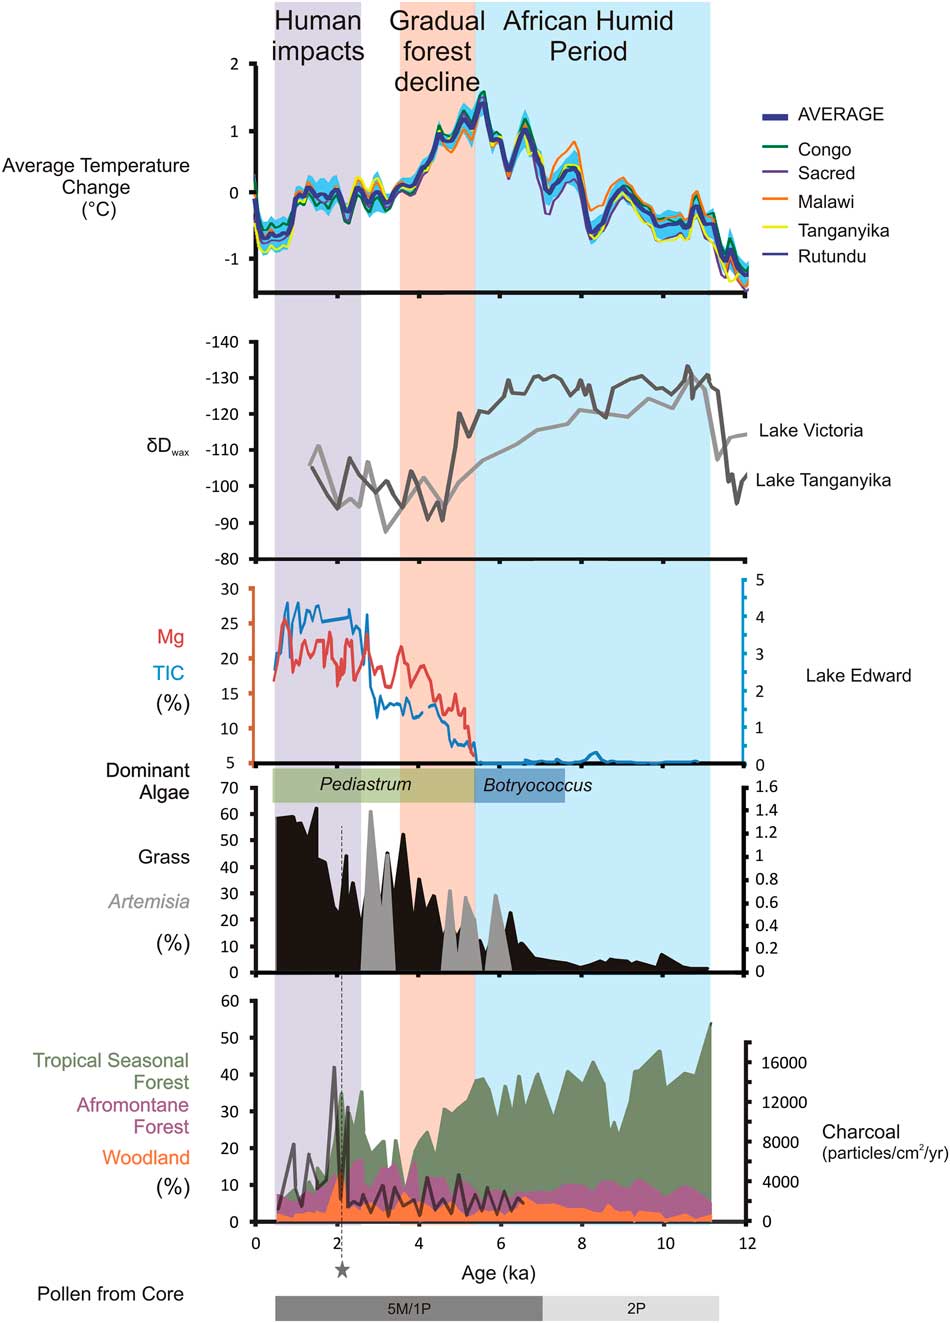
Holocene climate, ecology, and limnology of equatorial East Africa. Average temperature change from organic geochemical reconstructions (Weijers et al., Reference Weijers, Schefuß, Schouten and Damsté2007; Tierney et al., Reference Tierney, Russell, Huang, Damsté, Hopmans and Cohen2008; Woltering et al., Reference Woltering, Johnson, Werne, Schouten and Damsté2011; Loomis et al., Reference Loomis, Russell, Ladd, Street-Perrott and Sinninghe Damsté2012) and δDwax indicating rainfall from Lakes Victoria and Tanganyika (Tierney et al., Reference Tierney, Russell, Huang, Damsté, Hopmans and Cohen2008, Berke et al., Reference Berke, Johnson, Werne, Grice, Schouten and Damsté2012). The bottom three panels are from Lake Edward: % Mg (red), % total inorganic carbon (TIC; blue), and dominant green algae (blue/green bar) on core E96-5M (Russell et al., Reference Russell, Johnson, Kelts, Lærdal and Talbot2003; this study). Abundance of select vegetation types from fossil pollen on cores E96-1P (this study), E96-2P (Beuning and Russell, Reference Beuning and Russell2004), and E96-5M (this study). The blue bar represents the African Humid Period ending at ~5.2 ka, the orange bar represents water chemistry and tropics changes in the lake the mark the beginning of forest decline, and the purple bar represents the decline of forest during regional wetting indicating early human impacts. Dashed line with gray star indicates one sample with a very small pollen sum (24 grains). (For interpretation of the references to color in this figure legend, the reader is referred to the web version of this article.)

Detrended correspondence analysis (DCA) of all fossil samples from E96-5M/E96-1P, as well as 20 modern surface samples from within the Congo basin rain forest. Yellow dots are late Holocene pollen samples (2.5–0.5 ka), green dots are early Holocene pollen samples (6.6–3.7 ka), and black dots are the intermediate fossil pollen samples. Gray dots are the modern surface samples from within a geographic range of (4°N–4°S; 9°–27°E). Vectors represent environmental associations of pollen assemblages to well-studied African biomes (Hély et al., Reference Hély, Bremond, Alleaume, Smith, Sykes and Guiot2006). (For interpretation of the references to color in this figure legend, the reader is referred to the web version of this article.)

In the “Discussion” section, other analyses done previously on cores E96-5M and E96-1P are also presented. Percent total inorganic carbon (% TIC) and percent magnesium (% Mg) were first presented in Russell et al. (Reference Russell, Johnson, Kelts, Lærdal and Talbot2003) and Russell and Johnson (Reference Russell and Johnson2005). Interpretation of % TIC and % Mg follows those of the original publications (i.e., that falling lake water level and increased salinity caused increased carbonate precipitation and Mg/Ca ratios). Fossil pollen analysis published by Beuning and Russell (Reference Beuning and Russell2004) from the 12–6 ka section from core E96-2P is also included in Figure 4. The combination of new data with that of Beuning and Russell (Reference Beuning and Russell2004) was done in order to evaluate vegetation transitions over the entire Holocene. All vegetation groupings have been standardized and include the same taxa.
RESULTS
Fossil pollen concentrations are high (average of 25,730 grains/cm3), and preservation is very good, with the abundance of broken grains never more than 2.5% and frequently less than 1%. The composite E96-5M/E96-1P pollen record has been divided into five zones (Fig. 3), and each has been numbered chronologically. Pollen type abundances reported in this section refer to average values for a zone unless otherwise specified.
Zone 1 (752–512 cm blf, 6.6–4.7 ka, 11 samples from E96-5M)
Zone 1 is characterized by relatively high percentages of arboreal pollen, particularly from lowland forest taxa such as Celtis (26%), Alchornea (6.8%), Trema-type orientalis (2.7%), and Myrianthus-type holstii (0.81%). Pollen from deciduous and woodland taxa is present, but in relatively low abundances, particularly for Cassia-type (2.4%) and Combretaceae (0.14%). Acalypha (7.4%) is the only woodland taxon with high abundances of pollen present during this zone. In contrast, indicators of savanna and wooded grasslands such as grass (14%), Asteraceae (0.49%), and Amaranthaceae/Chenopodiaceae (0.63%) are at minima during zone 1. Charcoal influxes are relatively low (1972 pieces/cm2/yr).
Zone 2 (512–394 cm blf, 4.7–3.8 ka, five samples from E96-5M)
Zone 2 is characterized by a transitional decline in forest pollen taxa, with decreases in most of the pollen from lowland forest taxa that were abundant in zone 1. In particular, Celtis decreases from 19% to 10%, and Trema-type orientalis and Zanthoxylum type decrease to zero. In contrast, pollen from woodland taxa such as Acalypha (8.6%), Cassia-type (3.0%), and Croton-type (1.3%) remains relatively stable, whereas Combretaceae (0.58%) increases. Grass pollen increases in abundance from 12% to 36% through this zone, and Amaranthaceae/Chenopodiaceae (1.3%) pollen is also more abundant. In the aquatics, Cyperaceae (18%) pollen reaches maximum values during this zone. Charcoal influxes remain at low values.
Zone 3 (394–192 cm blf, 3.8–2.2 ka, eight samples from E96-5M, two samples from E96-1P)
Zone 3 is a relatively stable period dominated by moderately high abundances of grass (33%) and other herbs (Asteraceae [1.0%] and Amaranthaceae/Chenopodiaceae [1.0%]). Many of the lowland forest taxa have pollen abundances of zero in much of this zone, including Trema-type orientalis, Myrianthus-type holstii, and Zanthoxylum-type. Celtis (16%) pollen remains moderately abundant with a slight increase toward the end of the zone, but at much lower values than during zone 1. Pollen from woodland taxa reaches maximum values during this zone (Acalypha [8.0%], Cassia-type [8.0%], and Croton-type [1.9%]). Afromontane forest pollen, particularly Olea (8.3%) and Podocarpus (2.9%), increases in abundance during this zone, with Myrica pollen (maximum=2.3%) only reappearing toward the end of the zone. Cyperaceae pollen (10%) decreases in abundance compared with the previous zone. Charcoal influxes (2858 pieces/cm2/yr) remain at values similar to zones 1 and 2.
Zone 4 (192–158.5 cm blf, 2.2–1.8 ka, two samples from E96-1P)
Zone 4 is a very short zone characterized by a brief reversal in the trend of increasing herbaceous taxa observed in zones 2 and 3. Grass pollen (24%) decreases in abundance during this zone, whereas Afromontane pollen taxa, such as Podocarpus (7.9%) and Dodonaea viscosa-type (1.5%), increase abruptly. Pollen from Myrica (0.51%) also remains present during this zone. Additionally, a few lowland forest pollen taxa make a small recovery, particularly Celtis (21%) and Myrianthus-type holstii (0.51%). This zone also shows the first sustained significant increase in charcoal influxes with maximum values reaching 15,461 pieces/cm2/yr, and Sporormiella is also relatively abundant (10%).
Zone 5 (158.5–30.5 cm blf, 1.8–0.5 ka, six samples from E96-5M, two samples from E96-1P)
Zone 5 is characterized by a rapid increase in herbaceous taxa, with grass pollen (54%) abundances reaching the highest values of the record. This increase comes at the expense of all arboreal pollen taxa, which decrease until the end of the zone. In particular, many lowland and highland forest trees, as well as woodland trees, reach their minimum pollen abundances in this zone, including Celtis (5.2%), Alchornea (1.8%), Acalypha (2.4%), Olea (4.2%), and Podocarpus (1.9%). Sporormiella (maximum=11%) abundances are episodically high during this zone, and charcoal influxes become less variable in this zone but remain high for the rest of the record (5237 pieces/cm2/yr).
DISCUSSION
Equatorial forests of the AHP
At Lake Edward, extensive lowland tropical seasonal forests dominated the watershed during the early Holocene (Figs. 3 and 4). Beginning at 11 ka, tropical seasonal forest taxa have percentages as high as 30–40%, suggesting that much of the watershed immediately surrounding the lake was vastly different than today. In particular, the dominance of Celtis could be interpreted as an indication of rain forest presence at Edward, as in other records (e.g., Coetzee, Reference Coetzee1964). It should be noted that Celtis can be found in both deciduous and evergreen lowland forests (Livingstone, Reference Livingstone1967); however, the concomitant relatively high values of tree taxa Myrianthus-type holstii, Alchornea, Zanthoxylum-type, as well as Trema-type orientalis, support the existence of a dense, humid, high-stature forest at this time (White, Reference White1983). These tree taxa, which dominate the pollen record during the early Holocene, have affinities with the Guineo-Congolian rain forests found to the west of the lake. Further supporting this affinity, the results of the DCA illustrate that the early Holocene samples, from 6.6 to 3.7 ka, fall within the same space as modern samples taken within the Congo basin forests today, suggesting that they are taxonomically similar (Fig. 5).
Other lowland East African pollen records covering this period also show a tropical seasonal forest maximum during the early Holocene. At Lake Albert, immediately to the north of Edward, as well as at Lake Victoria, to the east, lowland forest taxa with similar Guineo-Congolian affinities, including Celtis, Alchornea, and Moraceae (which includes Myrianthus-type holstii) expanded at the early Holocene (Fig. 4; Kendall, Reference Kendall1969; Beuning et al., Reference Beuning, Talbot and Kelts1997). The compositional similarity of these assemblages suggests that the corridor of forest may not have been limited to the Edward basin. In particular, the presence of these taxa as far east as Lake Victoria supports the idea that a continuous lowland tract of these Congo-like forests extended far into East Africa during the AHP (Kendall, Reference Kendall1969). Although these forests may have extended far past their modern limit, which occurs at the western rift escarpment, it appears that they did not reach as far as the eastern rift. In this region, although pollen taxa such as Celtis reach modest maxima in abundances at Lake Challa, grass and woodland taxa dominate the AHP (van Geel et al., Reference van Geel, Gelorini, Lyaruu, Aptroot, Rucina, Marchant, Damsté and Verschuren2011).
Dense lowland forests with affinities to Congo forests still exist near Lake Edward today in preserves and in small remnants, such as the Maramagambo Forest and Bwindi Impenetrable Forest (Fig. 1). However, it is clear that as recently as the early Holocene, extensive Guineo-Congolian-like forests were widespread on both sides of the western rift escarpment, which today is thought of as a climatic and biogeographic barrier separating the two regions (Livingstone, Reference Livingstone1967; White, Reference White1983; Nicholson, Reference Nicholson1996). The presence of continuous lowland forest until the forest decline beginning at 4.7 ka and ending by 3.7 ka suggests that the remnant populations near the lake today had only recently been isolated. The recent isolation of the lowland forests has important biological implications not only for the vegetation communities themselves, but also in their role as habitats for other species, such as the gorilla (Gorilla spp.), whose biogeography and genetics are consistent with very recent separation of East and West Africa populations (Tocheri et al., Reference Tocheri, Dommain, McFarlin, Burnett, Troy Case, Orr and Roach2016).
The expansion of lowland tropical seasonal forest likely resulted from enhanced rainfall associated with monsoon intensification during the AHP (e.g., Russell et al., Reference Russell, Johnson, Kelts, Lærdal and Talbot2003; Tierney et al., Reference Tierney, Lewis, Cook, LeGrande and Schmidt2011a). Evidence from organic geochemical reconstructions of rainfall (δDwax) from regions surrounding Lake Edward (Lakes Tanganyika, Albert, and Victoria and the Congo basin) suggest that the early Holocene was much wetter than today (Weijers et al., Reference Weijers, Schefuß, Schouten and Damsté2007; Tierney et al., Reference Tierney, Russell, Huang, Damsté, Hopmans and Cohen2008; Berke et al., Reference Berke, Johnson, Werne, Grice, Schouten and Damsté2012, Reference Berke, Johnson, Werne, Livingstone, Grice, Schouten and Damste2014). The mechanisms driving these rainfall changes are complex; however, lake level modeling studies and δDwax from throughout equatorial Africa support a significant rainfall increase (~20–60%) during the early Holocene (Hastenrath and Kutzbach, Reference Hastenrath and Kutzbach1983; Beuning and Russell, Reference Beuning and Russell2004; Tierney et al., Reference Tierney, Russell, Huang, Damsté, Hopmans and Cohen2008; Berke et al., Reference Berke, Johnson, Werne, Grice, Schouten and Damsté2012). At Lake Edward, a 20–60% increase would result in an average lowland rainfall of 1080–1440 mm/yr during the AHP. Although lower than current rainfall in the Congo basin itself, which averages ~2000 mm/yr (Washington et al., Reference Washington, James, Pearce, Pokam and Moufouma-Okia2013), isotope-enabled modeling results (Tierney et al., Reference Tierney, Russell, Sinninghe Damsté, Huang and Verschuren2011b) suggest that the AHP increase in rainfall may have occurred specifically during the dry season, June, July, and August (JJA). Given a more or less stable short and long rainy season at Lake Edward during the AHP, increased JJA rainfall would result in the absence of any appreciable dry season in the basin. However, other modeling studies do not show the same increase in dry season rainfall (Otto-Bleisner et al., Reference Otto-Bliesner, Russell, Clark, Liu, Overpeck, Konecky, deMenocal, Nicholson, He and Lu2014). Analysis of bioclimatic envelopes for forest and woodland taxa have illustrated largely overlapping tolerances for mean annual rainfall for both vegetation types, suggesting forest does not exclusively require rainfall in excess of 2000 mm/yr as in the Congo basin; however, forest is strongly excluded from areas with dry seasons longer than 3 months (Ivory, Reference Ivory2013). Given the existence even today of a strong gradient in dry season precipitation away from the equator, we suggest that an increase in mean annual rainfall, coupled with no increase in dry season severity, could be sufficient to drive tropical seasonal forest expansion in equatorial East Africa during the AHP.
In contrast, just to the south at Lakes Tanganyika and Malawi, although the lowlands were densely vegetated with arboreal taxa during the AHP, the forest composition differed significantly. At both lakes, vegetation was composed predominantly of miombo woodland taxa (DeBusk, Reference DeBusk1997; Ivory et al., Reference Ivory, Lézine, Vincens and Cohen2012; Ivory and Russell, Reference Ivory and Russell2016). Although lowland forest was not as prevalent at Lake Tanganyika as at Lake Edward, some elements of the tropical seasonal lowland forests were present at Tanganyika in lower abundances. This is not the case as far south as at Lake Malawi, where Celtis disappeared from the pollen record entirely by the end of the Younger Dryas at 11.7 ka (Vincens et al., Reference Vincens, Garcin and Buchet2007; Ivory et al., Reference Ivory, Lézine, Vincens and Cohen2012). The decrease in Guineo-Congolian elements in southeastern Africa during the AHP, and the increase in miombo woodland taxa, indicates a gradient in vegetation composition. In terms of ecosystem functionality, this would have manifested as a strong gradient in vegetation phenology, such that a larger admixture of seasonally deciduous, lower-stature trees would have been present to the south. Furthermore, given the lower species richness but higher endemicity of the miombo region, there may also have been a transition to less biodiverse, more regional floras southward. These vegetation gradients signal that despite higher rainfall over much of East Africa, the present north–south gradient in seasonality also existed during the AHP and had an influence on vegetation composition (Vincens et al., Reference Vincens, Garcin and Buchet2007; Ivory et al., Reference Ivory, Lézine, Vincens and Cohen2012).
The end of the AHP
These extensive lowland equatorial forests lasted until ~4.7 ka when a decline in trees with Guineo-Congolian affinities occurred (Fig. 4). The decline in lowland forest did not initially strongly affect the contribution of arboreal pollen to the record. Although grass increased modestly after 4 ka, it never exceeded 50% of the pollen assemblage, as it does in recent times, and woodland and Afromontane taxa increased gradually from ~6.5 ka (Fig. 4). The continued low to moderate grass abundance, coupled with rising woodland taxa values, suggests that although forest declined, the landscape was still heavily wooded. The increases in Afromontane forest suggest that distal communities expanded in the highlands in the mountainous regions around the lake.
The change in forest composition after the AHP is also marked by increased abundances of Artemisia pollen, an indicator of forest opening, following the decline in tropical seasonal forest (e.g., Scott et al., Reference Scott, Cooremans, De Wet and Vogel1991; Turner and Plater, Reference Turner and Plater2004). However, the continued low charcoal influxes over the AHP transition suggest that wildfires were not widespread or common, and thus that disturbance regimes did not change dramatically during this transition (Fig. 4). This suggests that the turnover from forest to woodland involved small-scale opening of forest patches on the landscape, and that these patches were quickly colonized by more drought-tolerant woody species before fires could inhibit woody encroachment.
In contrast to the retreat of forest at 4.7 ka, δDwax records from Lakes Victoria and Tanganyika indicate a much earlier change in regional hydrology (Fig. 4; Tierney et al., Reference Tierney, Russell, Huang, Damsté, Hopmans and Cohen2008; Berke et al., Reference Berke, Johnson, Werne, Grice, Schouten and Damsté2012). At Lake Victoria, rainfall decreased gradually beginning as early as 8 ka. At Lake Tanganyika, a slightly later and stepwise decline occurred, with initial reductions around 6 ka, followed by a more abrupt transition at ~5 ka. Sedimentologic and geochemical analyses from Lake Edward, conducted on the same core as our pollen analysis (E96-5M), also indicate an earlier drying (Fig. 4; Russell et al., Reference Russell, Johnson, Kelts, Lærdal and Talbot2003). The % TIC and the % Mg in authigenic carbonate, both indicators for water balance and lake salinity, suggest that evaporative concentration resulted in initiation of carbonate precipitation within the lake at 5.2 ka, simultaneous with the abrupt rainfall shift at Tanganyika. Although both the % TIC and % Mg shift abruptly at 5.2 ka, suggesting an abrupt reduction in hydrologic balance, the initiation of carbonate precipitation occurred as a threshold when the lake’s salinity reached carbonate saturation (Russell et al., Reference Russell, Johnson, Kelts, Lærdal and Talbot2003). Thus, drying in the Lake Edward region could have begun earlier.
Whatever the case may be, the gradual retreat of lowland tropical forest beginning at ~4.7 ka (and ending around 3.7 ka) significantly lags the hydrologic changes registered in the lake at 5.2 ka (Fig. 4). Within the lake, regional drying is indicated by multiple lines of evidence for stronger evaporative concentration and rising salinity by 5.2 ka. The changes in lake water chemistry at Lake Edward promoted a marked, abrupt shift in the dominant algal flora coeval with the initiation of chemical sedimentation. During the AHP, Botryococcus dominated the green algae found in the sediments; however, immediately following the increase in % TIC and % Mg, Botryoccocus decreased and Pediastrum reached very high concentrations. The evidence suggests that the change in water chemistry drove a rapid change in trophic state, from a mesotrophic to a more eutrophic state (Tyson, Reference Tyson2012). This switch occurred abruptly (between two samples separated by 206 yr) at the same time as the initiation of carbonate sedimentation itself at 5.2ka. The change in dominant algae illustrates the aquatic communities’ extreme sensitivity to the climate-mediated chemistry of the lake.
Although aquatic ecosystem changes at the end of the AHP appear abrupt, the terrestrial ecosystem response around Lake Edward was a very gradual, progressive change, primarily in forest composition. Although the tropical lowland forest components remained abundant until ~4.7 ka, forest decline began as early as 6.5ka, when Alchornea decreased in abundance and woodland taxa such as Acalypha and disturbance taxa like Artemisia increased (Figs. 3, 4, and 6). Elsewhere in Africa, the end of the AHP is also associated with environmental change. Feedbacks between land cover and climate in North Africa are thought to have resulted in very abrupt, catastrophic vegetation change at the end of the AHP in parts of the Sahara (Ritchie et al., Reference Ritchie, Eyles and Haynes1985; Scheffer et al., Reference Scheffer, Carpenter, Foley, Folke and Walker2001; Foley et al., Reference Foley, Coe, Scheffer and Wang2003). However, this does not appear to be the case elsewhere in Africa. In eastern equatorial Africa, vegetation change was gradual and progressive in the lowland and highlands, as at Lake Edward (e.g., Kendall, Reference Kendall1969, Bonnefille and Riollet, Reference Bonnefille and Riollet1988; Jolly et al., Reference Jolly, Taylor, Marchant, Hamilton, Bonnefille, Buchet and Riollet1997; Mumbi et al., Reference Mumbi, Marchant, Hooghiemstra and Wooller2008; Nelson et al., Reference Nelson, Verschuren, Urban and Hu2012). Paleoecological studies from the Atlantic forests of western Africa and parts of semiarid North Africa also show a gradual transition from ~5 to 3 ka, with intermediate woody cover developing during the transition (Lézine, Reference Lézine2009; Chase et al., Reference Chase, Meadows, Carr and Reimer2010; Vincens et al., Reference Vincens, Buchet and Servant2010). Lézine (Reference Lézine2009) noted the remarkable coherence in the timing of this vegetation transition, beginning around 4.7 ka as we observe at Lake Edward. The synchronicity of records could suggest climatic linkages between the western rift and the Atlantic forests such that the transition was driven by a stronger Atlantic monsoon (Tierney et al., Reference Tierney, Russell, Sinninghe Damsté, Huang and Verschuren2011b; Costa et al., Reference Costa, Russell, Konecky and Lamb2014). Furthermore, the lag in the timing of vegetation change with respect to climate highlights the hydrologic buffer many terrestrial ecosystems have against rapid change in the absence of heightened disturbance.
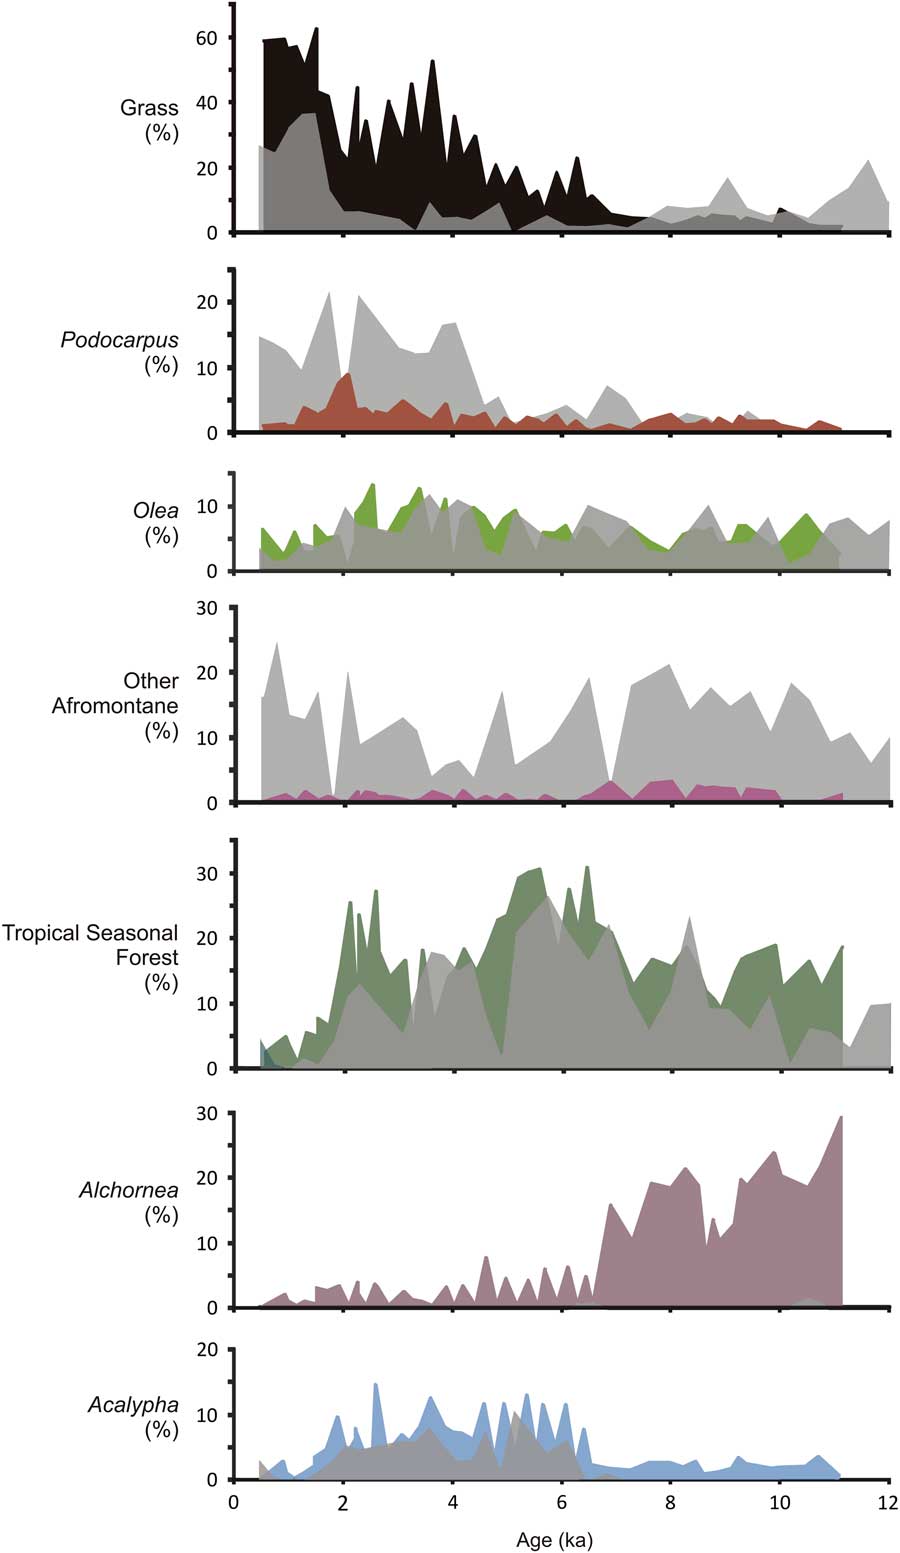
Comparison of main pollen taxa abundances from Lake Edward (912 meters above sea level [m asl]; solid curves) with those from Lake Mahoma (2990 m asl; gray curves; Livingstone, Reference Livingstone1967). (For interpretation of the references to color in this figure legend, the reader is referred to the web version of this article.)

The expansion of woodlands at Lake Edward continued until ~2.5 ka when a brief <1000 yr increase in both lowland and highland forest taxa occurred at the expense of grasses (Fig. 4). The brief increase in tree taxa suggests a recovery of lowland forest, but forest expansion is cut short by a very abrupt decline in all arboreal taxa beginning at 2ka. The forest decline is much different in character from the first decline at the end of AHP. First, the transition at 2 ka is abrupt, with the initial decline in tropical seasonal forest occurring within the sample resolution of this study (~150 yr). Second, the decline in all arboreal taxa and high abundances of grasses (~60%) indicate large-scale structural and compositional changes on the landscape. Furthermore, following the increase in grasses, high charcoal influxes suggest that fire played a very strong role in the rapid conversion of a woody landscape to a grass-dominated landscape (Supplementary Fig. 1).
Multiple lines of evidence suggest that ~2000 yr ago the Lake Edward region experienced the most severe drought of the Holocene. At least two crater lakes to the north of Lake Edward were completely desiccated at this time, and peats deposited in an embayment of Lake George suggested a low stand, if not desiccation (Russell et al., Reference Russell, Verschuren and Eggermont2007). Within Lake Edward, % Mg in calcite peaks at ~1.9 ka in core E96-1P, the hiatus in E96-5M at about 2 ka is associated with the presence of coarse carbonate sands and ooids (carbonate-coated grains; Russell and Johnson, Reference Russell and Johnson2005), and seismic reflection data confirm a low stand of ~18 m below present lake level (McGlue et al., Reference McGlue, Scholz, Karp, Ongodia and Lezzar2006). After this time, however, the crater lakes and Lake George exhibit continuous sedimentation, and the water level of Lake Edward rose. Despite this evidence for wetter conditions, grass remained abundant from 2 ka until recent times. In light of the close coupling of climate and vegetation prior to this event, other mechanisms must therefore promote and sustain this widespread forest and woodland collapse.
Highland and lowland comparison
The Lake Edward watershed includes both lowlands and highlands that may have had unique vegetation histories. It is therefore useful to compare the Lake Edward pollen record with a more local vegetation history in the highlands. In order to do this, we used pollen data from Livingstone (Reference Livingstone1967) from Lake Mahoma. Lake Mahoma is a small glacial lake located at ~2990 m asl in the Rwenzori Mountains (Fig. 1). This elevation is generally dominated by Hagenia abyssinica–Rapanea forest; however, the basin is also surrounded by dense bamboo forest with prominent Podocarpus trees.
Similar to the signal at Lake Edward in the lowlands, the AHP at Lake Mahoma is characterized by high abundances of Celtis, Acalypha, and Moraceae (Fig. 6; Livingstone, Reference Livingstone1967). Although the Lake Mahoma core age model is based on three conventional radiocarbon dates, similarities between many taxa in the records suggests the timing of large-scale events is robust (Livingstone, Reference Livingstone1967). The abundances of Celtis at Lake Edward and Lake Mahoma are remarkably similar in timing and magnitude (Fig. 6), suggesting that, in addition to large-scale lowland expansion of moist forests, lowland/lower montane forest trees extended to higher elevations than present during the AHP. Although many of the forest taxa common during the AHP at Edward are also found in high abundances at Mahoma, some, such as Alchornea, are not present at Mahoma. Celtis today is a widespread genus but commonly occurs below 2000 m in lowland and submontane forests. In contrast, Alchornea is much more strongly associated with lowland forests only (Livingstone, Reference Livingstone1967; White, Reference White1983).
Livingstone (Reference Livingstone1967) noted that the abundance of Celtis at Lake Mahoma, peaking at ~4000 14C yr BP, could reflect a “thermal maximum” during the mid-Holocene. The recent application of temperature proxies based on glycerol dialkyl glycerol tetraethers to African lake sediment generally supports this hypothesis. Although there are no such records presently available from western Uganda, temperature reconstructions from Lakes Tanganyika, Malawi, and Rutundu and Sacred Lake, as well as the Congo basin, all suggest warming during the mid-Holocene (Powers et al., Reference Powers, Johnson, Werne, Castaneda, Hopmans, Sinninghe Damsté and Schouten2005; Weijers et al., Reference Weijers, Schefuß, Schouten and Damsté2007; Tierney et al., Reference Tierney, Russell, Huang, Damsté, Hopmans and Cohen2008; Woltering et al., Reference Woltering, Johnson, Werne, Schouten and Damsté2011; Loomis et al., Reference Loomis, Russell, Ladd, Street-Perrott and Sinninghe Damsté2012, Reference Loomis, Russell, Verschuren, Morrill, De Cort, Damsté, Olago, Eggermont, Street-Perrott and Kelly2017). Averaging these records indicates peak warming of 1–2°C between 6 and 5 ka, when Celtis reached its maximum around Lakes Mahoma and Edward. This suggests that some elements of the lowland forests, particularly those taxa that already occur in submontane regions, extended relatively high onto mountain flanks around Lake Edward in response to a warmer climate.
The response to cooling and drying following the AHP at Mahoma is characterized by a change in forest composition rather than structure, similar to Lake Edward (Fig. 6). However, unlike the increase in lowland woodland observed at Lake Edward, the Lake Mahoma record shows an increase in many of the taxa that are characteristic of its vegetation today, such as Ericaceae, Olea, and Podocarpus. The increase in Podocarpus at ~4 ka is consistent with a similar but smaller magnitude peak in the lowlands at Lake Edward (Fig. 6), suggesting that the increase in Afromontane elements noted in the Lake Edward record at this time is likely not occurring near the lakeshore, but rather in the surrounding highlands, with pollen transported to lower elevations. The subsequent decline in Podocarpus at Lake Edward, which is not registered at Lake Mahoma, suggests that although regional populations declined along with all arboreal taxa after 2 ka, Podocarpus populations at altitude persisted. This could suggest upslope movement of the lower edge of Podocarpus populations at this time, along with reductions of all other trees at lower elevations.
Perhaps the most striking comparison of these two records is that despite the similarity in their vegetation histories during the early/mid-Holocene, the extreme loss of arboreal taxa observed at Lake Edward at ~2 ka is not observed at Lake Mahoma (Fig. 6). Although there is a marked increase in grass abundance at Lake Mahoma as at Lake Edward, at Lake Mahoma the dominant Afromontane trees, such as Podocarpus, remain at high abundances. Thus, we suggest that the increase in grass abundance in conjunction with maintenance of the Afromontane forest trees at Mahoma does not represent an opening of the vegetation but rather the establishment of the bamboo forest that dominates the lake catchment today. This is supported by the concomitant increase in other indicators of open ecosystems at Lake Edward, such as Combretaceae and Amaranthaceae/Chenopodiaceae, which are absent at Mahoma.
Influence of Iron Age peoples
The forest opening recorded at Lake Edward at ~4.7 ka is consistent with evidence for regional drying associated with the end of the AHP. In contrast, following drought at ~2 ka, the landscape was converted to its modern form, dominated by bushlands, thickets, and wooded grasslands. The forest opening occurred despite the fact that the period from 2 ka to present must have experienced a shift toward a wetter climate as indicated by regional lake levels and geochemical signals of moisture balance from δDwax (Fig. 4; Shanahan et al., Reference Shanahan, McKay, Hughen, Overpeck, Otto-Bliesner, Heil, King, Scholz and Peck2015). Furthermore, the mid-Holocene conversion of forest consisted of a gradual turnover of forest trees replaced by woodland taxa, with little evidence for widespread fire or other disturbances. The decline of forest and woodland at ~2 ka was very rapid and characterized by intense wildfire activity that would have facilitated forest clearance. Sporomiella is also more frequent after 2 ka (average pre–2 ka: 2.3%; average post–2 ka: 5.1%), suggesting an expansion of herbivores and additional disturbance of the terrestrial ecosystem. We suggest that, given the rapidity, character, and lack of climatic explanation, recovery from the effects of the 2 ka drought were precluded by technological development and human expansion, resulting in the most recent forest collapse.
This rapid disturbance was coeval with widespread expansion of Iron Age technology and the advent of iron smelting in the region (MacLean, Reference MacLean1994). Iron smelting technology during this time required large amounts of charcoal, necessitating forest clearance, and would have supplied a new mechanism to provoke wildfires on natural lands. Wood harvesting for the production of charcoal, which created forest gaps, along with the higher frequencies of fires on the landscape may have combined to cause this rapid landscape modification.
Interestingly, the transitions observed at Lake Edward at ~2 ka are consistent with other records from East Africa, suggesting large-scale forest clearance by human populations at this time (Marchant and Taylor, Reference Marchant and Taylor1998; Taylor et al., Reference Taylor, Marchant and Robertshaw1999; Mumbi et al., Reference Mumbi, Marchant, Hooghiemstra and Wooller2008; Hall et al., Reference Hall, Burgess, Lovett, Mbilinyi and Gereau2009). The effect of human impact has been interpreted as far south as Lake Tanganyika, where grass abundances rapidly increase in the latest Holocene (Ivory and Russell, Reference Ivory and Russell2016). In contrast, montane forests persist around Lake Mahoma (Livingstone, Reference Livingstone1967). Thus, it seems likely that these early people selectively removed woody elements from the lowland and lower montane regions, where wood supplies were most accessible. This increase in fire frequency and wood harvesting at low elevations as early as 2000 yr ago ultimately led to the development of the highly variable modern architecture of the landscape today, which is dominated by fire-tolerant woodlands at low elevations and fire-sensitive forests only above 1500 m asl.
CONCLUSIONS
We find that the wetter, warmer climate of the early Holocene in equatorial East Africa resulted in the widespread expansion of forests at both low and high elevations. The composition of these forests strongly resembled those of the Guineo-Congolian phytogeographic region, which now only occurs on the eastern side of the western rift in small, degraded patches. Although trophic change within Lake Edward was abrupt, the decline of these forests occurred progressively and synchronously across tropical Africa beginning around 4.7 ka and did not involve strong nonlinear feedbacks with disturbance. Instead, the end of the AHP witnessed expansion of more seasonal woodlands.
The existence of a relatively recent, extensive lowland forest bloc in East Africa has important biogeographic and ecological implications. In particular, the recent connection of western and eastern African flora, as well as the existence of a continuous lowland forest corridor, can help explain the compositional similarity of disjunct remnant forests and montane and submontane communities, which contributed to and were influenced by lowland forest assembly. This lowland-highland and west-east exchange may have contributed to the evolution of biodiversity on longer time scales. Furthermore, the recent disruption of this ecosystem may explain the recent diversification of its animal denizens, such as gorillas. However, future work is needed to constrain the regional and altitudinal limits of these forests, as well as to more fully examine how early Holocene climate change altered montane communities.
Finally, paleoecological records have the potential to be used to inform projections of the effects of future climate change on vegetation. Although the influence of climate on vegetation is irrefutable, our comparison of the forest collapse at the end of the AHP with that which occurred within the last 2 ka suggests that disentangling the role of climate and land-use is essential to understanding rates and mechanisms of land cover conversion. Although climate alone can induce rapid land cover change, we do not observe this in equatorial Africa despite rapid and large-scale climate change. Instead, we find that aridification and climate variability, such as occurred during the late Holocene, resulted in progressive changes in terrestrial ecosystems. The rapid collapse at ~2 ka indicates that climate conditions may also set the stage for rapid, nonlinear forest collapse when land-use goes unchecked and disturbance regimes are altered.
ACKNOWLEDGMENTS
We would like to thank Brown University’s Institute at Brown for Environment and Society for postdoctoral funding and Undergraduate Teaching and Research Awards for sponsoring an undergraduate summer research project. We also thank LacCore at the University of Minnesota for sampling and core curation assistance. Finally, thanks to Josephine Benson and Kristina Beuning for pollen analysis, Mike McGlue for useful conversations, and Maria Orbay-Cerrato and Blake DeVaney for pollen extraction.
SUPPLEMENTARY MATERIAL
To view supplementary material for this article, please visit https://doi.org/10.1017/qua.2017.48