Implications
Backfat fatty acid composition (FAC) is a heritable trait and could be changed through genetic selection. Moreover, the results show that selection aimed to change carcass traits would affect backfat FAC and fat quality.
Introduction
Subcutaneous and intramuscular fat (IMF) content and composition strongly contribute to the nutritional and technological values of fresh and seasoned pork products and therefore they are of significant economic interest. The relative amount of saturated fatty acids (SFA), monounsaturated (MUFA) and polyunsaturated fatty acids (PUFA) in pig carcass and meat is extremely important both for the food processing industry and for consumers. In particular, thickness and FAC of subcutaneous fat play an important role in dry-cured hams during seasoning period, as backfat prevents excessive seasoning loss and worsening of organoleptic characteristics (Bosi and Russo, Reference Bosi and Russo2004). Due to the distinct melting points shown by different fatty acids (FA), variation in lipid composition also plays an important effect on fat firmness (Suzuki et al., Reference Suzuki, Ishida, Kadowaki, Shibata, Uchida and Nishida2006).
However, technological requirement by the seasoning industry and dietary demands by consumers do not completely match. Dry-cured ham industry requires meat with a limited amount of PUFA (Bosi and Russo, Reference Bosi and Russo2004) as they are more likely to incur in lipolytic and oxidative processes, causing rancidity, abnormal flavours, fat softness and altered organoleptic properties of dry-cured hams (Wood et al., Reference Wood, Richardson, Nute, Fisher, Campo, Kasapidou, Sheard and Enser2004; Juárez et al., Reference Juárez, Dugan, Aldai, Aalhus, Patience, Zijlstra and Beaulieu2011). However, consumers are interested in products with improved nutritional quality and enriched in PUFA. Polyunsaturated fatty acids are essential for life, as they represent a structural component of cell membrane and take part in the synthesis of a wide variety of molecules with key biological functions (Wallis et al., Reference Wallis, Watts and Browse2002).
On the contrary, high percentage of SFA has positive effects on fat firmness and oxidative stability (Wood et al., Reference Wood, Richardson, Nute, Fisher, Campo, Kasapidou, Sheard and Enser2004), but is generally thought to have a negative impact on human health (Mensink et al., Reference Mensink, Zock, Kester and Katan2003).
Fatty acids composition is influenced by breed, diet, age, sex, fatness and genotype (Pena et al., Reference Pena, Ros-Freixedes, Tor and Estany2016). So far, efforts to change FAC of pig fat depots have mainly been concerned with the integration of unsaturated FA sources in pig diets (Raes et al., Reference Raes, De Smet and Demeyer2004; Dugan et al., Reference Dugan, Vahmani, Turner, Mapiye, Juárez, Prieto, Beaulieu, Zijlstra, Patience and Aalhus2015), and little research has been performed on the genetic variability of FAC. A limited number of studies are available both on the genetic basis of backfat FAC and on the genetic connections between backfat FAC and other carcass traits.
This work aims to estimate the heritability of backfat FAC, Semimembranosus muscle (SM) IMF content and other carcass traits in a population of Italian Large White heavy pigs. Genetic and phenotypic correlations among these traits will be also estimated.
Material and methods
Sampling
A purebred population of 950 Italian Large White pigs included in the national sib-testing selection programme of Italian National Association of Pig Breeders (Associazione Nazionale Allevatori Suini (ANAS), http://www.anas.it) was investigated in this study. The sib-testing programme is based on the performances of triplets of full sibs (two females and one castrated male) in the testing station. The experimental population came from 393 litters by 87 boars and 371 sows. Each group of siblings entered the central testing station at the age of 30 to 45 days and kept together in the same box for the following 6 weeks. The actual testing period lasted a maximum of 145 days to an average final live weight of about 150 kg. During the testing period siblings were kept separated, fed the same finishing diet at a quasi ad libitum feeding level. All animals were kept and slaughtered according to Italian and European laws on pig welfare as reported in the ‘Ethics statement’ section. Pigs were slaughtered in 27 different days between 2011 and 2012 at the same commercial abattoir. Each litter was slaughtered in at least two different dates.
Backfat tissue (including both inner and outer layers) and SM samples were taken on the trimming line from the left carcass side, wrapped in aluminium foil, immediately put in vacuum-sealed bags and frozen in liquid nitrogen. The samples were kept at −80°C for further use. Samples of backfat tissue were collected at the level of its maximum thickness. Samples of SM were collected from the thigh, at the same point in all carcasses.
Phenotypes
At slaughtering hot carcass weight (kg), backfat thickness (BFT) measured in mm by a calibre at the level of Gluteus medius muscle, ultrasonic measures (in mm) taken by Fat-O-Meat’er (FOM, Frontmatec A/S, Kolding, Denmark) between the third and fourth last ribs, 8 cm of the carcass midline of loin and backfat and estimated percentage of lean cuts on carcass were recorded.
Intramuscular fat was determined by extraction with petroleum ether from 1 g of fresh SM by means of a XT15 Ankom apparatus (Ankom, Macedon, NY, USA), according to Official Procedure AOCS Am 5-04 (AOAC, 2005). Intramuscular fat was determined in % as g of IMF per 100 g of tissue.
Backfat lipids were extracted according to Serra et al. (Reference Serra, Buccioni, Rodriguez-Estrada, Conte, Cappucci and Mele2014). Backfat samples (10 g) were finely minced, then for each sample 15 mg were collected, dissolved in 30 ml of chloroform/methanol 2/1 vol/vol, homogenated by using a T-25 Ultra Turrax homogenizer (Janke & Kunkel, Staufen, Germany) and filtered through paper filter to remove the residue of tissues. Solvent was removed by a Büchi 461 rotavapor apparatus (Büchi, Flavil, Switzerland). The sample was trans-esterified with 0.5 ml of a sodium methoxydemethanolic solution (0.5 N); the reaction was achieved at room temperature and was completed in few minutes. Fatty acid methyl-esters were extracted with 1 ml of hexane and injected in a Gas-Chromatograph apparatus (GC 2010 plus, Shimadzu, Columbia, MD, USA) equipped with a flame ionization detector and with a high polar capillary column (SP 2560 100 m×0.25 mm; Supelco, Bellefonte, PA, USA).
Fatty acids methyl-esters were identified by comparison with commercial standard mix of FA methyl-esters (GLC-674; Nuchek, Elysian, MN, USA) addicted with single FA (Nuchek; Larodan, Malmö, Sweden) obtaining a complete standard of 105 FA methyl-esters. For each FA methyl-ester, response factors to flame ionization detector and inter- and intra-assay CV were calculated by using a reference standard butter (CRM 164; Community Bureau of Reference, Brussels, Belgium). Results were expressed as g of FA on 100 g of total FA after the conversion of FA methyl-esters into FA.
The analyzed backfat FA and FA classes are listed in Supplementary Table S1.
Overall, the initial sample size reduced to 881 pigs because classes of factor litter with only one individual were excluded. Moreover, the number of recorded animals was different among phenotypes: with data on different traits recorded on a minimum of 838 to a maximum of 871 animals. Some data were missing because of the unavailability of the online measurement at a slaughterhouse or because some samples were not available or insufficient in size.
Heritability and genetic correlation estimation
Experimental data included information on a three-generation pedigree for a total of 2318 animals, 623 males and 1695 females. The inbreeding coefficient was calculated for all tested animals by the inbreed procedure of SAS software 9.4. Out of the 881 pigs, 401 were inbred with an average inbreeding coefficient of 4.38%. Given this low level of inbreeding it was not considered in the model subsequently.
The components of variance and heritability for a number of traits grouped in the three classes of subcutaneous FAC, carcass quality and meat quality, and the genetic correlations among them, were estimated by restricted maximum likelihood methodology using the VCE software system version 6 (Groeneveld et al., Reference Groeneveld, Kovač and Mielenz2010).
Genetic analyses were carried out by two multiple trait animal models in two different steps: one involving the measures recorded at slaughtering added with individual FA, the other involving the same measurements at slaughtering added with classes of FA.
The model of analysis adopted was:
 $${\rm Y}_{i} {\equals}X_{i} {\plus}W_{i} {\rm f}_{i} {\plus}Z_{i} {\rm a}_{i} {\plus}{\rm e}_{i} $$
where Y i is the observation vector for the ith trait; β i the vector of fixed effects for ith trait (sex: two levels for barrows and gilts; slaughtering date: 27 levels; age at slaughtering as covariate: 1 level); f i the vector of random effect of litter for traits ith (324 levels of litter); a i the vector of additive genetic values of the animals with and without records; e i the vector of residues; X the matrix of incidence of n×p order associating each observation (n) to the pertinent level of sex and slaughter day (p); W the matrix of incidence of n×q order associating each observation (n) to the pertaining litter level (q); Z the matrix of incidence of n×s order associating each observation (n) to each animal (s).
It was assumed that:
 $${\rm Var}\left( {\matrix{ a \cr f \cr e \cr } } \right){\equals}\left( {\matrix{ {A\sigma _{a}^{2} } & 0 & 0 \cr 0 & F & 0 \cr 0 & 0 & R \cr } } \right)$$
in which A is the relationship matrix between all animals; F the variance of litter (F=I
 $$\sigma _{f}^{2} $$
); and R the residual variance (R=I
 $\sigma _{e}^{2} $
).
The equation of mixed models under the animal model have the following matrix form:
 $$\left( {{\rm }\matrix{ {X^{{\rm '}} X\,{\rm }X^{{\rm '}} W\,{\rm }X^{{\rm '}} Z{\rm }} \cr {W^{{\rm '}} X\,{\rm }W^{{\rm '}} \,W{\rm }W^{{\rm '}} Z{\rm }} \cr {{\rm }Z^{{\rm '}} X\,{\rm }Z^{{\rm '}} W\,{\rm }Z^{{\rm '}} Z{\plus}{\rm A}{\minus}1{\rm }\lambda } \cr } } \right)\left( {\matrix{ \beta \cr f \cr a \cr } } \right){\equals}\left( {\matrix{ {X{\rm '}y} \cr {W{\rm '}y} \cr {Z{\rm '}y} \cr } } \right)$$
where
 $\lambda $
is the ratio between
 $$\sigma _{e}^{2} $$
and
 $\sigma _{a}^{2} $
that can also be expressed as (1−h
2)/h
2 (h
2 is the heritability for the trait).
The use of multiple trait model allowed to compute genetic correlation among traits; whereas, phenotypic correlation was estimated using the procedure Proc Corr of software SAS 9.4.
Results and discussion
Sample description and heritability estimates
Table 1 reports minimum, maximum, mean values and standard deviations for the recorded phenotypes. The high carcass weight (119.236±8.525 kg) approaches the weight of typical heavy pigs grown for the production of high quality dry-cured hams, such as Parma and San Daniele, in compliance with official guidelines for the production of Parma and San Daniele hams (Commission Regulation (EC) No 1 107/96 of 12 June 1996). Phenotypes are the results of selection performed over many years by ANAS with the aim of producing pigs with suitable subcutaneous fat thickness while maintaining some genetic progress for average daily gain and feed conversion ratio. The limited variability observed for the carcass weight is the result of the testing station controlled environment. Similar variations were also reported by Virgili et al. (Reference Virgili, Degni, Schivazappa, Faeti, Poletti, Marchetto, Pacchioli and Mordenti2003) and Lo Fiego et al. (Reference Lo Fiego, Macchioni, Minelli and Santoro2010). Lean percentage (48.885±2.728%) and loin thickness (63.331±6.933 mm) indicated a moderate lean mass deposition. These phenotypic measures are in line with the 40% to 54.9% (U, R and O classes of EUROP grid for carcass classification) of carcass lean meat content required for high quality protected designation of origin ham production.
Descriptive statistics for the studied traits with the number of considered pigs (n), the minimum and maximum values, the mean value and the standard deviation

SFA=saturated fatty acids; MUFA=monounsaturated fatty acids; PUFA=polyunsaturated fatty acids.
a Number of considered samples.
b Percentage of carcass lean meat content estimated using Fat-O-Meat’er (FOM) instrument.
c Backfat thickness (BFT) (including rind) measured with FOM instrument on the back between the third and fourth last ribs at 8 cm off the carcass midline.
d Loin thickness measured with FOM instrument on the back between the third and fourth last ribs at 8 cm off the carcass midline.
e Backfat thickness manually measured with a calibre at the level of Gluteus medius muscle.
f Intramuscular fat content (IMF) measured in Semimembranosus muscle by means of a XT15 Ankom apparatus according to Official Procedure AOCS Am 5-04.
g Fatty acids are expressed as percentage on the total fatty acids. The reported fatty acids account for the 96% of the total fatty acids. The remaining fatty acids, such as C14:1 cis-9, C15:0, C17:0, C18:1 cis-11, C20:1 cis-11, C21:1 and C22:1 cis-12, were excluded due to their low quantities in backfat tissue.
Backfat thickness measured with FOM were similar and consistent with data obtained by other authors with the same instrument (Lo Fiego et al., Reference Lo Fiego, Macchioni, Minelli and Santoro2010). Among the observed phenotypes, both BFT measures obtained by FOM and calibre showed higher variability than the other carcass traits. Average IMF content was lower (2.044±1.112%) than the 2.87% found in Italian crossbred pigs by Virgili et al. (Reference Virgili, Degni, Schivazappa, Faeti, Poletti, Marchetto, Pacchioli and Mordenti2003).
In agreement with literature, the most abundant FA classes in backfat were MUFA and SFA (43.703% and 37.599% of the total FA content, respectively; Table 1). In addition, the most represented FA were C18:1 cis-9(n-9) (38.435±1.564%), C16:0 (mean value 22.500±1.304%) and C18:0 (13.210±1.757%).
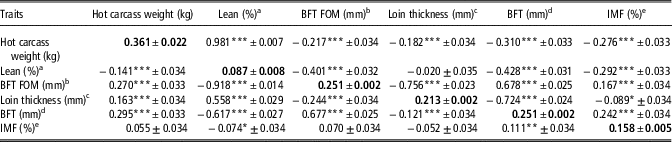
Carcass traits showed heritability levels from 0.087±0.008 for estimated lean percentage to 0.361±0.022 for hot carcass weight (Table 2). Loin thickness heritability (0.213±0.002) is in agreement with the results reported by Miar et al. (Reference Miar, Plastow, Moore, Manafiazar, Charagu, Kemp, Van Haandel, Huisman, Zhang, McKay, Bruce and Wang2014) in Landrace×White and Duroc crossbred pigs for loin muscle area (h 2=0.22±0.08), an estimate based on loin thickness value. Among carcass traits, hot carcass weight showed the highest estimated heritability (0.361±0.022), supporting the values reported in literature for the same trait (Miar et al., Reference Miar, Plastow, Moore, Manafiazar, Charagu, Kemp, Van Haandel, Huisman, Zhang, McKay, Bruce and Wang2014).
Carcass phenotypic measurements of the studied pig population: genetic variance (
 $$\sigma _{a}^{2} $$
), litter variance (
 $$\sigma _{f}^{2} $$
), error variance (
 $$\sigma _{e}^{2} $$
), total variance (
 $$\sigma _{t}^{2} $$
), heritability (h2) and standard error (SE) of heritability

a Percentage of carcass lean meat content estimated using Fat-O-Meat’er (FOM) instrument.
b Backfat thickness (BFT) (including rind) measured with FOM instrument on the back between the third and fourth last ribs at 8 cm off the carcass midline.
c Loin thickness measured with FOM instrument on the back between the third and fourth last ribs at 8 cm off the carcass midline.
d BFT manually measured with a calibre at the level of Gluteus medius muscle.
e Intramuscular fat (IMF) content measured in semimembranosus muscle by means of a XT15 Ankom apparatus according to Official Procedure AOCS Am 5-04.
Heritability values of FA classes were low-to-moderate (Table 3), varying little from 0.245±0.029 for n-3 PUFA to 0.264±0.029 for MUFA. As reported in Table 3, the FA with the lowest heritability was C12:0 (0.106±0.006), whereas all other considered FA showed heritabilities within the range of 0.233±0.030 for C22:6(n-3) and 0.255±0.003 for C14:0. No clear differences in heritability appeared among FA based on their length, saturation and double bound position. The essential FA C18:2(n-6) and C18:3(n-3) showed a moderate level of heritability (0.242±0.001 and 0.235±0.008, respectively), suggesting partial genetic control of digestion, absorption and utilization mechanisms regulating these PUFA deposition. The FA C16:1 cis-7(n-9), C16:1 cis-9(n-7); C18:0, C20:0, C20:2(n-6) and C20:3(n-6) showed a level of heritability roughly ranging from 0.24 to 0.25. Heritabilities found in the present investigation for backfat FA were on average lower than those reported by Sellier et al. (Reference Sellier, Maignel and Bidanel2010), possibly due to differences in the experimental populations and in the environmental conditions.
Backfat fatty acid composition of the studied pig population: genetic variance (
$$\sigma _{a}^{2} $$
), litter variance (
$$\sigma _{f}^{2} $$
), error variance (
$$\sigma _{e}^{2} $$
), total variance (
$$\sigma _{t}^{2} $$
), heritability (h2) and standard error (SE) of heritability

SFA=saturated fatty acids; MUFA=monounsaturated fatty acids; PUFA=polyunsaturated fatty acids.
a Fatty acids are expressed as percentage on the total fatty acids. The reported fatty acids account for the 96% of the total fatty acids. The remaining fatty acids, such as C14:1 cis-9, C15:0, C17:0, C18:1 cis-11, C20:1 cis-11, C21:1 and C22:1 cis-12, were excluded due to their low quantities in backfat tissue.
Genetic and phenotypic correlations between carcass traits
The genetic and phenotypic correlations among carcass traits and the relative standard error are reported in Table 4. Carcass lean percentage showed a significant negative genetic correlation (r g) with BFT measured both by FOM and a calibre (−0.401±0.032 and −0.428±0.031, respectively), but hardly any correlation with loin thickness measured by FOM (−0.020±0.035). As expected, phenotypic correlations (r p) between lean percentage and BFT measured by FOM and calibre, and loin thickness measured by FOM were high (−0.918±0.014; −0.617±0.027 and 0.558±0.029, respectively). The negative genetic correlation between lean percentage and carcass fat coverage is well known and it represents a limit to the simultaneous selection for meatiness and backfat depth maintenance. Thus, this issue has always been a limitation for the concurrent improvement of pig performances and carcass quality for seasoning, and the results of this trial confirm that an excessive increase in lean meat content would hinder both subcutaneous and muscle fat deposition at the expense of seasoned pig product quality.
Estimates of genetic (above diagonal), phenotypic (below diagonal) correlations and heritabilities values (diagonal, in bold) for carcass phenotypic measurements±the relative standard errors for the studied pig population

a Percentage of carcass lean meat content estimated using Fat-O-Meat’er (FOM) instrument.
b Backfat thickness (BFT) (including rind) measured with FOM instrument on the back between the third and fourth last ribs at 8 cm off the carcass midline.
c Loin thickness measured with FOM instrument on the back between the third and fourth last ribs at 8 cm off the carcass midline.
d Backfat thickness manually measured with a calibre at the level of Gluteus medius muscle.
e Intramuscular fat (IMF) content measured in Semimembranosus muscle by means of a XT15 Ankom apparatus according to Official Procedure AOCS Am 5-04.
* P⩽0.05; **P⩽0.01; ***P⩽0.001.
Moreover, IMF shows positive genetic correlation with both BFT measures (0.167±0.034 measured by FOM and 0.242±0.034 by calibre). These evidences suggest that selection schemes aimed at maintaining BFT may also have an indirect effect in keeping an adequate percentage of IMF, an important indicator of meat quality. Besides, this result indicates that a specific partial genetic control on IMF, independent from BFT, exists as already reported by Tyra et al. (Reference Tyra, Ropka-Molik, Terman, Piórkowska, Oczkowicz and Bereta2013).This implies that the identification of different genes and genetic markers associated with IMF and BFT could allow for independent selection and improvement of these two traits.
Genetic and phenotypic correlations between backfat fatty acids and between fatty acids and carcass traits
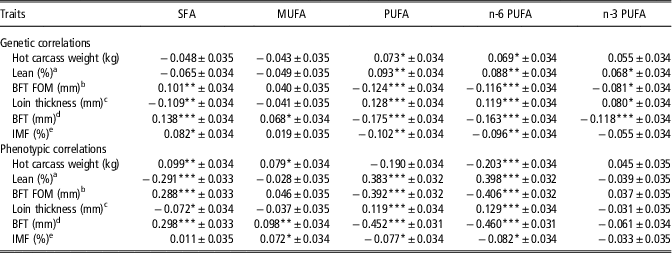
All the FA classes showed to be highly correlated, with the strongest negative correlations found between SFA and the other FA classes (Table 5). These findings are consistent with the biochemical processes involved in FA de novo synthesis, where SFA are the substrate for subsequent elongation and desaturation steps leading to the formation of MUFA and PUFA. C16:0 and C18:0 SFA are among the preferred substrates for the de novo synthesis of MUFA species. The balance among MUFA C16:1 cis-7(n-9), C16:1 cis-9(n-7) and C18:1 cis-9(n-9) is reported to be essential for cell functions (Green et al., Reference Green, Ozguden-Akkoc, Wang, Jump and Olson2010) and depends on the coordinated regulation of elongases (belonging to ELOVL family) and desaturases such as stearoyl-CoA desaturase (SCD) Δ9. The biosynthesis of C18:1 cis-9(n-9), the most abundant MUFA, requires either the direct elongation of C16:1 cis-9(n-7), catalyzed by the enzyme ELOVL elongase 6 (ELOVL6), or a first elongation step of C16:0 to C18:0 performed by ELOVL6, followed by the desaturation of C18:0 to C18:1 cis-9(n-9) catalysed by SCD. Polymorphisms of the genes coding for the enzymes SCD and ELOVL6 have been reported as markers for fat quality, as variants in their sequence have been associated with C18:1 cis-9(n-9) content in Gluteus medius muscle (Estany et al., Reference Estany, Ros-Freixedes, Tor and Pena2014; Ros-Freixedes et al., Reference Ros-Freixedes, Gol, Pena, Tor, Ibáñez-Escriche, Dekkers and Estany2016) and to C16:1 cis-9(n-7) and C16:0 contents in Longissimus dorsi and adipose tissue (Corominas et al., Reference Corominas, Marchesi, Puig-Oliveras, Revilla, Estellé, Alves, Folch and Ballester2015), respectively.
Estimates of genetic (above diagonal), phenotypic (below diagonal) correlations and heritabilities values (diagonal, in bold) for backfat fatty acid categories±the relative standard errors for the studied pig population

SFA=saturated fatty acids; MUFA=monounsaturated fatty acids; PUFA=polyunsaturated fatty acids.
a Fatty acids are expressed as percentage on the total fatty acids.
**P⩽0.01; ***P⩽0.001.
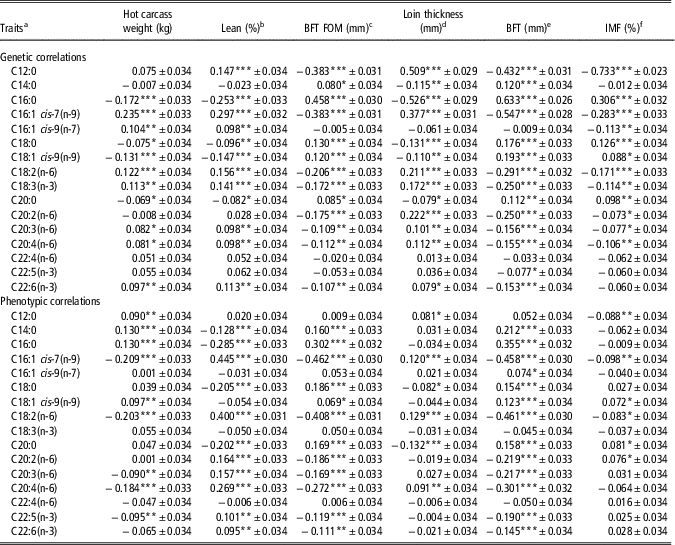
In Supplementary Tables S2 and S3, the genetic and phenotypic correlations between individual FA in backfat are reported. The two main saturated FA, C16:0 and C18:0, are positively correlated (r g=0.364±0.032 and r p=0.419±0.031). C16:0 is negatively correlated with C16:1 cis-7(n-9) and with C18:1 cis-9(n-9) acids (r p=−0.453±0.030 and r g=−0.378±0.031, respectively). Both C16:1 positional isomers show negative genetic correlations with C16:0 (−0.722±0.023 with P<0.001 for C16:1 cis-7(n-9) and −0.254±0.033 with P<0.001 for C16:1cis-9(n-7), respectively) but interestingly the two correlations are very different in size. Literature suggests different roles for these two positional isomers (Guijas et al., Reference Guijas, Meana, Astudillo, Balboa and Balsinde2016) and, although the molecular processes controlling FA biosynthesis are still partly unknown, it is possible to hypothesize that distinct regulation patterns affect C16:1 cis-9(n-7) and C16:1 cis-7(n-9) biosynthesis. In particular, C16:1 cis-7(n-9) originates from Δ9 desaturation of C16:0, whereas C16:1 cis-9(n-7) derives from the partial β-oxidation of C18:1 cis-9(n-9) (Guijas et al., Reference Guijas, Meana, Astudillo, Balboa and Balsinde2016). This may partly explain why the isomer C16:1 cis-7(n-9) is negatively correlated with C18:0 and marginally with C18:1 cis-9(n-9) as well (r g=−0.624±0.027 and −0.065±0.034, respectively). C18:0 also showed a positive genetic correlation with C20:0 content (r g=0.779±0.021, P<0.001): this outcome is related to the origin of C20:0, mainly derived from the elongation of C18:0 (Marinetti, Reference Marinetti2012). Another cluster of correlated FA is composed of C18:2(n-6), C18:3(n-3), C20:3(n-6), C20:4(n-6), C22:4(n-6), C22:5(n-3) and C22:6(n-3). These FA show highly positive genetic correlations among themselves because they are synthesized through subsequent elongation steps from linoleic and α-linolenic essential FA (Leonard et al., Reference Leonard, Kelder, Bobik, Chuang, Lewis, Kopchick, Mukerji and Huang2002). C18:2(n-6) and C18:3(n-3) are essential for mammals and are particularly desirable in human nutrition, but extremely undesirable in pork processing and seasoning because of their susceptibility to oxidation and rancidity. In addition, MUFA, such as C16 positional isomers and C18:1 cis-9(n-9), display desirable effects on consumers’ health (Terés et al., Reference Terés, Barceló-Coblijn, Benet, Álvarez, Bressani, Halver and Escribá2008), whereas they have hardly any impact on the organoleptic quality of seasoned pork products. Thus, selecting pigs with increased proportions of MUFA would improve the nutritional quality of products and reduce the problems of fat oxidation and rancidity (Estany et al., Reference Estany, Ros-Freixedes, Tor and Pena2014; Pena et al., Reference Pena, Ros-Freixedes, Tor and Estany2016). Genetic correlations between backfat FAC and carcass traits and the relative low standard error are reported in Tables 6 and 7. These results suggest that selection for carcass lean percentage and against BFT may increase backfat content of PUFA (r g=0.128±0.034; −0.124±0.034; −0.175±0.034, respectively, for loin thickness, BFT measured by FOM and calibre). The same three carcass traits are unfavourably correlated with C18:2(n-6) (r g=0.211±0.033; −0.206±0.033; −0.291±0.032, respectively, for loin thickness, BFT measured by FOM and calibre). Both PUFA and C18:2(n-6) (linoleic acid) are unfavourable to the technological quality of fat. Conversely, selection schemes for Italian heavy pigs aimed at maintaining a backfat level suitable for high quality seasoned products may have the indirect effects of preserving the content of C18:1 cis-9(n-9) (r g=0.120±0.034 and r g=0.193±0.033 between C18:1 cis-9(n-9) and BFT measured by FOM and calibre, respectively) while reducing PUFA. Backfat depth is furthermore associated with n-6 PUFA with low-to-moderate negative genetic and phenotypic correlations, whereas correlations with n-3 PUFA are weaker (Table 6). These data suggest that selecting in favour of subcutaneous fat would reduce more n-6 PUFA than n-3 PUFA. Interestingly, MUFA are not genetically correlated with BFT and loin thickness, suggesting that a selection for a better MUFA/SFA ratio would not interfere with carcass traits selection.
Genetic and phenotypic correlation values±the relative standard errors between carcass traits and backfat fatty acid classes for the studied pig population: genetic correlation values are in the top part of the table, whereas the phenotypic correlation values are reported in the bottom part

SFA=saturated fatty acids; MUFA=monounsaturated fatty acids; PUFA=polyunsaturated fatty acids.
a Percentage of carcass lean meat content estimated using Fat-O-Meat’er (FOM) instrument.
b Backfat thickness (BFT) (including rind) measured with FOM instrument on the back between the third and fourth last ribs at 8 cm off the carcass midline.
c Loin thickness measured with FOM instrument on the back between the third and fourth last ribs at 8 cm off the carcass midline.
d BFT manually measured with a calibre at the level of Gluteus medius muscle.
e Intramuscular fat (IMF) content measured in Semimembranosus muscle by means of a XT15 Ankom apparatus according to Official Procedure AOCS Am 5-04.
*P≤0.05; **P≤0.01; ***P≤0.001.
Genetic and phenotypic correlation values±the relative standard errors between carcass traits and backfat fatty acids for the studied pig population: genetic correlation values are in the top part of the table, whereas the phenotypic correlation values are reported in the bottom part

a Fatty acids are expressed as percentage on the total fatty acids.
b Percentage of carcass lean meat content estimated using Fat-O-Meat’er (FOM) instrument.
c Backfat thickness (BFT) (including rind)measured with FOM instrument on the back between the third and fourth last ribs at 8 cm off the carcass midline.
d Loin thickness measured with FOM instrument on the back between the third and fourth last ribs at 8 cm off the carcass midline.
e Backfat thickness manually measured with a calibre at the level of Gluteus medius muscle.
f Intramuscular fat content measured in Semimembranosus muscle by means of a XT15 Ankom apparatus according to Official Procedure AOCS Am 5-04.
*P⩽0.05; **P⩽0.01; ***P⩽0.001.
An exception to the correlations between fat deposition and MUFA stored in backfat is represented by C16:1 cis-7(n-9), which showed negative genetic correlations with BFT measured by both FOM and calibre (−0.383±0.031 and −0.547±0.028, respectively, Table 7). At the same time, C16:1 cis-9(n-7) showed hardly any correlation with backfat, and this difference appears to reinforce the hypothesis that C16:1 cis-7(n-9) synthesis could be controlled by distinct regulation patterns than C16:1 cis-9(n-7) and other MUFA, in agreement with the hypothesis reported by Guijas et al. (Reference Guijas, Meana, Astudillo, Balboa and Balsinde2016). Despite C16:1 cis-7(n-9) representing <1% of the total content in FA in pig backfat, the behaviour of this FA could be of practical interest as marker of specific pathways of lipid metabolism such as β-oxidation of FA or lipid droplet accumulation (Guijas et al., Reference Guijas, Meana, Astudillo, Balboa and Balsinde2016).
On the whole, backfat FAC showed to be a moderately heritable trait and thus it could be directly modified through genetic selection. The results obtained pointed out the existence of complex genetic and phenotypic correlations between backfat FAC and carcass traits, such as backfat thickness, loin thickness, lean percentage and IMF. Backfat thickness showed a negative genetic correlation with PUFA and a positive one with SFA, whereas loin thickness showed the opposite trend. Hardly any genetic correlation could be observed both for BFT and loin thickness with MUFA, whereas a negative genetic correlation was found between MUFA and SFA. This is probably the most promising result, as MUFA could be selected for without interfering with carcass traits, while decreasing the content of SFA. Although pig meat quality was relevant to the selection goals, these direct and correlated effects should be taken into account in dealing with the development of selection schemes addressed to modify carcass composition and/or backfat FAC.
Acknowledgements
The authors thank ANAS and Dr Maurizio Gallo for providing the samples and the information about the studied individuals. This work was supported by AGER – Hepiget project (grant no. 2011-0279) and by PRIN2015 national project (no. 201549TZXB001).
Declaration of interest
The authors declare that they have no competing interests.
Ethics statement
Sampling occurred with the permission of the Italian National Association of Pig Breeders (ANAS). Animal care and slaughter of the animals used in this study were performed in compliance with the European rules (Council Regulation (EC) No. 1/2005 and Council Regulation (EC) No. 1 099/2009) on the protection of animals during transport and related operations and at the time of killing. All slaughter procedures were monitored by the veterinary team appointed by the Italian Ministry of Health.
Software and data repository resources
The data analyzed in the current study and the produced outputs are available by request from the corresponding author.
Supplementary material
To view supplementary material for this article, please visit https://doi.org/10.1017/S1751731118002082