Introduction
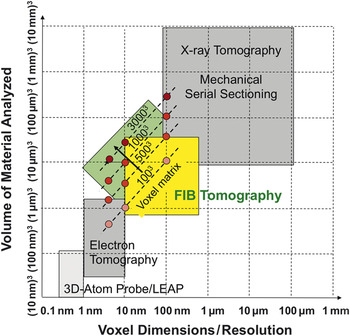
For a fundamental understanding of microstructure effects on materials properties, it is essential to characterize the three-dimensional (3D) topology by means of tomography and image processing. For many modern functional materials, the characteristic length of important topological features, which influence the effective materials properties, is in the range of 10 to 100 nm. As shown in Figure 1 , focused ion beam (FIB) tomography covers this important size range in resolution, which makes it the method of choice for 3D investigations in many materials science disciplines. Reference Holzer, Cantoni, Utke, Moshkalev and Russell1 The method is based on an alternating procedure of FIB-slicing and scanning electron microscopy (SEM) imaging to acquire stacks of images. The method is also described in the literature with equivalent terms such as “FIB-serial sectioning,” “FIB-SEM tomography,” “3D-FIB,” “FIB-slice and view,” and “FIB-nanotomography (FIB-nt).”
Comparison of focused ion beam (FIB) tomography with other 3D microscopy methods.1 As illustrated, FIB tomography is currently evolving toward larger volumes at higher resolutions (i.e., larger voxel matrix). Adapted with permission from References 1 and 4.

FIB tomography started more than 10 years ago using single beam machines. Reference Inkson, Steer, Möbus and Wagner2,Reference Inkson, Olsen, Norris, O’Neill and Möbus3 With the introduction of commercial dual platform FIB-SEM machines, the serial sectioning could be performed without stage tilting and repositioning. This was the basis for automated stack acquisition with reproducible slicing distances down to the 10 nm-range. Reference Uchic, Holzer, Inkson, Principe and Munroe4–Reference Holzer, Muench, Wegmann, Gasser and Flatt6 However, the method initially suffered from some other important limitations, in particular with respect to the size of the image window (that limited the ability to provide representative views of the sample), slow acquisition times (that limited the number of slices), and image quality and drift problems (that limited reliability of quantitative analysis). The method rapidly evolved, and user-friendly automation procedures were introduced. In addition, it was combined with new detection modes for chemical analysis (x-ray energy dispersive spectrometry Reference Lasagni, Lasagni, Holzapfel, Mücklich and Degischer7,Reference Schaffer, Wagner, Schaffer, Schmied and Mulders8 [3D-XEDS]) and for crystallographic information (electron backscatter diffraction Reference Konrad, Zaefferer and Raabe9–Reference Zaefferer, Wright and Raabe12 [3D-EBSD]). Today, FIB tomography provides excellent contrast for many different material types, which is also due to recent advances in detector technology. FIB tomography has been successfully applied to numerous research disciplines.
From the wide range of successful applications of FIB tomography, we describe three examples in order to illustrate the importance of 3D information, which in many cases can currently only be obtained by FIB tomography. The first is the important field of energy materials. FIB tomography has been used to distinguish between active and inactive electrochemical reaction sites (i.e., internal surfaces and three phase boundaries). This information is essential for understanding the influence of microstructures on the performance of electrodes in fuel cells and batteries and for the improvements in corresponding materials design. Reference Wilson, Kobsiriphat, Mendoza, Chen, Hiller, Miller, Thornton, Voorhees, Adler and Barnett13–Reference Shearing, Howard, Jorgensen, Brandon and Harris20 The second example is research on porous materials (e.g., membranes, catalysts, filters, rocks of natural gas reservoirs). Based on the combination of FIB tomography with sophisticated 3D image analysis, parameters of higher order topology such as tortuosity, connectivity, constrictivity, and bottleneck dimensions can be quantified. This information is key to understanding the link between microstructure and effective transport properties of porous materials. Reference Keller, Holzer, Wepf, Gasser, Münchand and Marschall21,Reference Keller, Holzer, Schuetz and Gasser22 Many other examples could be listed where 3D information collected with FIB tomography is important for a fundamental investigation of materials properties. For a more thorough description, we refer the reader to a recent review article. Reference Holzer, Cantoni, Utke, Moshkalev and Russell1
The present article summarizes recent technological improvements related to FIB tomography, including new detector technology (backscattered electrons [BSE] and XEDS), new acquisition procedures that are based on new scan generators, and special techniques for automated drift correction. These improvements lead to higher acquisition rates, better image quality, and more reliable results from image analysis (e.g., segmentation/object recognition).
Recent technological and methodological improvements
Most manufacturers have based their current high-end FIB-SEM systems on their latest SEM platforms. These machines are equipped with electron columns that benefit from the dramatic progress in high-resolution SEM of the last few years. The beam performance (resolution) at low acceleration voltages as well as the detector technology for low energy BSE detection has significantly improved in the latest generation of SEMs.
Nevertheless, there are some differences between image acquisition with high-resolution SEM and combined FIB-SEM machines that must be emphasized. For a high-resolution SEM image, a small probe size, accompanied by a low beam current (typically a few tens of pA) and in general a small working distance of 1–2 mm, can provide ultimate resolutions close to 1 nm (or even below) at 1 keV. In contrast, in an FIB-SEM system, compromises have to be made for geometrical reasons (working distance at coincidence point of electron and ion beam) or for the sake of a high throughput (e.g., during serial sectioning, higher beam currents are required in order to shorten the acquisition time per image). Keeping the sample tilted at the coincident point of ion and electron beams eliminates stage movement and the necessity of acquiring images for repositioning the electron and ion beams after each operation. But this configuration is not ideal for high-resolution SEM imaging. Nevertheless, apart from this limitation in sample positioning, the modern FIB-SEM can take full advantage of recent developments in high-resolution SEM technology. In addition, there are several important improvements that are specific to FIB-SEM technology. Reference Holzer, Cantoni, Utke, Moshkalev and Russell1 These improvements are described in the following sections.
Advancements in detector technology
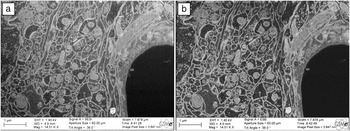
An acquisition of a series of images that represent the volume, a 3D stack, can only be called successful if the acquired images allow easy and automated segmentation of the features of interest. Modern SEM columns have, in addition to the traditional Everhart-Thornley secondary electron (SE)-detector, new detectors that are located inside the column that can detect both secondary and BSEs. These detectors are called “in-column,” “in-lens,” “through the lens,” or “in-beam,” depending on the manufacturer. Having a choice between these detectors allows the operator to tune the imaging conditions in order to generate an image that is most suitable for the later image analysis. Annular BSE detectors high up in the column provide a BSE signal, which is almost free of topographic contrast variations. In addition, as the electrons have to travel “backward” up the column, an energy filtering effect can be observed, and only BSEs with low energy loss (pseudo-single scattering) can reach these detectors. This filtering effect can even be enhanced by application of a grid with negative potential in front of the detector. Reference Steigerwald, Arnold, Bihr, Drexel, Jaksch, Preikszas and Vermeulen23,Reference Pohl and Jaksch24 This type of BSE signal can be virtually free of topographic contrast features, as illustrated in Figure 2 (see also Reference 25).
(a) Secondary electron image of heavy metal stained brain tissue showing pronounced topography contrast from curtaining (vertical streaking in image). (b) Energy filtered (200 eV energy loss allowed) backscattered electron image without topography contrast. (Note: Both are original images without any noise filtering or digital post-processing.) Adapted with permission from Reference 25.

Having multiple detectors available can also be very useful, especially if the signals are recorded simultaneously in one scan. The SE and BSE signals provide complementary information that can be used in combination for a more reliable segmentation (as illustrated in the example section later).
High throughput stack acquisition
During the acquisition of a 3D stack, the time that the electron beam is recording a stack image is the most precious. Any time spent for stage movements and image recognition is overhead that has to be minimized as much as possible in order to achieve high throughput. The “Altas3D” is an optional scan generator and image acquisition system on Zeiss systems optimized for 3D data acquisition. 26 It provides image acquisition modes that increase the throughput and speed of a 3D stack acquisition considerably. In contrast to the conventional serial sectioning with FIB-SEM, the ion and electron beams in the Atlas3D system are not operating in an alternating mode. The ion beam is permanently milling the sample face and moves with a constant speed through the volume to be analyzed. Its speed is adjusted so that when the electron beam has finished acquiring an image, the milling front has moved some distance into the sample, which corresponds to the desired slice thickness. This simultaneous and synchronized imaging and milling practically eliminates any overhead or “dead-time,” and the electron beam permanently produces an image signal from a newly milled FIB section. This acquisition mode works for SEM imaging with BSE detectors, as there is no signal interference from the ion beam-induced SE production during milling. An interlaced milling mode is available if SEM SE and BSE signals need to be recorded. In this mode, the ion beam is blanked when the electron beam scans a line and mills each time the electron beam flies back to start a new line. The overhead can thus be dramatically reduced, and most of the time spent during the whole acquisition is used to produce a signal with the electron beam.
An important aspect for high throughput acquisition is the optimization of the electron probe current, which has an influence on the beam size (i.e., it may limit resolution) as well as on the signal to noise ratio (i.e., it may limit the scan speed for high quality images). For optimal throughput, the beam current should be as high as possible in order to generate an image with high signal to noise ratio and to reduce the acquisition time per slice as much as possible. There is no point scanning with a probe size that is much smaller than the pixel size of the recorded image.
Automated corrections of drift and instabilities
Another critical point for successful 3D reconstruction is the long-term stability of the whole microscope and the electron-optical system. For precise 3D reconstruction based on FIB tomography, there are several sources of drift, which must be corrected either during stack acquisition or during post-processing. The most important drift phenomena concern (1) the slicing distance (z-direction) between the single images in the stack, (2) in-plane (x–y) drift, and (3) shift of imaging conditions (focus and stigmators).
For the acquisition of a single high-resolution image in a SEM, the sample drift and stability of the focus and stigmators are of importance. In contrast, the overall acquisition time for FIB tomography lasts typically one day (for ∼1000 images) or more, and therefore a sample drift of a few nm per minute can cause severe distortion of the acquired image stack if it is not compensated or corrected during the acquisition. Reference marks that are scanned at regular intervals on the sample surface allow detecting sample drift and correcting the ion beam position so that the slice thickness in the z-direction remains constant during the acquisition of the stack. Automated focusing and correction of the astigmatism in certain intervals ensures that the image resolution and the image quality remain constantly high. As the drift rate does not change very fast, the correction intervals can be larger than the intervals between the serial images of the stack.
In general, a post-acquisition image registration (alignment) step is required to remove small shifts between the individual images in the x–y plane before the 3D data set can be analyzed. Most image-processing programs offer the possibility to register the images using an image-to-image based correlation. These algorithms have the disadvantage that they “lock” onto dominant features. Imagine a series of cuts through a bent banana. An image-to-image based alignment will align the individual cross-section to a straight line, and the aligned banana sections will be corrected to form a perfectly straight banana. With a correction based on reference marks, this erroneous alignment can be avoided.
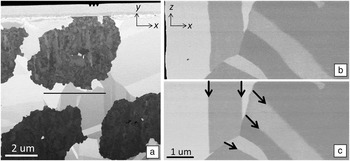
Figure 3 shows an Nb3Sn filament in a Cu matrix. The black line in Figure 3a indicates the position of the virtual cross-section (x–z plane) through the stack. In Figure 3b, the stack has been aligned with image-to-image correlation (with StackReg in Fiji-Software Reference Schindelin, Arganda-Carreras, Frise, Kaynig, Longair, Pietzsch, Preibisch, Rueden, Saalfeld, Schmid, Tinevez, White, Hartenstein, Eliceiri, Tomancak and Cardona27 ), and in Figure 3c, the stack has been aligned based on reference marks (notches) milled on the sample surface (absolute reference marks seen in Figure 3a). The twin boundaries in Figure 3b are curved because the image registration process has locked onto contrast features of the darker filament structure. In Figure 3c, the twin boundaries form perfectly straight planes (arrows), and they are reproduced correctly.
Backscattered electron images of a 3D stack of Nb3Sn filaments in a Cu matrix. (a) Image with reference marks (three notches at top center) milled into the Pt protection layer (covered by C to avoid curtaining caused by the notches). (b) Virtual cross-section extracted at the position of the black line in (a) through a stack after alignment with StackReg (Fiji-Software); twin boundaries are bent. (c) Alignment based on absolute reference marks; twin boundaries (arrows) appear straight. Adapted with permission from Reference 29.

New XEDS detector technology
Chemical analysis by x-ray energy dispersive spectroscopy XEDS requires the acquisition of a full spectrum rather than a single gray level in an image point. Recording a 2048 × 1536 pixels image at a dwell time of 15 µsec/pixel takes about 50 sec, which is reasonably fast for the acquisition of hundreds or thousands of images in a 3D stack in conventional FIB tomography. Thus, the SE or BSE information lies in the 256 gray levels of a typical 8-bit tiff image. Elemental analysis, however, requires recording of a complete XEDS spectrum for each pixel.
First experiments of 3D XEDS were done with the traditional Si (Li-doped) detectors, which had count rates of a few thousand counts/sec. Reference Lasagni, Lasagni, Holzapfel, Mücklich and Degischer7 A dwell time in the range of µsec (as used for conventional FIB-tomography) would not produce a single x-ray count/pixel. Hence, initially longer acquisition times were required for 3D XEDS, which limited the number of slices and pixels in the data cube. The introduction of the silicon drift detector (SDD) design, in combination with improved electronics and large-area detectors, has considerably increased detection efficiency and speed. Count rates of several 10,000 to 100,000 counts/sec have become possible. The SDD technology enables faster XEDS analysis with better count statistics, which opens new possibilities for 3D elemental analysis in materials science. The poor statistics of the spectral data (total number of counts in one point) can be further improved up to a certain level by 2D or 3D binning (summing up neighboring pixels, reducing the resolution) and/or statistical methods such as multivariate statistical analysis. A more in-depth treatment of the 3D-XEDS method is given elsewhere. 28
Examples
Simultaneous acquisition of two detector signals for reliable segmentation of complex microstructures
Porous samples are very often a major problem for FIB nano-tomography. Pronounced curtaining effects can be observed due to the inhomogeneous nature of the milled face. On the polished face, vertical ripples (curtains or waterfall effect) form downward from pores due to a slightly higher milling rate of the ion beam attacking the bottom of the pore. But much more complicated to handle are the imaging “artifacts” caused by a signal that originates from inside of the pores and does not “belong” in the plane of the sliced cross-section. If the pore volume is interconnected, then resin embedding with a conventional epoxy resin can solve this problem. This technique has been successfully applied, for example, in the field of solid-oxide fuel cell research. Reference Wilson, Kobsiriphat, Mendoza, Chen, Hiller, Miller, Thornton, Voorhees, Adler and Barnett13–Reference Holzer, Iwanschitz, Hocker, Keller, Sartoris, Gasser and Muench19 In some cases, it is not possible to fill the pores, for example when they are too sparse, too small, or are not interconnected.
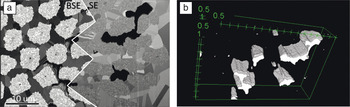
Multifilament superconducting wires consist of filaments of an intermetallic superconducting phase embedded in a metallic matrix. Reference Uglietti, Abächerli, Cantoni and Flükiger29 In Figure 4 a, some pores can be observed in the matrix surrounding the filaments. The BSEs escaping from inside the pores produce gray levels that cannot be related to any material contrast. In Figure 4a, the contrast observed using the Everhart-Thornley SE detector shows a strong topography dependent contrast. Due to the detector location inside the microscope chamber, the electrons emitted from inside the pores show a pronounced shadowing (in-hole) effect (black contrast), and thus pores can easily be distinguished from the solid phases. However, in the BSE image (Figure 4a, left side), the different solid phases have similar contrast levels. When both detector signals (images) are recorded in one scan, they generate two complementary and congruent data sets, which can then be used to segment the pore and solid phases correctly. In the first step, SE images serve to segment the pore volume (Figure 4b), which can then be removed from the data set obtained with BSE (Figure 4a, left side) and that is used for segmentation of different solid phases (not shown).
Microstructure of a superconducting wire with trapped pores. (a) Backscattered electron (BSE) detector provides excellent contrast between different solid phases, but not for the pores. Secondary electron (SE) detector (right half of the image): black pores become apparent. (b) Gray level thresholding of the black regions in the SE image allows for segmenting the pore volume correctly. Adapted with permission from Reference 29.

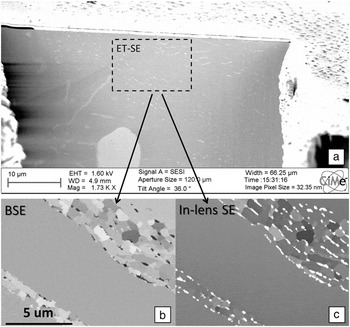
Figure 5 illustrates the different detector perceptions of the microstructure in a solder joint of a Pb-free (SnCuAg type) solder. Reference Maleki, Cugnoni and Botsis30 The images obtained with the conventional Everhart Thornley SE-detector (Figure 5a) are almost featureless due to the lack of topography and suffer from a pronounced shadowing effect. The BSE signal provides a mass density contrast image (Figure 5b), where some precipitates appear darker than the matrix, whereas the in-column SE detector provides a more pronounced contrast (Figure 5c), revealing precipitates in a very bright intensity. The complementary information from SE and BSE is used to distinguish between different types of precipitates and the matrix.
Focused ion beam scanning electron microscopy (FIB-SEM) analysis of Pb-free SnCuAg-type solder. (a) Secondary electron (SE) image shows an almost featureless polished face without topography. Side-by-side (b) backscattered electron (BSE) and (c) SE (in-lens) images recorded simultaneously. The two images reveal the existence of two different types of precipitates (see text for details). Adapted with permission from Reference 30.

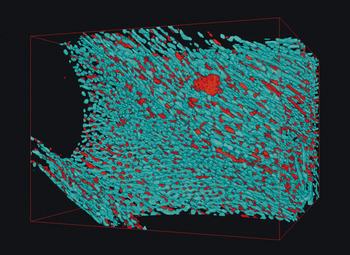
The images in Figure 5 have been recorded with a dwell time of 15 µsec/pixel and an image pixel size of 10 nm and image dimensions of 2048 × 1536 pixels. The slice thickness for the FIB milling was also 10 nm so that the resulting stack of 2000 images revealed true isometric voxels with 10 nm × 10 nm × 10 nm dimensions. The acquisition speed was about one slice per minute. Two sets of images are required for an unambiguous segmentation of the precipitates based on the gray level in the two complementary image stacks: The Cu6Sn5 phase is dark in the BSE image (but white in the SE image). The Ag3Sn phase is white in the SE image and “not dark” in the BSE image. The corresponding 3D reconstruction of the whole 20 µm × 15 µm × 20 µm volume is shown in Figure 6 . Thereby the Sn matrix is set transparent so that the complex microstructure of the two intermetallic precipitates becomes visible. This example shows the full potential of 3D analysis by FIB-SEM using carefully selected and optimized parameters and simultaneously acquired images from two detectors.
Three-dimensional representation of the two different intermetallic phases in the SnCuAg-type solder shown in Figure 5, which are segmented based on simultaneously acquired secondary electron and backscattered electron image stacks. Adapted with permission from Reference 30.

3D XEDS: Potentials and limitations
The previous example shows how compositional information can be obtained if the phases are easily distinguishable in the SE or BSE images. However, for many composite materials, the phases can only be distinguished with the help of chemical information. A true elemental characterization by XEDS analysis requires the acquisition of a complete spectrum in each voxel. Recording and storing a full XEDS spectrum in each voxel is technically not a problem, although the amount of data can become considerably large. The above example with 2 × 2000 3 MB images (SE and BSE) stored as 8-bit tiff files already occupies 12 GB of disk space. A single XEDS elemental map (512 × 512 points) typically already contains ∼100 MB of data. In addition, there are some other physical limitations of 3D-XEDS that require careful consideration when selecting the slice thickness and the image and voxel dimensions.
The spatial resolution of FIB-tomography depends on the beam-sample interaction volume, which increases with beam energy. High-resolution FIB tomography is therefore usually performed at low kV. However, for XEDS analysis, the beam energy must be high enough to ionize the atoms in the specimen. For a correct quantitative analysis, all the elements present in the sample have to be detected. Lowering the voltage to have a high spatial resolution usually also means for XEDS analysis that one has to work with characteristic x-ray lines of low energy. This also increases the possibility of overlapping peaks, which have to be deconvolved for quantification.
Monte-Carlo simulations (free software: CASINO, 31 DTSA-II 32 ) allow a simulation of the interaction volume in dependence of the beam energy and the sample composition. With these simulations, the distribution of generated and emitted (not absorbed by the sample) x-rays can be calculated, which is the basis for purposeful optimization of the experimental conditions (i.e., excitation voltage, beam current, acquisition time). If the elements present in the sample do not have overlapping characteristic x-ray lines in the lower energy range (1–5 keV), then the energy of the electron beam can be lowered so that these elements are just ionized. In this way, the spatial resolution of the XEDS analysis can be increased. The simulations also document that the non-perpendicular incidence of the electron beam on the FIB polished face leads to a slight delocalization of the detected signal, which has to be taken into account during 3D reconstruction.
When the sample remains in the same position and orientation (no stage tilt and/or rotation applied between FIB milling and XEDS analysis) for milling and imaging during the 3D acquisition, the throughput and the overall stability of the system are maximized. It is, however, also possible (like in 3D-EBSD) to rotate and tilt the sample for an optimized XEDS acquisition (perpendicular incidence of the electron beam). This requires additional imaging of reference marks with both beams and image recognition for drift and positioning corrections due to the limited accuracy of the mechanical stage movements. This setup adds a considerable amount of “overhead” and a risk of termination of the automated acquisition due to errors in the image recognition procedures.
The recent progress in detection speed in XEDS microanalysis has widened the possibilities of FIB tomography. Elemental analysis can now be performed in three dimensions within a reasonable time frame, as a single elemental map (slice) can be acquired within 5–10 minutes with sufficient x-ray counts for reliable quantification. The interpretation of the results, however, requires careful analysis from case to case in order to carefully consider the selection of the different parameters prior to a lengthy experiment.
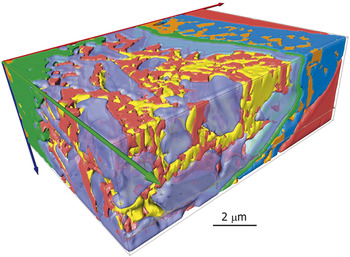
Figure 7 shows a reconstruction of a complex microstructure of a NiTi stainless steel weld. Reference Burdet, Vannod, Hessler-Wyser, Rappaz and Cantoni33 This stack was acquired with 10 kV. For optimum phase identification, it was necessary to combine 3D-XEDS microanalysis and SE image analysis. The SE image stack was recorded with a resolution of 12.5 nm × 12.5 nm pixel size and 12.5 nm slice thickness. After every eight images (100 nm), an XEDS map (256 × 192 pixels) was recorded for six minutes with 100 nm pixel size. The SE data set with 12.5 nm voxel dimension (eight times finer than the XEDS data set) was used for refinement of the segmentation of the different phases. Two chemically close phases could not be segmented using the XEDS data, but in the SE images, the differences in the SE emission allowed an unambiguous identification of these phases. The total acquisition time was 12 hours.
Complex chemical microstructure of a NiTi-stainless steel weld with different phases. The yellow and red phases are chemically very close and required segmentation based on the secondary electron image contrast. Adapted with permission from Reference 33.

Conclusions
FIB tomography has reached a high degree of automation and precision. The limits of the methodology are being constantly pushed in terms of resolution, contrast, stability, and acquisition time. The examples presented in this article highlight some recent and important technological improvements. These developments for 3D-FIB will not only increase the acquisition rate (e.g., due to synchronous slicing and imaging), but also yield so-called super stacks with >30003 voxels and with resolutions down to a few nm that can be acquired automatically almost overnight. The gain in image quality in terms of signal-to-noise ratio and contrast as well as the possibility to record multiple signals simultaneously improve the reliability of quantitative analyses (segmentation and data extraction). Improved drift corrections lead to a more faithful representation of the analyzed volume.