Water quality is a topic of increasing concern, given its importance in the lives of all living beings; even though it is considered a basic human right, millions of people do not have access to clean water (Chaudhary et al., Reference Chaudhary, Mishra and Kumar2017; Farhad Howladar et al., Reference Farhad Howladar, Chakma, Jahan Koley, Islam, Al Numanbakthan, Ahmed, Chowdhury and Akter2020; Pandey et al., Reference Pandey, Mandari, Kim, Kang and Fosso-Kankeu2020). In the past few decades, the presence of a range of compounds in aquatic media has made the situation even more worrying, considering the harmful effects that these substances can have on the health of living beings (Sumpter, Reference Sumpter1998; Joon Kang et al., Reference Joon Kang, Yokota, Oshima, Tsuruda, Yamaguchi, Maeda, Imada, Tadokoro and Honjo2002). These substances are referred to as ‘emerging contaminants’ (EC) and comprise a variety of compounds, such as herbicides, sex steroids and drugs (Zacharewski, Reference Zacharewski1997; Li et al., Reference Li, Liu and Cao2015). Among these compounds, drugs are of most concern because, in addition to the contamination of water resources, they can also lead to increased resistance of some microorganisms to these drugs, putting at risk public health and ecological safety (Bower & Daeschel, Reference Bower and Daeschel1999). ECs have, therefore, drawn attention worldwide due to their potential threat to the health of humans as well as to the environment. These compounds are present in various everyday human products that are released continuously into the environment with the potential for accumulation over time (Norfazilah Wan Ismail & Umairah Mokhtar, Reference Norfazilah Wan Ismail and Umairah Mokhtar2021).
Among these compounds, ivermectin presents significant risk to aquatic ecosystems (Garric et al., Reference Garric, Vollat, Duis, Péry, Junker, Ramil, Fink and Ternes2007); it is considered very toxic to animal and plant species, with negative impacts on species survival, growth and abundance (Schweitzer et al., Reference Schweitzer, Fink, Ternes and Duis2010). Ivermectin is used in veterinary and human medicine as an antiparasitic drug and has hydrophobic characteristics, with low volatility and water solubility, showing a strong affinity for lipids, soil and organic matter, and can persist for several months or even years in soils (Edwards et al., Reference Edwards, Atiyeh and Römbke2001). Essid et al. (Reference Essid, Allouche, Lazzem, Harrath, Mansour, Alwasel, Mahmoudi, Beyrem and Boufahja2020) observed a large reduction in the abundance of Mediterranean Sea nematodes after this drug was widely prescribed as a treatment option for SARS-CoV-2 infection, the cause of the global COVID-19 pandemic (Martin et al., Reference Martin, Robertson and Choudhary2021; Pott-Junior et al., Reference Pott-Junior, Bastos Paoliello, Miguel, da Cunha, de Melo Freire, Neves, da Silva de Avó, Roscani, dos Santos and Chachá2021; Nippes et al., Reference Nippes, Macruz, da Silva and Neves Olsen Scaliante2021). Large-scale consumption of this drug is serious and can lead to an increase in its abundance in environmental matrices, similar to the drug Tamiflu during the H1N1 disease outbreak, whereby increased consumption led to an increase in its environmental concentrations (Chen et al., Reference Chen, Lin and Liao2014, Reference Chen, Wu, Lin, Ieong and Lee2020). Some ivermectin, not metabolized by the body and excreted in feces and urine, will be directed into the sewage system and consequently into wastewater treatment plants, which have limitations in terms of the removal of some contaminants (Bogunović et al., Reference Bogunović, Ivančev-Tumbas, Česen, Sekulić, Prodanović, Tubić, Heath and Heath2021). Ivermectin concentrations in the range 5–20 ng L–1 have been recorded in water resources and tap water in Brittany, France (Charuaud et al., Reference Charuaud, Jardé, Jaffrézic, Liotaud, Goyat, Mercier and Le Bot2019). This demonstrates the importance of checking for and quantifying drugs such as Ivermectin in aquatic matrices, due to the exposure of the population to these contaminants, as well as the need to evaluate their removal from the water.
Adsorption is an interesting option for removal of compounds such as ivermectin, given its easy operation, efficiency and low cost (Dias et al., Reference Dias, Alvim-Ferraz, Almeida, Rivera-Utrilla and Sánchez-Polo2007; Serna-Carrizales et al., Reference Serna-Carrizales, Collins-Martínez, Flórez, Gomez-Duran, Palestino-Escobedo and Ocampo-Pérez2020). The challenge is to apply low-cost, environmentally friendly and efficient adsorbents. Among the available adsorbents, natural clays stand out, given their abundance, low cost when compared to other adsorbents such as activated carbon, and recognition of their efficiency in removing certain drugs from water (Awad et al., Reference Awad, Shaikh, Jalab, Gulied, Nasser, Benamor and Adham2019; de Andrade et al., Reference de Andrade, Oliveira, Canevesi, Landers, da Silva and Vieira2020). In addition, clays can be modified easily, improving their performance as adsorbents. Among the techniques used for clay modification, organophilization is widespread and efficient for the removal of organic pollutants due to the increased affinity of the clay for organic molecules, including ivermectin (Safari et al., Reference Safari, Alam, von Gunten, Samborsky and Alessi2019; França et al., Reference França, Trigueiro, Filho, Fonseca, Jaber, França, Trigueiro, Filho, Fonseca and Monitoring2020). The organophilization process requires careful attention, however, because it is necessary to control time, temperature and agitation. Therefore, the use of a commercial organophilic clay, produced on an industrial scale is advantageous because it produces a material with uniform characteristics, in addition to ready availability and easy access for use in adsorption on a pilot scale. The adsorption of ivermectin was also investigated using kaolinite-biochar (Olu-Owolabi et al., Reference Olu-Owolabi, Diagboya, Mtunzi and Düring2021) and graphene-polyaniline oxide nanocomposite (Rezazadeh et al., Reference Rezazadeh, Dalali and Sehati2018). Therefore, it would be of interest to study of the adsorption of this drug by a commercial organophilic clay, considering the advantages associated with this adsorbent and the environmental implications associated with this drug.
The objective of this work was to evaluate the application of a commercial bentonite-based organophilic clay to adsorb ivermectin from aqueous solution including the characterization of bentonite and to evaluate important process parameters, like the adsorption isotherms, the kinetics of the adsorption, the effect of temperature and pH and the reuse of the adsorbent.
Material and methods
Materials and chemicals
The clay used was the commercial Organophilic Clay ‘Spectrogel, type C’ provided by SpectroChem, Joinville-SC, Brazil. The clay is a bentonite prepared by intercalation of dialkyl dimethylammonium cations (DMA, C35H74N+). The clay is hydrophobic with organophilic character and a significant capacity to remove organic contaminants, such as ivermectin (França et al., Reference França, Trigueiro, Filho, Fonseca, Jaber, França, Trigueiro, Filho, Fonseca and Monitoring2020). The manufacturer provided no further details about synthesis of the material. Ivermectin was purchased from Sigma-Aldrich (98% purity). All tests were performed using deionized water.
Adsorbent characterization
The specific surface area, volume and average pore diameter of the organophilic clay were obtained by N2 gas adsorption analysis (Linde, purity > 99.999%) at 77 K and pressures from 1.2 × 10⁻³ to 0.092 MPa using a Micromeritics ASAP 2020 analyzer. The specific surface area was calculated by applying the equation derived by Brunauer, Emmett and Teller (BET) (Brunauer et al., Reference Brunauer, Emmett and Teller1938) while the average diameter and pore volume in the adsorption and desorption steps were calculated based on the method of Barrett, Joyner and Halenda (BJH) (Barrett et al., Reference Barrett, Joyner and Halenda1951). The thermogravimetric (TG) and differential scanning calorimetry (DSC) curves were obtained using a Netzsch thermostatic instrument model STA 409 PG using a type K thermocouple and platinum-rhodium sample port with a programmed temperature increase, from room temperature to 1000°C, with a nitrogen flow rate of 50 mL min–1 and a heating ramp of 10°C min–1. X-ray diffraction (XRD) analysis was performed on a D8 Advance Bruker diffractometer, with CuKα radiation, 40 kV, 30 mA, a step size of 0.01°2θ, a scanning speed of 2.0°2θ/min, in the range 5–65°2θ. Infrared spectroscopy (FTIR) analysis was performed on a Bruker-Vertex 70 FTIR spectrometer in the range 4000 to 400 cm–1 with 100 scans and a resolution of 4 cm–1 with the KBr method. Other characterizations can be found in the supplementary file.
Adsorption experiments
The adsorption experiments were carried out in batch mode (de Souza et al., Reference de Souza, dos Santos and Vieira2019; Coslop et al., Reference Coslop, Nippes, Bergamasco and Scaliante2021). A shaking table (Shaker Cientec CT/712R) was used with a stirring speed of 200 rpm at 298 K. 0.5 g of organophilic clay adsorbent was added to 100 mL of ivermectin solution with a concentration of 25 mg L–1 as an adsorbate. The aliquots of each experiment were filtered using a stainless-steel support, holder type, and 0.22 μm membranes, supplied by Millipore. The spectrophotometric analyses were performed on a Shimadzu UV-1800UV-VIS spectrophotometer, using a calibration curve obtained at different concentrations of ivermectin at the maximum wavelength of 242 nm. The amount adsorbed was determined by the difference between the initial and final concentration of ivermectin using Equation 1. All tests were performed in triplicate and the results presented refer to the mean of the three values obtained with their respective standard deviations.

where q t is the amount adsorbed per gram of adsorbent at equilibrium (mg g–1), C 0 is the initial concentration of adsorbate (mg L–1), C e is the concentration of adsorbate at equilibrium (mg L–1), V is the volume of solution (L) and m a the mass of adsorbent (g).
Adsorption kinetics
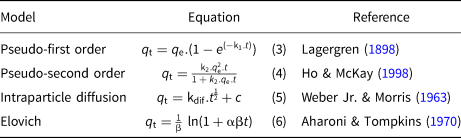
The adsorption kinetics was determined in batch mode using a volume of 100 mL of solution with a concentration of 25 mg L–1 of ivermectin and a mass of 0.5 g of organophilic clay, with removal of aliquots at intervals until a constant concentration of ivermectin in the remaining solution was achieved. Kinetic experiments were performed at 298, 303 and 308 K to calculate the thermodynamic parameters (compare to the section Adsorption thermodynamics). The experimental data were applied to the kinetic adsorption models of pseudo-first order (Equation 3), pseudo-second order (Equation 4), intraparticle diffusion model (Equation 5) and Elovich (Equation 6) (Table 1). Based on these models, the kinetics that best fit the organophilic clay and the ivermectin contaminant were defined. The validation of the adjustments was determined using the R-square (R2) adjusted R-squared (R2adj) coefficient of determination parameters and the normalized mean deviation (Δq e). Δq e (%) was determined using Equation 2.

Non-linear kinetic models of pseudo-first order, pseudo-second order, intraparticle diffusion and Elovich.

q t = amount adsorbed per unit mass at any time t (mg g −1); q e = Amount adsorbed per unit mass in equilibrium (mg g −1); k1 = pseudo-first order adsorption rate constant (min −1); k2 = pseudo-second order adsorption rate constant (g mg −1 min −1); kdif = Intraparticle diffusion rate (mg g−1 min−0.5); c = thickness of the boundary layer (mg g −1); α = initial adsorption rate (mg g–1 min–1) and β = desorption constant (mg g–1).
where q e,exp and q e,cal are the adsorption capacity obtained experimentally and those calculated by the models, respectively, (mg g−1), and N corresponds to the number of experimental points.
Adsorption isotherms
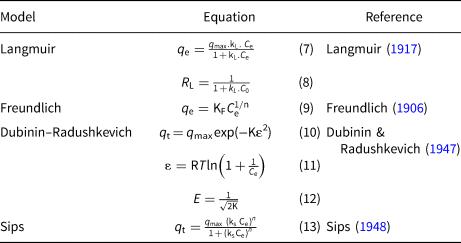
Adsorption isotherms were obtained from batch experiments using 100 mL of ivermectin solution at concentrations of 5–25 mg L–1, 0.5 g of organophilic clay adsorbent and temperatures of 298, 303 and 308 K to obtain thermodynamic parameters. The contact time was determined by the adsorption kinetics, in which the equilibrium was attained within 60 min. The results obtained were fitted with the Langmuir (Equations 7 and 8), Freundlich (Equation 9), Dubinin–Radushkevich (Equations 10–12) and the Sips (Equation 13) isotherm models (Table 2). The validation of the adjustments was determined using the same parameters mentioned in the previous section.
Non-linear isotherm Langmuir, Freundlich, Dubinin-Radushkevich and Sips models.

q max = maximum adsorption capacity (mg g−1); C e = equilibrium concentration of the ivermectin solution (mg L−1); KL = Langmuir equation constant (L mg−1); C 0 = initial ivermectin concentration (mg L–1); RL = separation factor (dimensionless); q e = amount of ivermectin adsorbed at equilibrium (mg g−1); KF = equilibrium constant of the Freundlich equation (mg g−1); n = Freundlich equation constant (dimensionless); k = adsorption energy (mol2 J−2); ε = Polanyi potential (J mol −1); T = absolute temperature (K); R = universal gas constant (8,314 J mol−1 K−1); kS = Sips isotherm constant, with the adsorption energy (L mg–1); n = degree of heterogeneity of the system, which can vary from 0 to 1.
Adsorption thermodynamics
The thermodynamic parameters are important for evaluating the sorption process, as temperature affects directly the adsorption rate (Setshedi et al., Reference Setshedi, Bhaumik, Songwane, Onyango and Maity2013). To assess the effect of temperature on the adsorption process, it is necessary to determine the thermodynamic parameters: adsorption enthalpy (ΔH°ads), free energy of adsorption (ΔG°ads) and adsorption entropy (ΔS°ads). These parameters allow us to understand those characteristics relevant to the final state of the system, whether the process is favorable or not from a thermodynamic point of view, the spontaneity of the system and whether the adsorption occurs with absorption or release of energy. The enthalpy (ΔH°ads), entropy (ΔS°ads) and Gibbs energy (ΔG°ads) were calculated according to Equations 14–16. The adsorption heat (ΔH°ads) was calculated using the linearized Van't Hoff equation (Equation 14).

In Equation 14, Ke is the equilibrium constant defined by q e/C e determined using the graph of C e versus q e, where the slope is Ke (L g–1). To make this parameter dimensionless, the value of the slope is multiplied by the actual density of the adsorbent material (1651.6 g L–1) provided by the manufacturer. A graph (ln Ke) versus (1/T) provides a linear relationship, with slope equal to (-ΔH°ads/R) and linear coefficient (ΔS°ads/R). When the enthalpy or heat of adsorption (ΔH°ads) is known, the variation of entropy (ΔS°ads) and free energy (ΔG°ads) is calculated using the thermodynamic relationships shown in Equation 15.

The activation energy was estimated by the Arrhenius equation that relates the dependence of the rate constant as a function of temperature, as described in the linear form of Equation 16.

where KC is the kinetic constant of the kinetic model that best fitted the experimental data. A is a pre-exponential factor (min–1), E a is the activation energy (J mol–1), R is the universal gas constant (8.31441 J K–1 mol–1) and T is the temperature (K).
pH effect
The pH of the medium affects the adsorption process, as the pH variation changes the chemical balance of the ionic groups present in the adsorbent, thus influencing the electrostatic interactions (Ranjbari et al., Reference Ranjbari, Demeestere, Verpoort, Kim and Heynderickx2022). To evaluate the influence of pH on the adsorption of ivermectin on organophilic clay, 100 mL solutions were prepared with a concentration of 25 mg L–1 of ivermectin with a mass of 0.5 g of clay, pH ranging from 2 to 10, at contact time of 60 min and temperatures of 298, 303 and 308 K. The pH was obtained using a Bel pH meter and the pH of the solution was adjusted to the desired value using HCl (0.1 M) or NaOH (0.1 M).
Reuse of clay
In adsorption processes, the regeneration of the adsorbent and its use in more than one adsorption cycle is desirable and important, both from economic and environmental points of view (Shah et al., Reference Shah, Pre and Alappat2011). In this study, we evaluated the regeneration of organophilic clay using a simple and low-cost methodology involving only water and heating. After the adsorption experiments, the suspensions were filtered with filter paper, washed with deionized water and dried at 373 K for 16 h. Reuse was repeated until the adsorbent lost 50% of its initial adsorption capacity. Tests were performed at the most efficient temperature. The results of these tests were expressed in a block diagram with the quantity adsorbed q e (mg g–1) at the end of each test.
Results and discussion
Adsorbent characterization
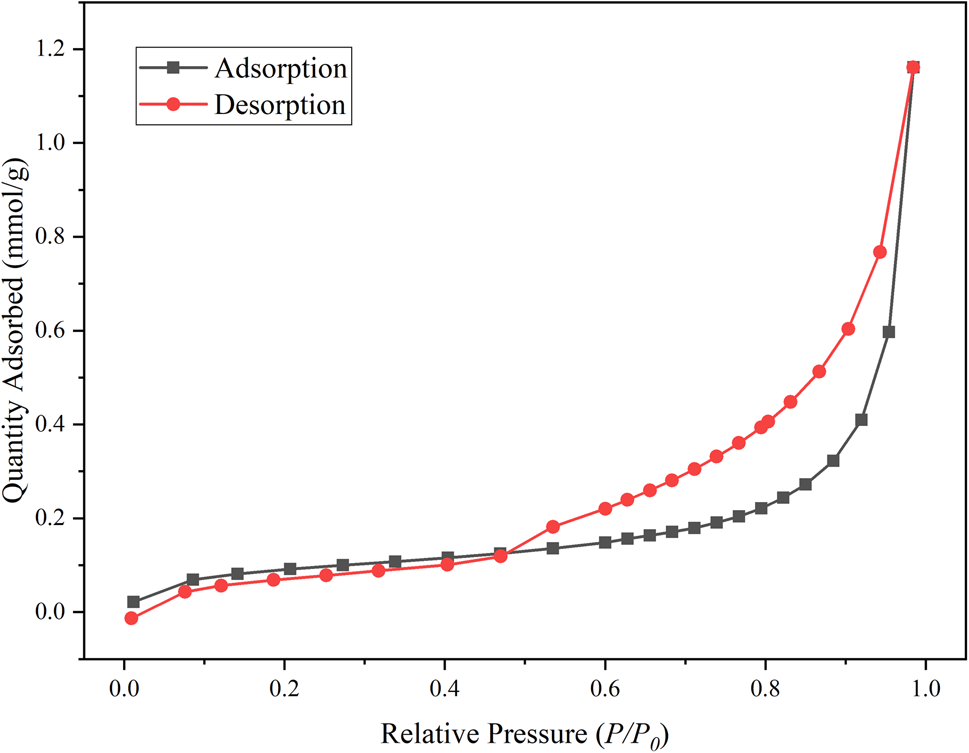
The N2 adsorption/desorption isotherm of the clay at 77 K is shown in Fig. 1. A type II isotherm is observed, with a predominance of macropores and the presence of mesopores, evidenced by the H3 type hysteresis, which is associated with non-rigid aggregates of plate-shaped particles, resulting in slit pores (Awad et al., Reference Awad, López-Galindo, Medarević, Đuriš, El-rahmany, Ibrić and Viseras2020). The specific surface area was 7 m2 g–1 (Table 3), comparable to specific surface areas of organophilic clays reported in similar studies (de Farias et al., Reference de Farias, Silva and Vieira2022).
Adsorption/desorption isotherm of N2 at 77 K for the organophilic clay sample.

Specific surface area (S BET), pore volume (V pore), average pore diameter of the organophilic clay and constant of the BET equation (C).

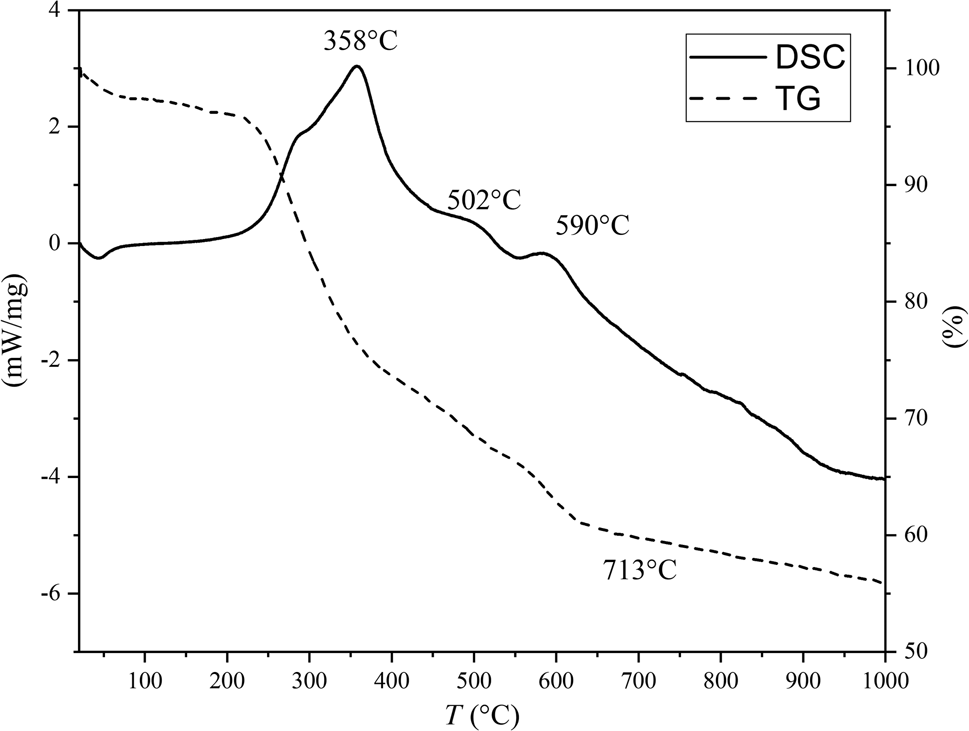
The organophilic clay displays an endothermic peak below 100°C, corresponding to the loss of adsorbed water on the surface and the loss of water associated with interlayer cations. Three first-order transitions are evident at temperatures of 358, 502 and 590°C. The peak at 358°C is probably related to the degradation of the quaternary salt present in the organophilic clay, which causes significant loss of mass from 200°C (Fig. 2). In comparison, the endotherms at 502°C and 590°C can be attributed to the loss of structural hydroxyls of smectite (Speridião et al., Reference Speridião, dos Santos, de Almeida Neto and Vieira2014; Manzotti & dos Santos, Reference Manzotti and dos Santos2019). The weight loss ended at 713°C corresponding to a degradation of ~40% of the material (Speridião et al., Reference Speridião, dos Santos, de Almeida Neto and Vieira2014; Vinicius et al., Reference Vinicius, Silva, Pizarro and Molina2017).
DSC and TG curves for the organophilic clay sample.

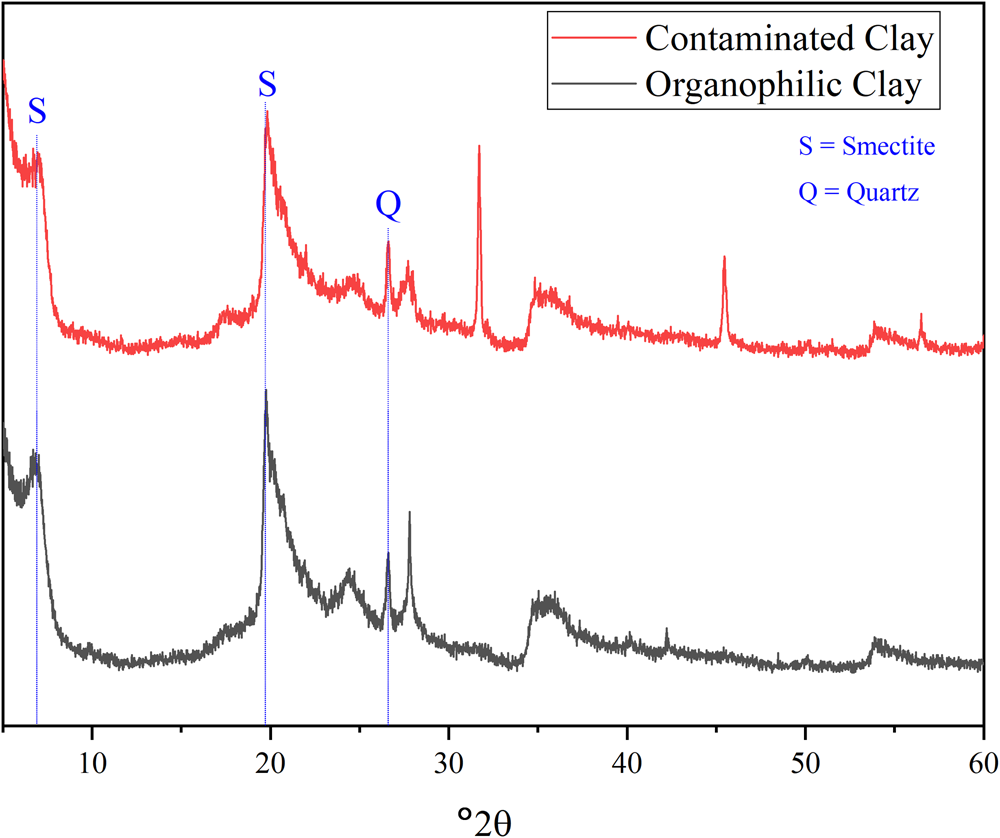
The XRD traces of the pure organophilic clay and the clay after adsorption of ivermectin are shown in Fig. 3. The XRD trace of organophilic clay is typical of smectite (Moore & Reynolds, Reference Moore and Reynolds1989). The crystallite size of smectite was calculated from the 001 peak using the Debye Scherrer equation (D = kλ/(βcosθ)) was 71 nm. The crystal order and crystallite size can influence the adsorption process depending on the characteristics of the contaminant to be removed and the experimental conditions applied (Awad et al., Reference Awad, López-Galindo, Sánchez-Espejo, Sainz-Díaz, El-Rahmany and Viseras2018). Other than smectite, minor quartz (Q) is also present (Maia et al., Reference Maia, de Andrade, da Silva and Vieira2019). The distances between the d 001 basal layers before and after the adsorption process were approximately the same (1.24 nm and 1.23 nm, respectively), indicating that the ivermectin did not intercalate into the interlayer space, but was adsorbed on the surface of the adsorbent, probably via electrostatic forces (Antonelli et al., Reference Antonelli, Malpass, Da Silva and Vieira2020). The d 001 values are typical of Na-smectite. Any further information about the degree of crystal order of Spectrogel was difficult to obtain due to its complexity and because of the lack of information provided by the manufacturer (e.g. DMA loadings, functionalization and degree of impurity).
XRD traces of the organophilic clay and of the clay after adsorption of ivermectin (contaminated clay).

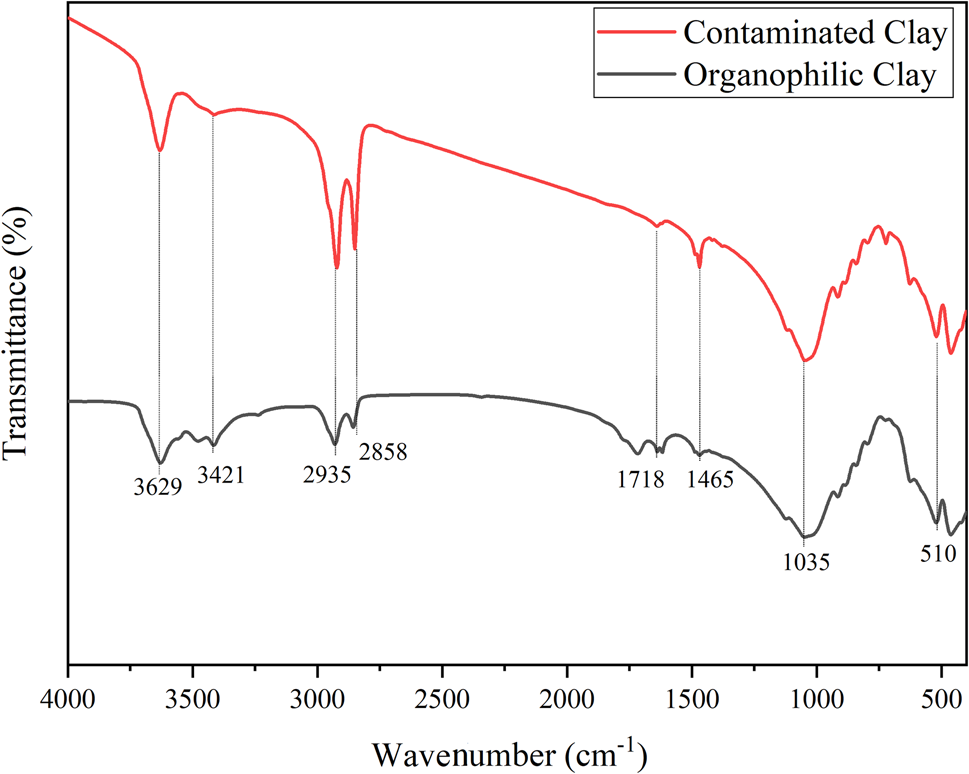
The FTIR spectra obtained for pure organophilic clay and clay after adsorption of ivermectin are presented in Fig. 4. The IR spectrum mainly presents bands in the high-frequency region of the spectrum, which shows higher-energy vibrations. The band at 3629 cm–1 is typical of smectite, corroborating the XRD analysis, due to the ỌH-stretching of structural water (Andini et al., Reference Andini, Cioffi, Montagnaro, Pisciotta and Santoro2006; Araújo et al., Reference Araújo, Melo, Oliveira, Araújo, Araújo and Barbosa2006; Maia et al., Reference Maia, de Andrade, da Silva and Vieira2019). The band at 3400 cm–1 is due to water (H-O-H) stretching in the interlayer space (Araújo et al., Reference Araújo, Melo, Oliveira, Araújo, Araújo and Barbosa2006; Maia et al., Reference Maia, de Andrade, da Silva and Vieira2019). The bands at 2858 and 2935 cm–1 correspond to symmetrical and asymmetric stretching of CH2 groups of the surfactant adsorbed on the clay (Lopes et al., Reference Lopes, Penha, Braga, Melo, Pergher and Petkowicz2011), while the bands at 1465 and 1718 cm–1 are attributed to the CH3 group. Si–O stretching bands are observed at 1034 cm–1 in the organophilic clay. The band at 510 cm–1 is associated with angular deformations of Si–O–Si and Si–O–Al bonds, which are affected by the intercalated cations (Araújo et al., Reference Araújo, Melo, Oliveira, Araújo, Araújo and Barbosa2006; Nóbrega et al., Reference Nóbrega, Wanderley, Leite, Araújo and Melo2011). The spectrum of the organophilic clay after adsorption of ivermectin is comparable to that of the pure adsorbent, with minor shifts of the bands at 3421, 2935, 2858 and 1718 cm–1, attributed to adsorption of ivermectin on the clay. The reduction or enlargement of the bands is attributed to a chemisorption mechanism (de Farias et al., Reference de Farias, Silva and Vieira2022), which causes the adsorbate (ivermectin) to bind on the adsorbent (clay), thus modifying the structure of its chemical bonds.
IR spectra for the sample of organophilic clay before and after adsorption of ivermectin (contaminated clay).

Adsorption experiments
Adsorption kinetics
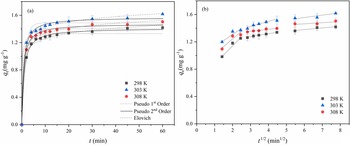
The effect of contact time at different temperatures on the adsorption capacity of ivermectin on organophilic clay was evaluated and the results are shown in Fig. 5a along curve fittings for the pseudo-first order, pseudo-second order and Elovich models. A significant initial adsorption rate of the process was observed at all temperatures. The adsorption capacity increased gradually attaining equilibrium after 60 min. Quick adsorption of contaminants is a desirable feature in wastewater treatment. Increased temperature tended to increase the adsorption capacity a little so ivermectin adsorption on organophilic clay is probably an endothermic process (de Souza et al., Reference de Souza, dos Santos and Vieira2019). However, ivermectin adsorption did not significantly increase with increasing temperature and so supply of heat energy is probably not required to make the process economically viable (Almeida et al., Reference Almeida, Mastelaro, da Silva, Prediger and Vieira2022).
Kinetic curves for the adsorption of Ivermectin in organophilic clay at temperatures of 298, 303 and 308 K and fitting curves for (a) pseudo-first order, pseudo-second order and Elovich models, and (b) for the intraparticle diffusion model.

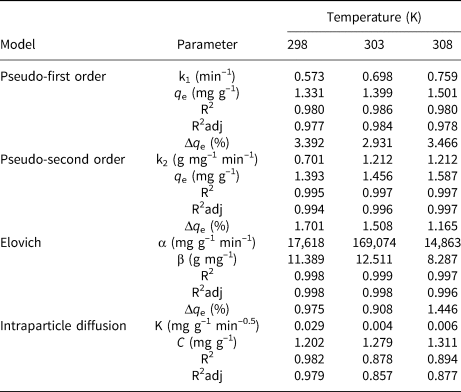
Table 4 lists the results of fitting of experimental data with the pseudo-first and pseudo-second order, Elovich and Intraparticle Diffusion models. The coefficient of determination (R2) and normalized mean deviation (Δq e) were used to evaluate the model that best fitted the data. The Elovich model best fitted the experimental adsorption data. Using the Elovich model, however, it is not possible to suggest a mechanism for the adsorption process, but the model is suitable for highly heterogeneous systems, which is the case for adsorption of Ivermectin on organophilic clay (Örnek et al., Reference Örnek, Özacar and Şengil2007; Sheha & El-Zahhar, Reference Sheha and El-Zahhar2008; Wu et al., Reference Wu, Tseng and Juang2009). Furthermore, because the Elovich model describes chemisorption processes adequately, it follows that the process studied involves chemisorption (Jacques et al., Reference Jacques, Lima, Dias, Mazzocato and Pavan2007). The parameter α of the Elovich model referring to the initial rate of chemisorption is considerably greater than the parameter β (desorption constant) at all temperatures, indicating an affinity between the adsorbent and the adsorbate.
Non-linear kinetic models of pseudo-first order, pseudo-second order, Elovich and intraparticle diffusion.

The fitting of the intraparticle diffusion model for the adsorption process studied is shown in Fig. 5b. Because the fitting lines do not pass through the origin, it follows that the intra-particle diffusion is not the limiting step of adsorption. This is related to the low porosity and small specific surface area of the organophilic clay. The fitting curve for the adsorption is multi-linear, suggesting that the process may involve three stages (Ruiz et al., Reference Ruiz, Cabrita, Mestre, Parra, Pires, Carvalho and Ania2010); the first corresponds to rapid adsorption on the surface of the organophilic clay, the second corresponds to gradual adsorption by intraparticle diffusion and the last is the equilibrium stage, in which the intraparticle diffusion begins to decrease due to the low concentration of adsorbate in the liquid and the low availability of active sites (Bhattacharya & Sharma, Reference Bhattacharya and Sharma2005; Lladó et al., Reference Lladó, Lao-Luque, Ruiz, Fuente, Solé-Sardans and Dorado2015).
Adsorption isotherms
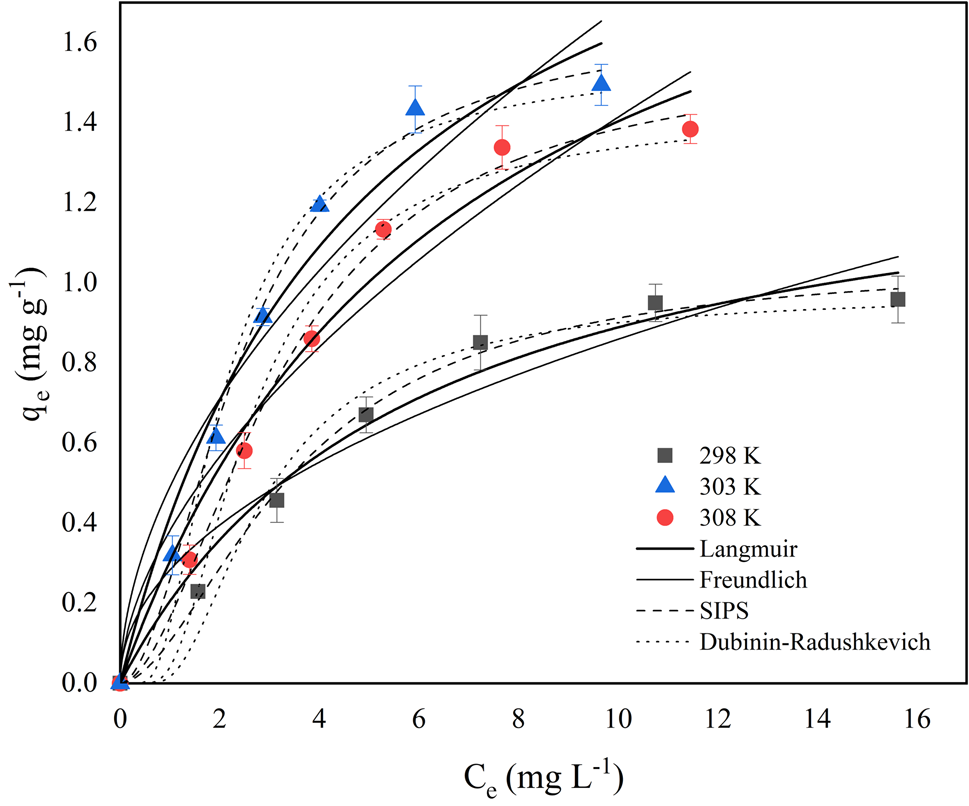
The equilibrium isotherms obtained for a contact time of 60 min at 298, 303 and 308 K, as well as the non-linear fitting curves for the Langmuir, Freundlich, Sips and Dubinin-Radushkevich models are shown in Fig. 6. According to the classification of Giles et al. (Reference Giles, MacEwan, Nakhwa and Smith1960), the isotherms can be classified as type L1, which belongs to the Langmuir class. These isotherms have a non-linear and concave slope relative to the abscissa due to the decreased availability of the adsorption sites as the solution concentration increases. Subgroup 1 represents systems in which the monolayer has not been fully completed yet.
Equilibrium isotherms for the adsorption of ivermectin at 298, 303 and 308 K and fitting of isotherm models.

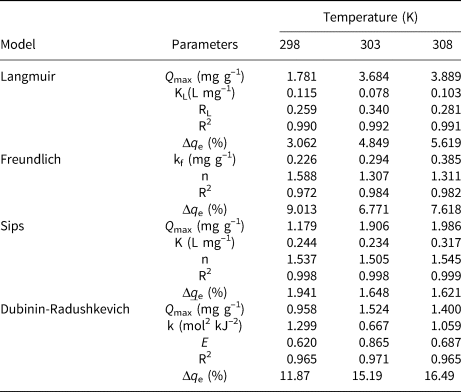
The parameters of the isotherms studied, the coefficients of determination (R2) and the normalized mean deviation (Δq e) are shown in Table 5. The Langmuir and Sips models best fit the data at all temperatures. The Sips model, in addition to R2 values > 0.99), also provided the lowest normalized mean deviation (Δq e), in agreement with the classification proposed by Giles et al. (Reference Giles, MacEwan, Nakhwa and Smith1960). The Freundlich and Dubinin-Radushkevich models yielded smaller R2 values (<0.99).
Parameters and coefficients of determination of Langmuir, Freundlich, Sips and Dubinin-Radushkevich models for aadsorption of ivermectin.

The Sips isotherm is a combination of the Langmuir and Freundlich isotherms. At low adsorbate concentrations, it simplifies the Freundlich isotherm, while in high concentrations, it assumes monolayer adsorption, characteristic of the Langmuir model (de Araújo et al., Reference de Araújo, Quesada, Bergamasco, Vareschini and de Barros2020). The dimensionless parameters of the Langmuir (RL) and Freundlich (n) equations were used to determine whether the isotherm models described adequately the adsorption for each temperature. The RL parameter of the Langmuir isotherm varied between 1 and 0.01 for all temperatures, indicating that the isotherms describe adequately the adsorption in the concentration range studied (Vargas et al., Reference Vargas, Cazetta, Kunita, Silva and Almeida2011). These results are in agreement with the dimensionless parameter (n) of the Freundlich model that exceeded 1, indicating favorable adsorption (Senthil Kumar et al., Reference Senthil Kumar, Ramalingam, Senthamarai, Niranjanaa, Vijayalakshmi and Sivanesan2010). It is concluded then that the adsorption of ivermectin in the organophilic clay is possibly occurring as a monolayer on the homogeneous surface.
The maximum adsorption capacities in the monolayer (Q max) were better estimated by the Langmuir model, which is also compatible with a chemisorption process (de Souza et al., Reference de Souza, dos Santos and Vieira2019).
Adsorption thermodynamics
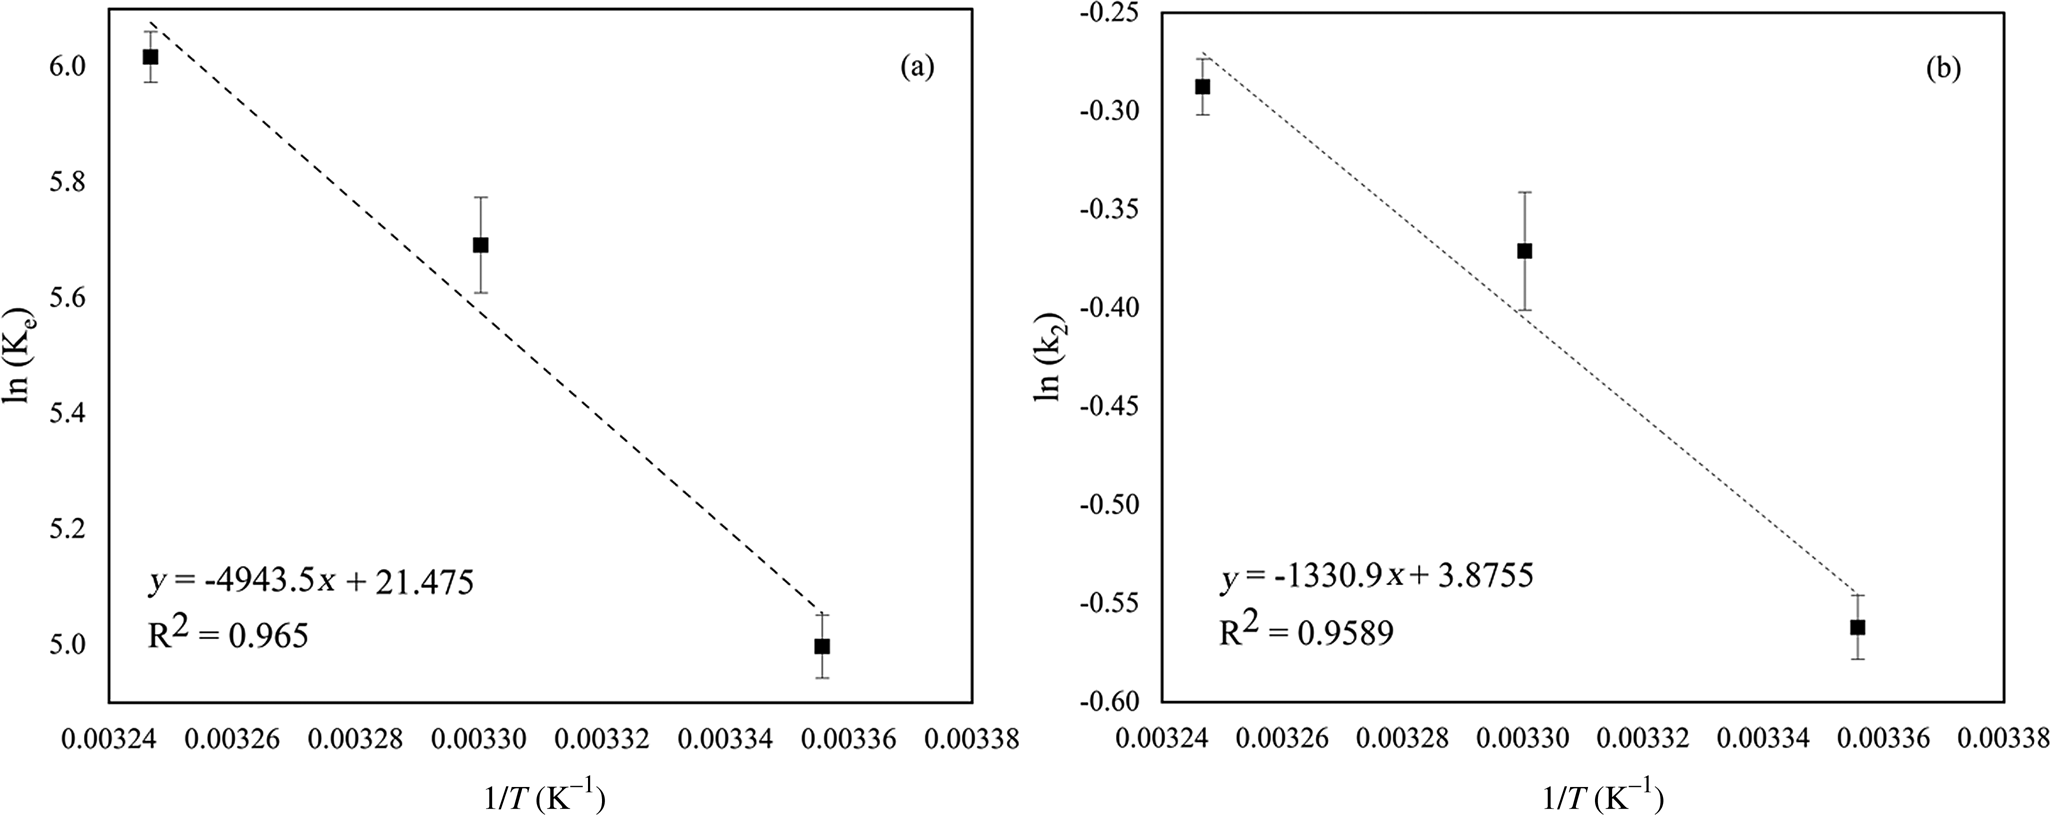
The ΔH° and ΔS° of adsorption were calculated from the graph of ln(Ke) versus 1/T (K–1) (Fig. 7a) and the activation energy (E a) was calculated by the graph of ln(k2) × 1/T (K–1) (Fig. 7b), where k2 is the kinetic speed constant of the pseudo-second order fitting at 298, 303 and 308 K.
(a) Linear regression of ln Ke versus 1/T and (b) Linear regression of ln k2 versus 1/T for the adsorption of ivermectin onto organophilic clay.

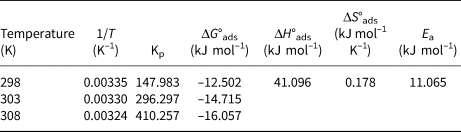
The linear coefficient (ΔS°ads/R) and angular coefficient (–ΔH°ads/R) in Equation 14 were used to determine ΔS°ads and ΔH°ads. The ΔG°ads value for each temperature was determined from Equation 15 and the activation energy was determined from the slope (E a/R) (Equation 16). The thermodynamic parameters are listed in Table 6.
Thermodynamic parameters of ivermectin adsorption onto organophilic clay.

The negative values of ΔG°ads obtained for the three temperatures indicate that adsorption of ivermectin on the organophilic clay occurs spontaneously. In addition, the ΔG°ads values decrease with increasing temperature, suggesting that adsorption is favored at high temperatures (Sohrabi et al., Reference Sohrabi, Mohammadi, Ghassemzadeh and Heris2021). The positive value for enthalpy suggests that the process is endothermic occurring by means of a chemisorption mechanism. Nevertheless, the ΔH°ads obtained (41.096 kJ mol–1) is indicative of an intermediate physical-chemical adsorption process (Hussain et al., Reference Hussain, Kamran, Khan, Shaheen, Shah, Suo, Khan, Shah, Rehman, Al-Ghamdi and Ghani2021). In addition, the positive value determined for ΔS°ads (0.178 kJ mol–1K–1) suggests an increase in the degree of freedom at the solid–liquid interface during the adsorption of ivermectin in organophilic clay (Cotoruelo et al., Reference Cotoruelo, Marqués, Leiva, Rodríguez-Mirasol and Cordero2011; Rathod et al., Reference Rathod, Haldar and Basha2015). Finally, the activation energy (11,065 kJ mol–1) is within the range of 8.4–83.7 kJ mol–1, which characterizes a chemical adsorption process, although some contribution from physical adsorption must also be considered (Aksu & Kabasakal, Reference Aksu and Kabasakal2004).
Effect of pH
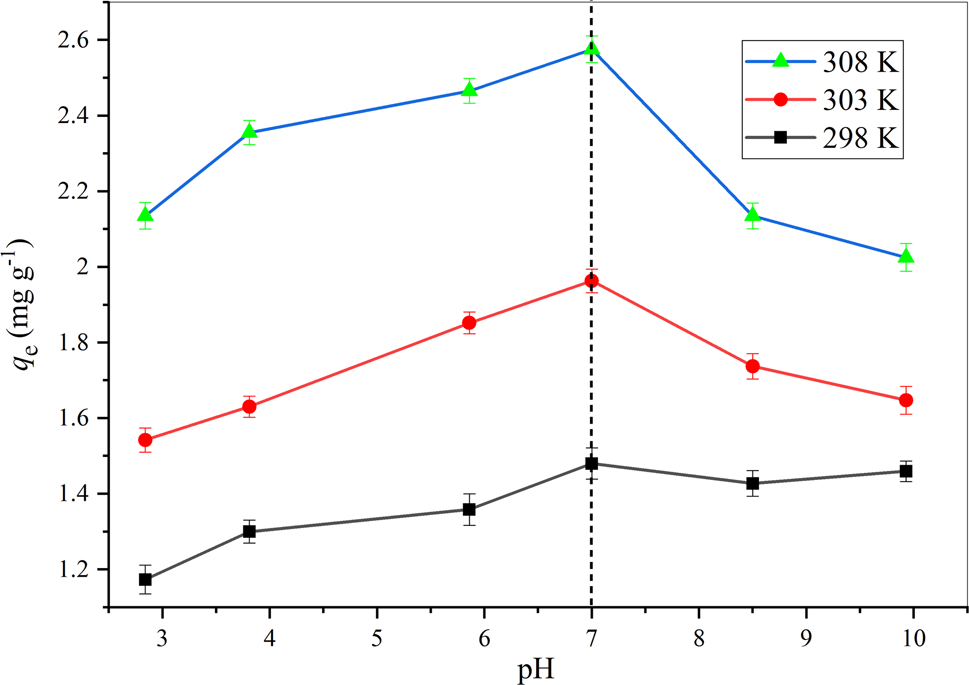
The amount of ivermectin adsorbed per gram of organophilic clay in the pH range 2 to 10 for the temperatures studied is shown in Fig. 8. Removal of ivermectin increases gradually from pH 2 to 7.5, reaching its greatest efficiency at pH 7.5, the pHpcz of commercial organophilic clay. So far, little work has been done on the influence of pH on ivermectin adsorption from solution. Adsorption of ivermectin in the neutral pH region is attributed to the electrostatic repulsion forces involved in the adsorption process, as is discussed below. However, the pH does not significantly affect adsorption of ivermectin on the organophilic clay given the little variation in the adsorbed amounts of ivermectin with pH.
Amount (mg g–1) of ivermectin adsorbed on organophilic clay for various pH values at temperatures of 298, 303 and 308 K.

Clay recycling
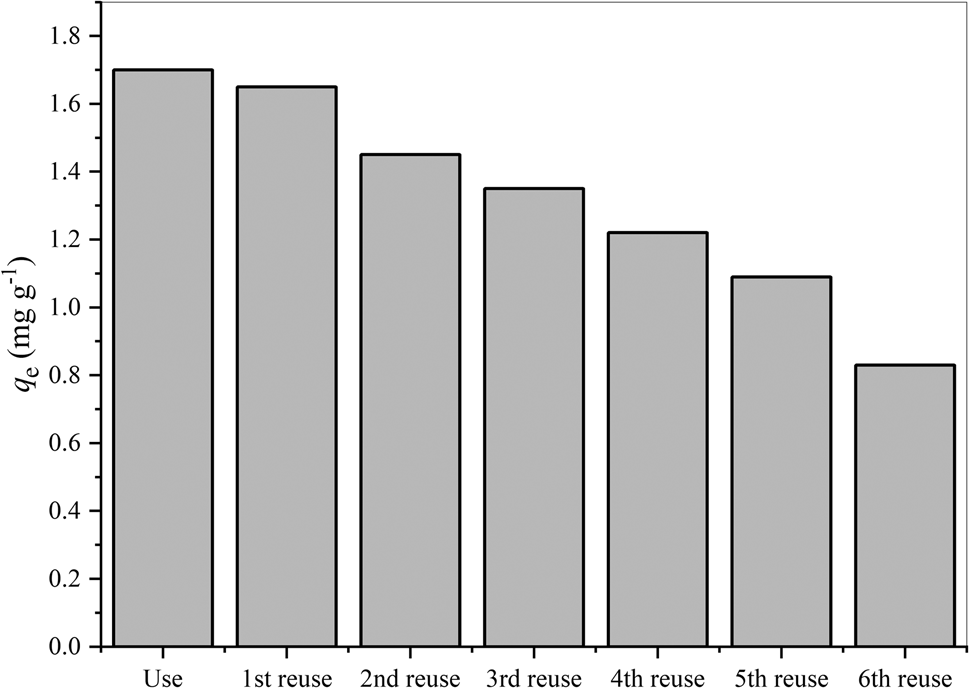
Recycling of organophilic clay was performed six times and the results are shown in Fig. 9; the first use refers to ivermectin removal by the adsorbent and the reuse tests refer to recycling after desorption. The adsorption efficiency decreases gradually with repeated recycling. This may be due to reduction of adsorption sites, the blocking of openings and loss of adsorbent mass after each cycle (Ashrafi et al., Reference Ashrafi, Safari, Sharafi, Kamani and Jaafari2021; Liu et al., Reference Liu, Xu, Liu, Liu, Chen, Li and Meng2016). This is in accordance with an intermediate physicochemical adsorption process. The adsorption capacity of the organophilic clay decreased by 50% after six reuse cycles. Overall, organophilic clay exhibits good recyclability and can be used repeatedly for practical applications.
Adsorption of ivermectin after recycling.

Proposed adsorption mechanism
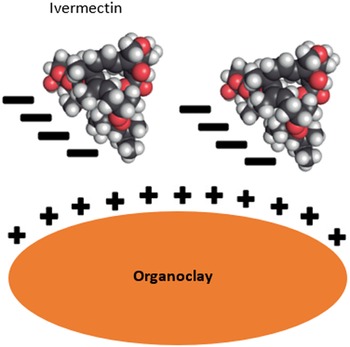
The mechanism of adsorption of ivermectin on organophilic clay is a combination of the hydrophobic character of the material and layer charge. The hydrophobic character results from incorporation of surfactants on organophilic clay and favors interactions with organic pollutants such as ivermectin (França et al., Reference França, Trigueiro, Filho, Fonseca, Jaber, França, Trigueiro, Filho, Fonseca and Monitoring2020). Regarding the layer charge, the clay interacts with contaminant molecules through electrostatic forces of attraction or repulsion depending on the charge sign (de Andrade et al., Reference de Andrade, Oliveira, Canevesi, Landers, da Silva and Vieira2020). Ivermectin is a strong acid with pKa = 12.47 and adsorption tests were performed at pH ≈ 7 without pH adjustment (Olu-Owolabi et al., Reference Olu-Owolabi, Diagboya, Mtunzi and Düring2021). Under these conditions, the ivermectin molecule in solution will be negatively charged, while the surface of the organophilic clay will be positively charged (pH < pHPCZ) (de Andrade et al., Reference de Andrade, Oliveira, Canevesi, Landers, da Silva and Vieira2020), resulting in electrostatic attraction between the adsorbent and adsorbate. A general scheme of the interaction mechanism of ivermectin on organophilic clay, based on the results of the present study and previous work, is presented in Fig. 10.
Mechanism of drug–adsorbent interaction.

Summary and conclusions
The adsorption of ivermectin on organophilic bentonite clay was studied. The organophilic clay contains mainly macro-pores and minor mesopores and consists of major smectite and minor quartz which are characteristic of bentonite clay used as raw material for the organophilic clay. The amount of ivermectin adsorbed on the organophilic clay was 1.78–3.88 mg g–1. The Elovich kinetic model offered the best fit for the experimental data, indicating a chemisorption process. The proposed adsorption mechanism results from the hydrophobic character and the charge of clay. Addition of surfactant to the clay matrix was crucial for organophilization, induced a hydrophobic character and enhanced removal of ivermectin from solution. The adsorption occurred through electrostatic attraction triggered by layer charge of smectite. The Langmuir and Sips isotherm models best fitted the experimental equilibrium data. Adsorption of ivermectin is favorable (ΔG°ads<0), endothermic (ΔH°ads>0), with an increased degree of freedom at the solid–liquid interface (ΔS°ads>0) and has physicochemical characteristics (E a = 11.065kJ mol–1). Moreover, adsorption is favored at the natural pH of the solution. The adsorbent can be regenerated through a simple technique, using only water as an effluent. Overall, the organophilic clay is an environmentally suitable adsorbent with potential to remove this emerging contaminant.
Acknowledgements
The authors thank the Brazilian Agency for Support and Evaluation of Graduate Education (CAPES) (Process Number 88887.185200/2018-00) and the Araucaria Foundation (FA-PR) for the RENEWABLE HYDROCARBONET (NAPI-HCR) project for granting a scholarship.
Competing interests
The authors declare that they have no known competing financial interests or personal relationships that could have appeared to influence the work reported in this paper.
Supplementary material
To view supplementary material for this article, please visit https://doi.org/10.1180/clm.2022.16.