I. INTRODUCTION
Nanostructures have received considerable interest in the past decade not only for their fundamental scientific importance but also for many technological applications that are derived from their peculiar and fascinating properties.Reference Yang, Wang, Wang, Wang, Guo and Han1 Perovskite compounds have received keen interest from academic research due to their unique properties such as ferroelectric, pyroelectric, piezoelectric, and dielectric properties.Reference Hench and West2–Reference Ahmad and Ganguli5 The alkaline earth metal zirconates of general chemical formula MZrO3 (M = Ca, Pb, Sr, and Ba) have been found extremely important in the field of electrical ceramics, refractories and heterogeneous catalysis. Barium zirconate (BaZrO3) in doped (Na, K, Ca, Sr, Y, Sc, etc.) form is considered a very promising proton-conducting and high-temperature stable material,Reference Shirpour, Rahmati, Sigle, van Aken, Merkle and Maier6–Reference Souza and Muccillo9 due to which it has wide applications such as in electrochemical devices, sensors, hydrogen separation, electrolysis cell and fuel cells.Reference Haile, Staneff and Ryu10 This perovskite structure not only works as a good substrate for growing high-temperature perovskite superconductorsReference Erb, Walker, Genoud and Flukiger11 but is also a good dielectric material. The high dielectric permittivity and small dielectric loss value make these perovskites of great significance in various fields, such as wireless communication devices, multilayer ceramic capacitors, dynamic random access memories (DRAMs) etc. Strontium zirconate (SrZrO3) is also used extensively as a commercial ceramic dielectric material with high mechanical and chemical stability. At room temperature SrZrO3 exhibits orthorhombic symmetryReference Howard, Knight, Kennedy and Kisi12 with space group Pbnm and is isostructural with calcium titanate (CaTiO3).Reference Ahtee, Ahtee, Glazer and Hewat13 However, doped SrZrO3 is a proton conductor for solid oxide fuel cells.Reference Garbhage, Marques and Frade14 Several methods have been explored for the synthesis of nanomaterials. These processes involve both physical and chemical methods such as arc discharge, chemical vapor deposition, laser ablation, microemulsion and hydrothermal method.Reference Journet, Maser, Bernier, Loiseau, Chapelle, Lefrant, Deniard, Lee and Fischer15–Reference Ganguly, Ahmad and Ganguli19 There are only few reportsReference Boopathy and Rajendran20 on the synthesis of pure barium strontium zirconate ceramics, however, no report has been found on the polymeric citrate precursor method. As compared with other chemical methods, the polymeric precursor route (also known as nonalkoxide sol-gel method or Pechini methodReference Pechini21) which offers significant control on the stoichiometry, low synthesis temperature and easy substitution of dopants.Reference Bernardi, Antonelli, Lourenco, Feitosa, Maia and Hernandes22 The basic idea of the approach is to use in situ polymerization of monomers in addition to the required metal cations. The backbone of this method is the esterification reaction between ethylene glycol and multifunctional carboxylic acid.Reference Pechini21 Recently we have reported the polymeric citrate precursor route for the solid solution of barium lead zirconate nanoparticlesReference Al-Hartomy, Ubaidullah, Khatoon, Madani and Ahmad23 for the first time.
In this article, we report the synthesis of nanocrystalline Ba1-xSrxZrO3 (0 ≤ x ≤ 1) using the polymeric citrate precursor method for the first time. The nanocrystalline powder was characterized by powder x-ray diffraction (XRD), transmission electron microscope (TEM), scanning electron microscope (SEM) and Brunauer, Emmett and Teller (BET) surface area analyzer. The density and dielectric properties have been measured and discussed in detail.
II. EXPERIMENTAL DETAILS
A. Materials required
Barium acetate (Qualigens, Mumbai, India; 99.5%), strontium acetate (Aldrich, St. Louis, MO), zirconium oxychloride (CDH, New Delhi, India; 99%), ethylene glycol (SD fine-chem Ltd., Mumbai, India; 99%) and citric acid (Spectrochem, Mumbai, India; 99%). All the above chemicals were used without any further purification and 0.1 M aqueous solution of metal salts were prepared in double distilled water.
B. Synthesis
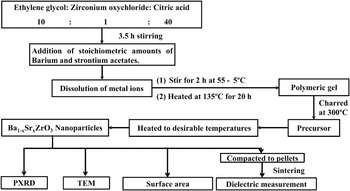
1.4 mL of ethylene glycol was taken in a beaker. To this 25 mL of 0.1 M ZrOCl2 solution was added under constant stirring. The mixture was stirred for about 10–15 min to obtain a clear transparent solution. Then 21.0135 g of dried citric acid was slowly added into this solution, so that molar ratio of ethylene glycol:citric acid:zirconium oxychloride were fixed at 10:40:1. A whitish precipitate could be seen immediately after adding citric acid in to the solution. The contents were stirred at room temperature for about 3.5 h to obtain a clear solution of the precursor. 0.1 M Ba2+ and Sr2+ aqueous solutions were added in the stoichiometric amounts to the reaction precursor. The mixture became turbid on complete addition of the metal acetates. The mixture was stirred for 4 h to obtain the homogeneous reaction mixture of metal ions. At this stage, the reaction mixture was further stirred at a temperature of 55 ± 5 °C for 2 h. The solution became viscous which was then placed in oven at 135 ± 5 °C for 20 h to evaporate the solvent and to promote the polymerization process. A black viscous resin was formed which was charred in a muffle furnace for 2 h at 300 °C. The resin turned into a black mass and was ground to a fine powder. This ground black mass is referred to as the precursor. The precursor was further heated at 500 °C for 20 h in the muffle furnace. The powder became gray in color. These samples were annealed at 900 °C for 12 h followed by 1000 °C for 20 h in a microprocessor-controlled high-temperature furnace. Finally creamy white powders of Ba1-xSrxZrO3 (BSZ) were obtained. The flow chart depicting the various steps involved in the synthesis procedure is shown in Fig. 1.
Flow chart for the synthesis of nanocrystalline Ba1-xSrxZrO3 via polymeric citrate precursor route.

C. Instrumentation
Powder x-ray diffraction studies have been carried out on diffractometer (XRD; Bruker model No. D8 Advance X-ray Diffractometer, Germany, using Ni-filtered Cu Kα radiations of wave length (λ) = 1.54056 Å. The x-ray diffraction data was recorded in the 2θ range of 20–70° with the step size of 0.05° and step time of 1 s. The Kα2 reflections were removed by a stripping procedure to obtain accurate lattice constants.
Transmission electron microscopic studies were carried out using the (TEM. FEI Technai model No. G2 20, Hillsboro, OR) transmission electron microscope with an accelerating voltage of 200 kV. TEM specimens were prepared by taking a small amount of the finely ground powder, which was then dispersed in absolute ethanol with the help of an ultrasonic bath and sonicated for about 45 min. A drop from the micropipette (about 100 μL volume) of the dispersed sample was placed on a copper grid coated with carbon film.
Scanning electron microscopic (SEM) studies were also performed for the morphological analysis of the samples. The measurements have been carried out on a scanning electron microscope (SEM; FEI model No. Nova Nano SEM 450, Hillsboro, OR). SEM measurements have been carried on the pellets sintered at 1000 °C to obtain the images at various magnifications.
The surface area of the samples was recorded at liquid nitrogen temperature (77 K) using Brunauer, Emmett and Teller (BET) surface area analyzer (BET; model: Nova 2000e, Quantachrome Instruments Limited, Boynton Beach, FL), using “Multipoint BET Method.” Approximately 0.26 g of the powder sample was placed in the sample cell and allowed to degas at one of the degassing stations for 3 h at 250 °C in a vacuum degassing mode. This removes the contaminants such as water vapor and adsorbed gases from the sample. The degassed sample was then subjected to analysis and the data were recorded by admitting known quantity of adsorbing nitrogen gas into the sample cell containing the solid adsorbent. As the adsorption occurs, the pressure in the sample cell changes until equilibrium is reached. From the BET plot, the specific surface area is calculated using the multipoint BET equation.
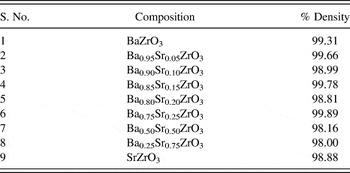
Dielectric properties of the samples were measured on the high frequency LCR meter (model: 6505P; Make: Wayne Kerr, UK). The sample was mixed with 2–3 drops of 5% poly[vinyl alcohol (PVA)] and dried in an oven at 90 °C for 1 h. The powder was then compacted to pellets at a pressure of 3 tons. The pellets were then sintered at 1000 °C for 8 h followed by coating with silver paste on both the surfaces and dried in oven at 100 °C for 1 h. Before performing the dielectric measurements, the thickness and diameters of all the pellets were noted, to calculate the value of dielectric constant from the measured value of capacitance. Density of the solid solutions was measured using gas pycnometer by purging the helium gas. The percentage density of the solid solution was calculated by theoretical and experimental density, which comes out to be in the range of 98–99.89% of the theoretical density.
III. RESULTS AND DISCUSSION
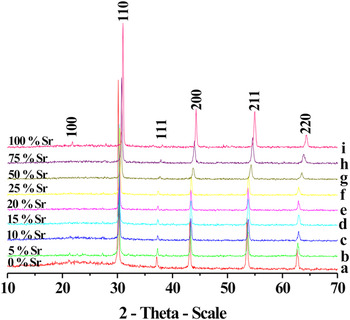
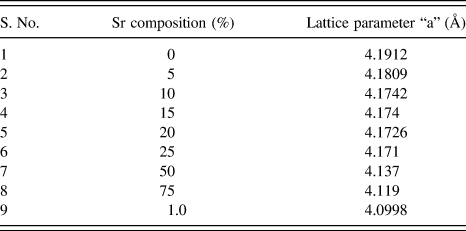
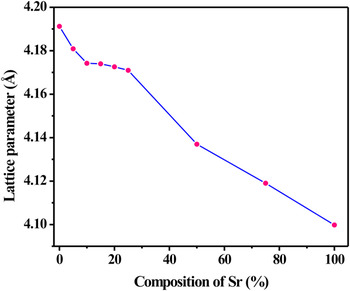
Powder x-ray diffraction (XRD) patterns of Ba1-xSrxZrO3 (0 ≤ x ≤ 1) were obtained by heating the precursors at 1000 °C in air for 20 h as shown in Fig. 2. As can be seen from the patterns, all the samples are monophasic with highly crystalline cubic BaZrO3 structure [Joint Committee for Power Diffraction Standards (JCPDS) No. 74–1299]. No other phases were detected by XRD, indicating the incorporation of Sr2+ at Ba2+ lattice site instead of forming a new phase. A monotonic shift of all the diffraction peaks to higher angles is observed, which is attributed to the formation of solid solution of Ba1-xSrxZrO3 (BSZ). The unit cell parameter “a” was refined from x-ray diffraction data using CELL software, and found to be smaller than undoped BaZrO3 (4.191 Å). BaZrO3 lattice marginally contracts which may be due to the incorporation of Sr2+ in BaZrO3 lattice site. This is expected due to the smaller ionic radius of Sr2+ (1.18 Å) compared with Ba2+ (1.35 Å).Reference Shannon24 It is also observed that as the strontium concentration increases, broadening of the diffraction peaks also increases which implies that the particle size becomes finer on increasing the dopant concentration. Fig. 2(i) shows the XRD pattern of SrZrO3, which correctly matches with orthorhombic phase (JCPDS No. 76–0167). The variation of lattice parameter of Ba1-xSrxZrO3 with composition “x” is listed in Table I and shown in Fig. 3.
XRD patterns of Ba1-xSrxZrO3 for x = (a) 0, (b) 0.05, (c) 0.10, (d) 0.15, (e) 0.20, (f) 0.25, (g) 0.50, (h) 0.75, and (i) 1.0 nanoceramics.

Variation in lattice parameter “a” of Ba1-xSrxZrO3 with composition “x.”
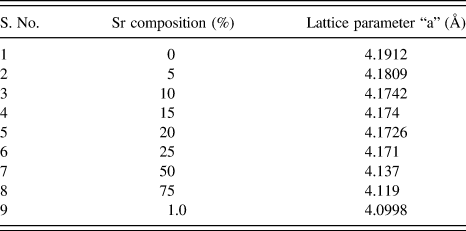
Plot for the variation of lattice parameter of Ba1-xSrxZrO3 with composition “x.”

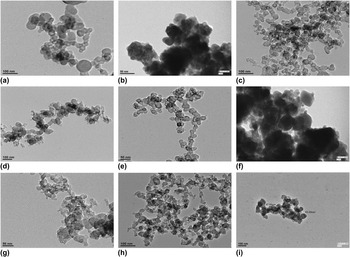
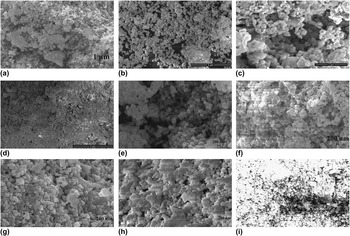
TEM study is used to estimate the particle size and size distribution of BSZ nanoparticles as shown in Fig. 4. It can be clearly seen from the TEM images, the particles are nearly spherical in shape with agglomeration. The average grain size of BaZrO3 was found to be 44 nm [Fig. 4(a)]. It has been observed that particle size significantly decreases on increasing the Sr concentration and showed the smallest size of ∼17 nm for Ba0.75Sr0.25ZrO3 [Fig. 4(f)]. The morphology and texture of solid solutions have also been investigated using SEM. The SEM images of BSZ (0 ≤ x ≤ 1) are shown in Figs. 5(a)–5(i). The micrographs clearly show that the entire range of the solid solutions consist of nearly spherical morphologies. For pure BaZrO3, the particle seems to be agglomerated with nearly spherical shapes as shown in Fig. 5(a). Moreover on incorporating Sr2+ ions in BaZrO3, spherical particles had become more visible along with some agglomeration as shown in Figs. 5(b)–5(h). Note that the agglomeration increases on increasing the Sr2+ ions, however least agglomeration could be seen in pure BaZrO3 and SrZrO3 compositions.
TEM images of Ba1-xSrxZrO3 for x = (a) 0, (b) 0.05, (c) 0.10, (d) 0.15, (e) 0.20, (f) 0.25, (g) 0.50, (h) 0.75, and (i) 1.0.

SEM micrographs of Ba1-xSrxZrO3 for x = (a) 0, (b) 0.05, (c) 0.10, (d) 0.15, (e) 0.20, (f) 0.25, (g) 0.50, (h) 0.75, and (i) 1.0.

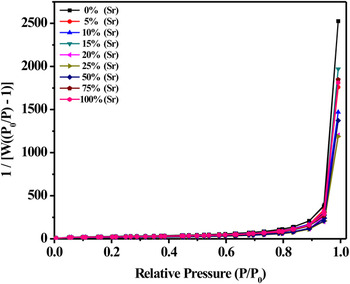
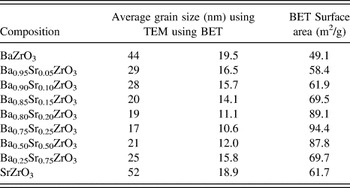
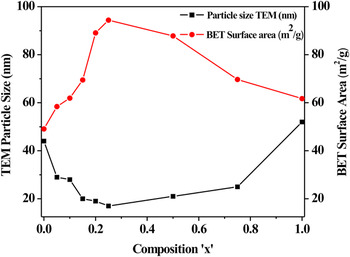
Specific surface area of entire solid solution has been estimated using multipoint BET equation in the P/P0 range of 0.05–0.35 (Fig. 6). The surface area of the solid solutions have been determined from the BET plots and found to be in the range of 49–94 m2/g. The surface areas of BaZrO3 and SrZrO3 were 49 and 62 m2/g respectively, which were found to be comparatively much higher than earlier report.Reference Boopathy and Rajendran20 It has been observed that surface area increases on increasing the Sr2+ concentration in Ba2+ matrix till 94 m2/g for x = 0.25 and thereafter decreases linearly till x = 1.0. The average particle size of the nanoparticles was also calculated using the equation: DBET = 6000/(ρ·Sw), where the symbols DBET, ρ, and Sw stand for average diameter of the spherical particle in nm, theoretical density in gm/cm3 and specific surface area in m2/g of the samples respectively.Reference Li, Ikegami, Wang and Mori25, Reference Wani, Khatoon, Ganguly, Ahmed, Ganguli and Ahmad26 The particle size calculated using the above expression and comes out to be 19.5, 16.5, 15.7, 14.1, 11.1, 10.6, 12.0, 15.8, and 18.9 nm respectively. The variation of average grain size with composition using TEM and BET surface area studies is shown in Table II. The variation of grain size and surface area with composition is shown in Fig. 7 which is in good agreement with the result obtained using surface area and electron microscopic analysis.
BET plot overly of Ba1-xSrxZrO3 for x = (a) 0, (b) 0.05, (c) 0.10, (d) 0.15, (e) 0.20, (f) 0.25, (g) 0.50, (h) 0.75, and (i) 1.0.

Particle size of Ba1-xSrxZrO3 obtained from TEM and BET and BET surface area.

Variation plot of surface area and TEM particle size as a function of composition for Ba1-xSrxZrO3 (x = 0.0, 0.05, 0.10, 0.15, 0.20, 0.25, 0.50, 0.75, and 1.0).

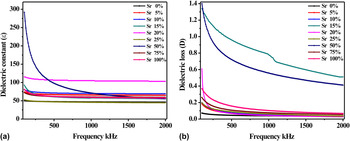
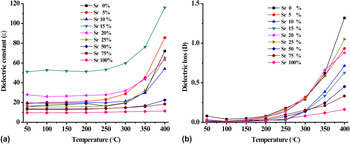
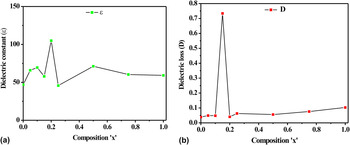
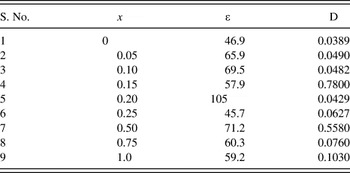
Dielectric properties of all the compositional nanoceramics were studied after sintering the pellets at 1000 °C for 12 h. The dielectric parameters were measured as the function of frequency in the range of 100 kHz–2 MHz at room temperature as shown in Figs. 8(a) and 8(b). The room temperature data shows the maximum dielectric constant (ε) of 105 for Ba0.80Sr0.20ZrO3 with low dielectric loss of 0.0429, which shows the good quality of dielectrics at x = 0.20 composition. The high dielectric constant may be associated with the higher polarization and the charge carriers that could move within the grain and piled up at the grain boundaries.Reference Azam, Ahmad, Chaman and Naqvi27 The values of dielectric constant and dielectric loss were found to be stable with frequency for nearly all the composition. The dielectric constant and dielectric loss for pure BaZrO3 was found to be 46.9 and 0.0389 respectively at 1 MHz as shown in Figs. 8(a) and 8(b), however for pure SrZrO3 these parameters were found to be 59.2 and 0.1030 respectively. The dielectric constant and loss factor at room temperature for all the compositions (0 ≤ x ≤ 1) have been summarized in Table III. The temperature dependence of dielectric constant and loss factor were also studied at 1 MHz as shown in Figs. 9(a) and 9(b). The dielectric constant for pure BaZrO3 was found to be stable till 300 °C, thereafter it increases with temperature. The temperature variation plots for Ba1-xSrxZrO3 for x = 0.05, 0.10, 0.15, 0.20, and 0.25 at 1 MHz show the stable dielectric constant upto 300 °C, and thereafter increase upto 400 °C as shown in Fig. 9(a). The dielectric losses were also found to be stable till 300 °C with very low loss factor. The dielectric constant for the compositions at x = 0.50, 0.75 and x = 1.0 were found to be highly stable till 400 °C as shown in Fig. 9(a), however the dielectric loss showed slight increase beyond 300 °C. The studies suggest that all these materials behave as good dielectrics till 300 °C. In all the cases from x = 0.05 to x = 0.75, the dielectric loss was found to be low in the range of 0.00463–1.05 with temperature variation. The room temperature dielectric constant and dielectric loss of BSZ with composition “x” at 1 MHz are shown in Figs. 10(a) and 10(b). It can be clearly seen from the Fig. 10(a) that the dielectric constant reaches to a maximum value of ε = 105 at x = 0.20. The maxima of dielectric loss was observed for the composition x = 0.15 [Fig. 10(b)]. The maxima in the dielectric constant and dielectric loss as observed in our studies might be due to the paraelectric behavior in Ba-rich compositions.Reference Al-Hartomy, Ubaidullah, Khatoon, Madani and Ahmad23, Reference Pokhral and Pandey28
Variation plots of (a) dielectric constant and (b) dielectric loss versus frequency of Ba1-xSrxZrO3 for x = 0, 5, 10, 15, 20, 25, 50, 75, and 100% at room temperature.

Variation plots of (a) dielectric constant and (b) dielectric loss with temperature of Ba1-xSrxZrO3 for x = 0, 5, 10, 15, 20, 25, 50, 75, and 100% at 1 MHz.

Room temperature plots of (a) dielectric constant and (b) dielectric loss with composition at of 1 MHz.

Room temperature dielectric parameters of Ba1-xSrxZrO3 with composition at 1 MHz.

Percentage density of Ba1-xSrxZrO3 (0 ≤ x ≤ 1).

The experimental densities of the solid solutions of Ba1-xSrxZrO3 (0 ≤ x ≤ 1) were calculated using gas pycnometer (Table IV), which were found to be in the range of 98–99.89% of the theoretical density. The density measurements suggest that the nanoceramics are highly dense and results the high surface area of dielectrics.
IV. CONCLUSIONS
Monophasic and highly crystalline nanosized oxides of Ba1-xSrxZrO3 (0 ≤ x ≤ 1) have been successfully synthesized by polymeric citrate precursor method for the first time. The oxides were agglomerated with nearly spherical in shapes as evidenced from TEM and SEM studies. Particle size decreases from 44 to 17 nm and simultaneously surface area increases from 49.1 to 94.4 m2/g on increasing the Sr concentration from 0 to 25%. This is the first report on highest surface area of BSZ with Sr content of 25%. Temperature dependent dielectric constant and dielectric loss of BSZ (at x= 0.05, 0.10, 0.15, 0.20) at 1 MHz were found to be stable upto 300 °C. The room temperature dielectric constant was found to be maximum (105) for x = 0.20 at 1 MHz. High dielectric constant and low dielectric loss suggest that Sr-doped Barium zirconate prepared by the polymeric citrate precursor method may have potential applications as nanoceramics for electronic devices.
ACKNOWLEDGMENTS
The authors are grateful for the financial support from Tabuk University; Tabuk, Goverment of Saudi Arabia. This research program is an international collaboration between the Tabuk University, Saudi Arabia and Jamia Millia Islamia (Central University), New Delhi 110025 India. The authors also thank to AIIMS, New Delhi for electron microscopic studies. Mohd Ubaidullah thanks to Tabuk University for the research fellowship.