


INTRODUCTION
Efficient utilization of applied irrigation water and fertilizer nitrogen (N) is of immense importance for sustenance of the rice–wheat system, particularly from the viewpoint of food security and livelihood in South Asia. In the Indo-Gangetic Basin of India, the area under the rice–wheat system is 10.3 million ha, and out of that 2.6 million ha is in Indian Punjab. In this semi-arid tropical region, rice is mostly grown on coarse- to fine- textured puddled soils during the kharif season (summer) by transplanting 30-day-old seedlings and wheat during the rabi season (winter). The date of transplanting of rice ranges from the first week of June to the first week of July because of scarcity of farm labour. The date of sowing of wheat varies from the third week of October to the third week of November depending upon the harvest of the preceding rice crop. The varieties of rice commonly transplanted are PAU 201, PR 111 and hybrid RH 257 (duration: 144, 138 and 120 days, respectively) and that of wheat are PBW 343 (duration: 155 days) and PBW 550 (duration: 145 days). Rice plots were irrigated two days after disappearance of applied water from the soil surface, and wheat was irrigated at growth stages (crown root initiation, tillering, jointing, flowering and grain formation). Nitrogen fertilizer is applied at a rate of 120 kg N ha−1 to both rice and wheat. However, it is known that excessive irrigation water and fertilizer N are being applied by farmers in the quest for higher yields ignoring economic water and N productivities, and environmental pollution.
At present, the yield of the rice and wheat cropping system has almost stagnated and extraction of ground water is unsustainable because of increasing costs following rapid rises in prices of electric power and diesel. Moreover, the development of surface water resources is economically limited. The cost of fertilizer N has also increased by 15% during the past decade. Therefore, it is of prime importance to enhance crop water productivity, CWP (CWP = marketable yield/evapotranspiration (ET)) as well as irrigation water productivity, IWP (IWP = marketable yield/irrigation water applied) and N use efficiency constituting agronomic and recovery efficiencies (Nova and Loomis, Reference Nova and Loomis1981). While evaluating the CWP and N use efficiency, it is important that one should know the magnitudes of water and N balance components in different scenarios of management interventions. But these cannot be easily measured under field conditions and vary widely with soil type, location, season and management (Arora and Gajri, Reference Arora and Gajri1998; Cabangon et al., Reference Cabangon, Tuong, Castillo, Bao, Lu, Wang, Cui, Bouman, Li, Chen and Wang2004; Chhabra et al., Reference Chhabra, Manjunath and Panigrahy2010; Jalota and Arora, Reference Jalota and Arora2002; Pathak et al., Reference Pathak, Li, Wassmann and Ladha2006; Yang et al., Reference Yang, Bouman, Wang, Wang, Zaho and Chen2005). Under such situations, combination of field experimentation and modelling is a powerful approach that can give conclusive and meaningful results.
Sufficient literature on improvement of CWP by reducing (1) unproductive water loss by soil water evaporation (E) and (2) ET by growing short-duration varieties requiring less water (Tuong, Reference Tuong and Kikham1999; Jalota et al., Reference Jalota, Singh, Chahal, Gupta, Chakraborty, Sood, Ray and Panigraphy2009) is available. Similarly, research work on improvement of IWP through reduction in irrigation water by applying (1) intermittent irrigation, a few days after water has disappeared from the surface (Sandhu et al., Reference Sandhu, Khera, Prihar and Singh1980; Singh et al., Reference Singh, Aujla, Sandhu and Khera1996; Tabbal et al., Reference Tabbal, Bouman, Bhuyian, Sibayan and Satter2002) and (2) irrigation based on soil water suction (SWS) in the root zone (Tuong, Reference Tuong and Kikham1999; Kukal et al., Reference Kukal, Hira and Sidhu2005) in rice; and demand-based or deficit irrigation scheduling for wheat (Prihar et al., Reference Prihar, Gajri and Narang1974; Jalota et al., Reference Jalota, Prihar, Sandhu and Khera1980) is documented in the literature. But this literature is crop (rice or wheat) and management intervention (transplanting/sowing date, irrigation, variety, N fertilizer etc.) specific. Information regarding integrated effects of management interventions on yield, water productivity and nitrogen use efficiency on the rice-wheat system per se including an intervening fallow period is lacking. Therefore, the present study aimed at: (1) investigating the effects of date of transplanting/sowing, variety, irrigation regime, fertilizer N and their interactions on yield of rice and wheat crops individually under field conditions; (2) simulation of equivalent rice yield, water and N balances, crop water and irrigation water productivity and N use efficiency in the system under different management interventions and (3) selection of the most profitable and water- and N-use efficient BMP in rice–wheat system.
MATERIALS AND METHODS
Field study
Field experiments were conducted at the Research Farm, Punjab Agricultural University, Ludhiana (30°56′N, 75°52′E and 247 m amsl) in India during two seasons of 2008–09 and 2009–2010. Before the start of experiment, soil physical (texture, bulk density and hydraulic conductivity) and chemical (electrical conductivity (EC), pH, organic carbon, ammonium and nitrate N) properties of the field were determined up to a depth of 1.8 m, at an interval of 0.15 m, following standard procedures. The sand, silt and clay contents were determined by the pipette method, and bulk density with core and hydraulic conductivity with constant head methods (Jalota et al., Reference Jalota, Khera and Ghuman1998). Soil organic carbon was measured by wet digestion methods (Walkley and Black, Reference Walkley and Black1934), EC with a solu-bridge (Chopra and Kanwar, Reference Chopra and Kanwar1976) and pH (water soil ratio of 2:1) with a potentiometer (Jackson, Reference Jackson1973). Ammonium and nitrate N were determined by the Kjeldahl distillation method (Keeney, Reference Keeney and Page1982). The soil physical and chemical properties of the two experimental soils are given in Table 1. Daily weather data on maximum and minimum temperature, maximum and minimum relative humidity, wind speed, sunshine hours and rainfall were recorded at the meteorological station of Punjab Agricultural University, Ludhiana situated at 50 m from the experimental site.
Physical and chemical properties of the experimental soils.

BD: bulk density; FC: field capacity; PWP: permanent wilting point.
† kg N kg B−1: kg N kg biomass−1.
Experiment 1
There were 12 treatments, which were replicated three times in 36 plots of size 10 m × 4 m in a split-plot design. The treatments were: three dates of transplanting – 5 June (D1r), 20 June (D2r) and 5 July (D3r); two varieties – inbred PAU 201 (V1r) and hybrid RH 257 (V2r) and two irrigation regimes – intermittent irrigation at two-day drainage periods (I1r) and irrigation based on SWS of 16 kPa (I2r). In 2008, 30-day-old nursery seedlings of the varieties were transplanted on the three transplanting dates at 20 cm row and 15 cm plant spacing on puddled soil. Soil was puddled twice by running a cultivator in the standing water followed by planking. On each date, 40 kg N, 30 kg P2O5 and 30 kg K2O per ha were broadcast at the time of transplanting. Second and third doses of N (40 kg ha−1 each) was applied at 21 and 42 days after transplanting respectively for each date. Irrigation treatments were started following continuous flooding for 15 days after transplanting. The amount of irrigation water applied at each irrigation from transplanting to maturity was 80 mm, and was monitored with a Parshal flume. Each plot was embanked with an earthen bund of 15 cm height to avoid runoff loss or gain. Soil water suction was measured with tensiometers installed at 20 cm soil depth. In each irrigation treatment, lateral movement of water was minimized by keeping a buffer strip of 0.60 m. To control weeds (Echinochloa crusgalli), butachlor 50EC 3000 ml ha−1 was applied two days after transplanting. Monocrotophos (1400 ml ha−1), Chloropyriphos (2.5 l ha−1), Padan (18 kg ha−1) and Tilt 25 EC (500 ml ha−1) were used periodically to control insect pests and diseases. At maturity, the crop was harvested from the whole plot excluding border lines. The rice biomass, yield and N uptake were measured and used for evaluation of the model.
Wheat was sown allocating the treatments of sowing time, cultivar and irrigation in the same plots as in the preceding rice crop. The treatments were: three dates of sowing – 22 October (D1w), 5 November (D2w) and 20 November (D3w); two varieties – inbred PBW 343 (V1w) and PBW 550 (V2w); and two irrigation schedules – stage based (crown root initiation, tillering, jointing, flowering and grain formation (I1w)) and irrigation based on IW/PAN-E ratio of 0.9 (I2w). A total of 12 treatments were replicated three times in 36 plots of size 10 m × 4 m in a split plot design. At sowing 60 kg N, 30 kg P2O5 and 30 kg K2O per ha were applied. A second dose of N (60 kg ha−1) was applied after first irrigation.
Experiment 2
For rice, the treatments comprised four irrigation regimes: flooded (I1R), two-days (I2R), four-days (I3R) and six-days drainage (I4R) and four N levels – N0, N60, N120 and N180 kg ha−1. A total of 16 treatments were replicated three times in 48 plots of size 8 m × 3 m in a split-plot design. The variety PR 111 was transplanted on 17 July 2008 with row and plant spacing of 20 and 15 cm, respectively. At transplanting, one third of fertilizer N as per treatment, 30 kg P2O5 and 30 kg K2O per hectare were applied by broadcasting. Second (1/3) and third (1/3) dose of N as per treatment were applied at 21 and 42 days after transplanting, respectively. In the same layout after rice harvest during 2008, wheat variety PBW-550 was sown. The treatments comprised: four irrigations – IW/PAN–E ratio of 1.2 (I1W), 1.0 (I2W), 0.8 (I3W) and 0.6 (I4W) and four N treatments – N0, N60, N120 and N180 kg ha−1. A total of 16 treatments were replicated three times in 48 plots of size 8 m × 3 m in a split-plot design. At sowing 60 kg N (half dose), 60 kg P2O5 and 60 kg K2O per hectare were applied. Second half dose of N (60 kg ha−1) was applied 30 days after sowing.
Both the experiments were repeated during 2009/10. However in experiment 2, irrigation treatments in rice were modified as: flooded (I1Rm), IW/PAN–E ratios of 3.0 (I2Rm), 2.0 (I3Rm) and 1.0 (I4Rm). Treatments in wheat were similar to those used in 2008/09. In experiment 1 during 2008/09, total amount of irrigation water applied in D1rw, D2rw and D3rw treatments was 1522, 1446 and 1428 mm, respectively; and during 2009/10 the equivalent figures were 1492, 1348 and 1326 mm. In I1rw and I2rw it was 1652 and 1279 mm during 2008/09; and 1582 and 1195 mm during 2009/10. In experiment 2, water applied in I1RW, I2RW, I3RW and R4RW was 1975, 1695, 1375 and 1135 mm, respectively during 2008/09; and 1846, 1055, 1055 and 851 mm during 2009/10. Rice and wheat yields were analysed statistically using a split-plot design (Steel and Torrie, Reference Steel and Torrie1960). Equivalent rice yield (ERY) for the rice-wheat system was calculated as:

where price of rice was Indian rupees (Rs) 9300 t−1 and of wheat was Rs10 800 t−1.
Simulation study
Description of the CropSyst model. CropSyst was chosen as it is a process-based, simple, multi-year, multi-crop, daily time-step cropping system simulation model (Stockle et al., Reference Stockle, Martin and Campbell1994). Further, its performance for periodic biomass and leaf area index of rice crop in rice-wheat system (Jalota et al., Reference Jalota, Singh, Ray, Sood and Panigrahy2005; 2009) and soil water storage and N uptake (Chakraborty, Reference Chakraborty2008) has already been tested for this region. The model is designed to study the effect of cropping system management on crop productivity, water and N balance and the environment. For running simulations using CropSyst, specification of location, soil, crop and management parameters in their respective input files is necessary. The location file allows the selection of latitude, daily weather data files and ET models. The soil file requires specification of soil layers, thickness, texture, bulk density, cation exchange capacity, pH, volumetric water content at water potentials of −30 kPa (field capacity) and −1500 kPa (permanent wilting point). The management file enables the selection of crop specific irrigation, N fertilization, tillage operations and residue management. The crop file comprises common set of parameters related to classification, growth, morphology and phenology of the crop to represent different crops and crop cultivars. In this study, grain yields of rice and wheat crops, daily water and N balance components in cropped and intervening fallow periods were taken as model outputs.
Model evaluation
Calibrated and validated CropSyst model performance was further evaluated for biomass, yield and N uptake of rice and wheat varieties transplanted/sown during 2008/09 and 2009/10. The soil file was prepared using the observed data on soil texture, bulk density and hydraulic conductivity, EC, pH, organic carbon, ammonium and nitrate-N (Table 1). In the model some crop parameters were modified slightly (within the given range) to match the periodic biomass and yield (Table 2) and rest of the parameters were equivalent to those previously reported (Jalota et al., Reference Jalota, Singh, Chahal, Gupta, Chakraborty, Sood, Ray and Panigraphy2009). The location file was prepared from the daily weather data of rainfall, maximum and minimum temperature, maximum and minimum relative humidity and wind speed recorded at the station. Crop-specific (rice or wheat) management operations, performed on different dates in the experiments, were entered in the crop management files. The performance of the model was tested by calculating coefficient of correlation (R 2) and the root mean square error (RMSE) using equation:

where Pi and Oi are the predicted and observed values, respectively, Ō is the average of the observed data, and n is the number of observations. A value of zero for a model shows perfect fit between the observed and predicted data.
Crop parameters of rice and wheat modified in the model based on the experimental data.

Simulations
For the rice-wheat system, 24 combinations consisting of three dates of transplanting/sowing, two irrigations and four levels of fertilizer N were taken to simulate effect of these management interventions on water and N balance in rice-wheat cropping system. Transplanting/sowing dates were: transplanting of rice on 5 June and sowing of wheat on 20 October (D1rws), transplanting of rice on 20 June and sowing of wheat on 5 November (D2rws) and transplanting of rice on 5 July and sowing of wheat on 20 Nov (D3rws). Irrigation was to rice at two-days drainage period and to wheat at growth stages (I1rws), and to rice at four-days drainage period and to wheat at IW/Pan–E ratio of 0.9 (I2rws). The fertilizer levels were: N0, N240, N300 and N360 kg ha−1.
The annual water balance components were estimated as equation 3.

where I is irrigation, R is rainfall, Ec is soil water evaporation during cropped period, Eb from non-cropped or fallow period (s), T is transpiration from the canopy, D is drainage beyond root zone and ΔS is change in soil water storage in the root zone (1.8 m).
Wet and dry water savings were calculated as reduction in ET and irrigation water, respectively (Seckler, Reference Seckler1996).
N balance components were estimated by equation 4:

where Ini is initial soil mineral N, Min is mineralized N, Fer is fertilizer N, UT is uptake N, Le is leached N, GL is gaseous loss of N (ammonia volatilization plus denitrification), Im is immobilized N and S is residual N status in soil. Recovery efficiency (RE) was calculated as equation 5 (Dilz, Reference Dilz, Jenkinson and Smith1988) and agronomic efficiency (AE) by equation 6.


Economic analysis was done and profit was calculated taking revenue of equivalent rice yield as Indian rupees and cost of other inputs (Table 3).
Costs of operations used for calculating the economics.

Economic water productivity (EWP) and economic fertilizer N productivity (ENP) were calculated by equations 7 and 8, respectively:


RESULTS AND DISCUSSION
Crop yields in the field study
Experiment 1 – rice. There was a significant difference in rice yields (0.90 t ha−1) between the two years (Table 4); this may have been due to distribution of rainfall at flowering stage and sunshine hours during the crop season. In 2008, rainfall of 114 mm occurred in heavy showers (>40 mm) during the flowering stage whereas in 2009, rainfall of 55 mm occurred in light showers. Sunshine hours were 17% more in year 2009 than that in 2008. Reduction in yield with high rainfall with heavy showers during flowering (Chahal et al, Reference Chahal, Sood, Jalota, Choudhury and Sharma2007) and with limited sunshine (Stansel, Reference Stansel1967) has already been documented. During both years data indicated that by shifting date of transplanting from D1r to D3r, rice yield increased significantly and this increase was 1.80 t ha−1 (34%) in 2008 and 1.95 t ha−1 (33%) in 2009, irrespective of variety and irrigation treatments. These observations confirm the field and simulated results reported by the researchers in this region, who found improvement in the yield of rice grown under relatively lower evaporative demand due to more days having optimum temperature (37 °C) during post-transplanting period, less temperature stress during the flowering to anthesis stage and less spikelet sterility (Chahal et al., Reference Chahal, Sood, Jalota, Choudhury and Sharma2007; Jalota et al., Reference Jalota, Singh, Chahal, Gupta, Chakraborty, Sood, Ray and Panigraphy2009; Singh et al., Reference Singh, Gajri and Arora2001). Amongst the two varieties, differences in yields were non-significant in 2008; however, in 2009 V2r yielded 0.32 t ha−1 (5%) more rice than V1r, which differed significantly at p = 0.05. In I2r treatment, rice yield decreased by 0.69 t ha−1 in 2008 and 0.50 t ha−1 in 2009 as compared to that in I1r. In fact, in I2r treatment based on SWS up to 16 k Pa had widened the gap between two consecutive irrigations, which resulted in water-stressed conditions for a longer period in the root zone and consequently reduction in yield. Bouman and Tuong (Reference Bouman and Tuong2001) also reported 10–40% reduction in yields when SWS in the root zone was allowed to change from 10 to 30 kPa. Contrary to these results, Kukal et al. (Reference Kukal, Hira and Sidhu2005) observed no reduction in rice yield by applying irrigation at 16 kPa SWS compared to that at a two-day drainage period. This may be because of difference in soil type and the rooting system of the cultivars (Jalota et al., Reference Jalota, Singh, Chahal, Gupta, Chakraborty, Sood, Ray and Panigraphy2009). In 2008, interactions were non-significant while in 2009 the interaction among transplanting date and variety was significant. It indicates that the short-duration hybrid variety (RH 257) transplanted on 20 June can give higher yields.
Effects of transplanting date (DOT), variety and irrigation regimes on yield (t ha−1) of rice in the years 2008 and 2009.

D1r, D2r and D3r represent transplanting of rice on 5 June, 20 June and 5 July, respectively. V1r and V2r are PAU 201 and RH 257 varieties of rice. I1r and I2r are irrigation schedules as 2-days drainage after soaking of the surface water and soil water suction of 16 kPa in rice.
Experiment 1 – wheat. Like rice, wheat yield was 0.20 t ha−1 more in 2009/10 than in 2008/09 (Table 5). It could be ascribed to a 1–2 °C lower temperature at grain development stage in 2009/10. These results are consistent with reports by Lenka (Reference Lenka1998). Wheat grain yield was affected by date of sowing, variety and irrigation regimes. During 2008, yield in D2w was more than that of D1w and D3w by 0.65 and 0.68 t ha−1, respectively. Yield reduction in D1w was attributable to shortened anthesis duration that lead to the development of small plants with limited sink size and in D3w yield was decreased due to reduced durations of both anthesis and maturity, leading to poor grain fill (Arora and Gajri, Reference Arora and Gajri1998; Saini et al., Reference Saini, Dhadwal, Phadnawis and Nanda1986). Being a longer-duration variety, V1w yielded 0.43 t ha−1 more grains than V2w. Under the irrigation treatments of I1w, yield was higher by 0.39 t ha−1 than I2w. A significant interaction among variety and sowing date indicates that V2w can give significantly higher yield than V1w if sown either on 5 November or 20 November. During 2009, the effects of dates of sowing, variety and irrigation were not significant; however, interactions between date of sowing × irrigation; and variety × irrigation were significant. The interaction between date of sowing and irrigation indicated that in D2w yield was increased under I2w treatment but in D1w and D3w, higher yield was obtained in I1w as compared to I2w. It shows that more irrigation water is required by early and late sown wheat than by wheat sown on 5 November. Irrigation × variety interaction showed that in I1w treatment, yields of two varieties were comparable while in I2w, yield of variety V2w decreased significantly (0.64 t ha−1) as compared to V1w.
Effects of sowing date (DOS), variety and irrigation regimes on yield (t ha−1) of wheat in years 2008/09 and 2009/10.

D1w, D2w and D3w represent sowing of wheat on 20 Oct, 5 Nov and 20 Nov, respectively. V1w and V2w are PBW 343 and PBW 550 varieties of wheat. I1w and I2w are irrigation at growth stages and at IW/Pan ratio of 0.9 in wheat.
Experiment 2 – rice. Rice yield differed significantly between the years because the irrigation treatments were modified in the second year. Rice yield was significantly affected by the N levels in both years, but data could not be pooled due to modification in irrigation levels during 2009 as explained in the materials and methods. In 2008, yields were significantly higher in N60 than N0, and in N120 than N60 and N0, but differed non-significantly between N120 and N180 (Table 6a). Yields were comparable in I1R and I2R irrigation treatments. In I3R and I4R treatments, yields were statistically at par but significantly lower than I1R and I2R. Interaction between N level and drainage period was non-significant. Similarly in 2009, yields were statistically at par in N120 and N180. But in N180, yield was higher by 0.84 and 1.85 t ha−1 than in N60 and N0, respectively. Rice yield was significantly higher in I1Rm than that in IW/PAN–E ratio treatments. Amongst the ratios, yield in I2Rm irrigation treatment was higher by 0.50 and 0.93 t ha−1 than I3Rm and I4Rm treatments, respectively. Interaction between N levels and irrigation regimes was significant and showed that yield of I2Rm at N120 kg ha−1 was comparable to that of I3Rm at N180 kg ha−1. It indicates that decrease in irrigation water in rice can be substituted by additional dose of N fertilizer within a certain range.
Effects of nitrogen levels and irrigation regimes on yield (t ha−1) of rice during the years 2008 and 2009.

I1R, I2R, I3R and I4R represent the irrigation treatments of flooded, 2-days, 4-days and 6-days drainage after soaking of the surface water, respectively during 2008. I1Rm, I2Rm, I3Rm and I4Rm represent the irrigation treatments of flooded, irrigation at IW/Pan E ratio of 3, 2 and 1, respectively during 2009.
Experiment 2 – wheat. The effect of years was non-significant therefore the data was pooled (Table 6b). Wheat yield increased significantly with N level. Yield at N60, N120 and N180 kg ha−1 levels was higher by 1.61, 2.47 and 2.80 t ha−1, respectively, compared to that at N0. Similarly, wheat yield increased with application of more irrigation water. Grain yields at I1W, I2W and I3W were higher by 0.61, 0.26 and 0.26 t ha−1 than I4W. Interactions were non-significant.
Effects of nitrogen levels and irrigation regimes on yield (t ha−1) of wheat in the years 2008 and 2009 (pooled analysis).

I1W, I2W, I3W and I4W represent the irrigation at IW/Pan E ratio of 1.2, 1.0, 0.8 and 0.6, respectively.
Simulation study
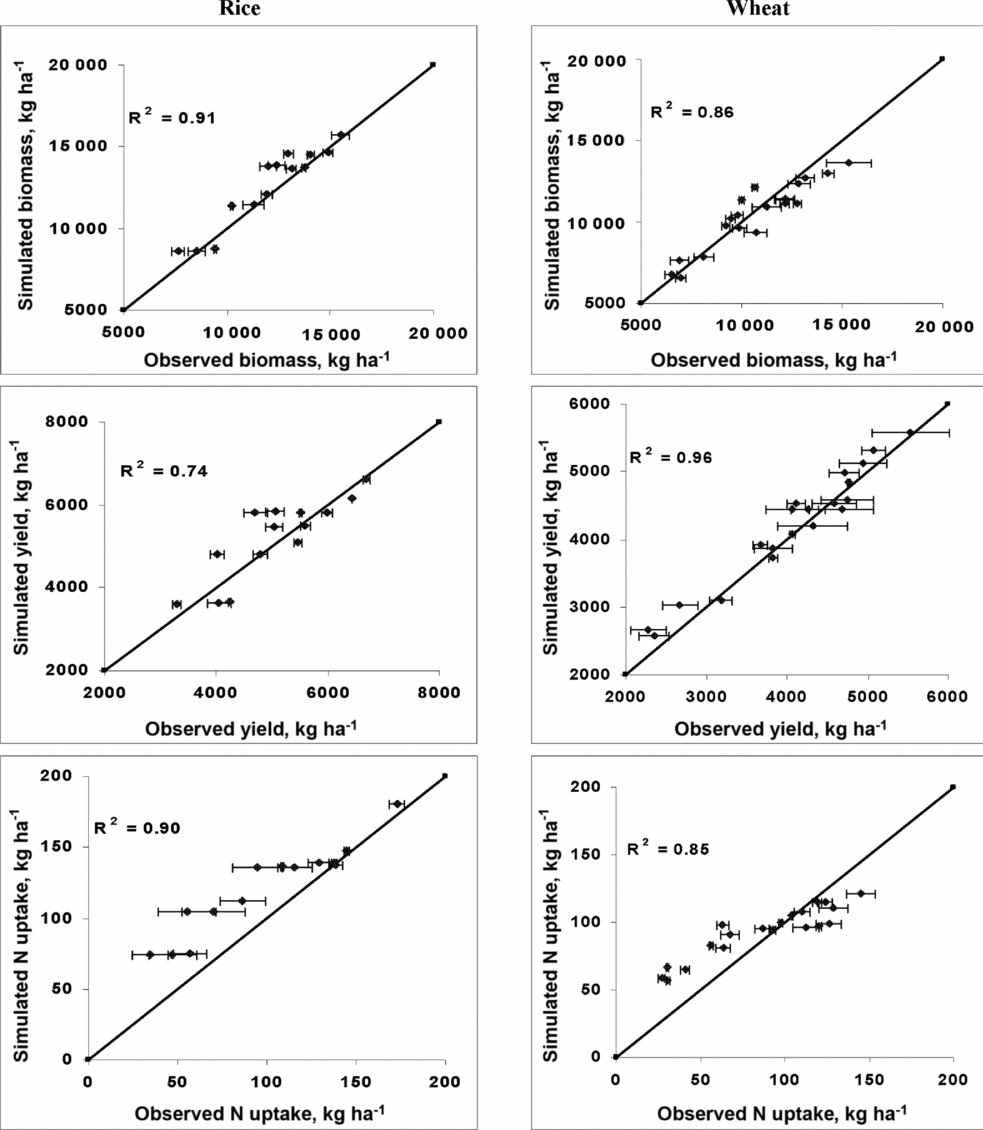
Model evaluation. The model was evaluated for the experimentally observed data recorded during seasons of 2008/09 and 2009/10. Simulated and observed biomass, grain yield and N uptake in rice and wheat crops are shown in Figure 1. There was a close matching between simulated and observed data with high coefficients of correlation (0.74–0.91). The coefficients of correlation in rice were 0.91, 0.74 and 0.90 for biomass, yield and N uptake, respectively. The corresponding RMSE values were 0.08, 0.10 and 0.27, respectively. In wheat, the coefficients of correlation were 0.86, 0.96 and 0.85 for biomass, yield and N uptake, and the corresponding values for RMSE were 0.09, 0.05 and 0.24, respectively. Some deviations occurred: these might be due to variability of the field and unavoidable inaccuracy in measured data during experimentation (as shown by error bars in Figure 1) and must be kept in mind while comparing the field data with the data generated from the model (Feng et al., Reference Feng, Bouman, Tuong, Cabangon, Li, Lu and Feng2007; Pannkuk et al., Reference Pannkuk, Papendick and Saxton1997).
Comparison of observed and simulated biomass, yield and nitrogen uptake.
Simulated results
Equivalent rice yield. Similar to the observed data, simulated results showed higher ERY in D2rws and at higher N levels. In D2rws, ERY was 1.04 and 0.27 t ha−1 more than in D1rws and D3rws, respectively (Table 7). At N levels of N300 and N360, ERY was increased by 0.54 and 0.84 t ha−1 over ERY of N240. In both irrigation treatments ERY were comparable.
Simulated equivalent rice yield, irrigation water applied, irrigation water productivity, evapotranspiration, crop water productivity, nitrogen uptake, recovery efficiency and agronomic efficiency in rice-wheat system in relation to transplanting/sowing dates of rice and wheat, nitrogen levels and irrigation regimes.

D1rws, D2rws and D3rws represent transplanting of rice on 5 June, and wheat on 20 Oct, transplanting of rice 20June and wheat on 5 Nov, transplanting of rice on 5 July and wheat on 20 Nov, respectively. I1rws is irrigation at 2-days drainage in rice and IW/Pan-E ratio = 0.9 in wheat and I2rws is irrigation at 4-days drainage in rice and IW/Pan-E ratio = 0.9 in wheat.
Water saving. Real water saving (wet saving) is that which is achieved by reducing the unproductive water losses by soil water evaporation (Jalota and Prihar, Reference Jalota and Prihar1998) or evapotranspiration (Seckler, Reference Seckler1996). It is difficult to quantify the magnitude of soil water evaporation (E) and transpiration from plants (T) in various treatments under field experiments, therefore, CropSyst generated ET values were used to estimate wet saving and CWP. The simulation study indicated that wet saving in the rice-wheat system was almost nil by shifting of transplanting/sowing date from D1rws to D2rws while there was saving of 48 mm in D1rws compared to D3rws (Table 7). There was no wet saving with irrigation and N treatments.
By shifting the transplanting/sowing date from D1rws to D2rws and D3rws, irrigation water saved (dry saving) was 75 and 188 mm, respectively; overall, the saving was 425 mm in I2rws compared to I1rws. This irrigation water saved is advantageous for the farmers. Firstly, irrigation water saved at field level can be used to irrigate extra acreage to increase total production (Bouman and Tuong, Reference Bouman and Tuong2001); secondly, reduced irrigation water will enhance the IWP in wheat (Jalota et al., Reference Jalota, Chahal and Choudhury2006; Zwart and Bastiaanssen, Reference Zwart and Bastiaanssen2004) and thirdly, will reduce the cost of pumping for lifting ground water and thus will improve the economic water productivity (Molden, Reference Molden2007).
Crop water productivity. The range of CWP for the rice–wheat system was from 0.67 to 1.31 kg m−3 (Table 7) which matches the range 0.67–1.31 kg m−3 reported by Chahal et al. (Reference Chahal, Sood, Jalota, Choudhury and Sharma2007). Zwart and Bastiaanssen (Reference Zwart and Bastiaanssen2004) reported a range of CWP from 0.60 to 1.60 kg m−3 (based on the data of 13 experiments across 4 continents). As compared to D1rws (1.04 kg m−3), the CWP increased by 10% in D2rws and D3rws. Irrigation treatments had no effect on CWP. The IWP was increased by 14 and 18% in D2rws and D3rws compared to D1rws (0.55 kg m−3), respectively; and by 23% in I2rws compared to I1rws (0.49 kg m−3). This implies that CWP in the rice–wheat system can be increased with shifting of transplanting date to give lower evaporative demand, and IWP by increasing the days of non-submergence in rice and demand based irrigation of wheat.
Nitrogen use efficiency. Recovery efficiency was enhanced by 5% in D2rws and D3rws compared to D1rws (55%). At N levels of 240, 300 and 360 kg N ha−1, the recovery efficiencies of N were 60, 59 and 57%, respectively (Table 8). The values of recovery efficiency were within the range (40% in wheat and 60% in rice) documented in the literature (Parshad and De Datta, Reference Parshad and De Datta1979; Sarkar et al., Reference Sarkar, Goswami, Banerjee, Rana and Uppal1994). The agronomic efficiency was improved by 6 and 7 kg kg−1 in D2rws and D3rws compared to D1rws (12 kg kg−1). At N levels of 240, 300 and 360 kg N ha−1 the values of AE were 18, 16 and 14 kg kg−1, respectively.
Simulated water balance components (mm) of rice-wheat system.

I1rws is irrigation at 2-days drainage in rice and IW/Pan-E ratio = 0.9 in wheat and I2rws is irrigation at 4-days drainage in rice and IW/Pan-E ratio = 0.9 in wheat.
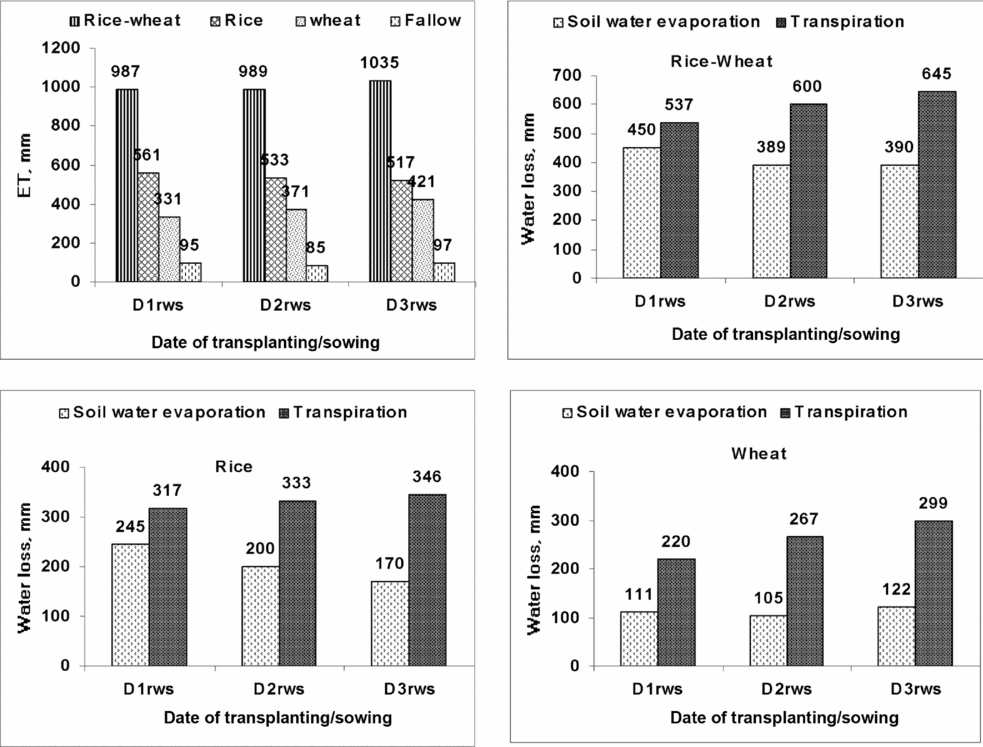
Water balance. Water balance components given in Table 8 showed that by shifting of transplanting date from D1rws to D2rws and D3rws (averaged over irrigation treatments) total water input (irrigation + rain) was decreased by 88 and 196 mm, respectively. But this shift caused ET to increase by 1 and 48 mm and drainage to decrease by 67 and 206 mm, respectively. In irrigation regime treatments, irrigation water applied in I2rws was 425 mm less than in I1rws, which reduced drainage by the same magnitude (425 mm) without affecting ET. Though shifting of transplanting date of the rice–wheat system from D1rws to D2rws, ET losses in the system (987 mm in D1rws and 989 mm in D2rws) were comparable but its apportioning to E and T (Figure 2) indicated that E was reduced by 61 mm (45 mm in rice + 6 mm in wheat +10 mm fallow) and T increased by 64 mm (16 mm in rice and + 47 mm in wheat + 1 mm in fallow). This reduction in E and increase in T were responsible for higher yield and crop water productivity. With further shifting date to D3rws, E component was not changed; ETs in both the irrigation treatments were identical. These results from a rice–wheat system corroborate the outcomes of simulation studies by Bouman et al. (Reference Bouman, Feng, Toung, Lu, Wang and Feng2007) and by Zwart and Bastiaanssen (Reference Zwart and Bastiaanssen2004) from data analysis of 13 publications across 8 countries indicating little effect of irrigation water management on ET in rice.
Evapotranspiration (ET) losses as affected by dates of transplanting/sowing and E and T components in rice and wheat crops individually and the system.
Nitrogen balance. Nitrogen balance of applied nitrogen in the rice-wheat system is given in Table 9. However, the data for individual crops is not given for sake of brevity. It showed that applied N (averaged over date of transplanting, irrigation and amount of fertilizer) contributed 28% (10% in rice + 18% in wheat) to gaseous losses, 12% (12% in rice + 0% in wheat) to leaching losses, 59% (27% in rice + 32% in wheat) to nutrient uptake, 1% (0% in rice + 1% in wheat) to immobilization and 2% (0.5% in rice +1.5% in wheat) to residual N in the soil profile. The magnitudes of N balance components matched closely with findings of other researchers such as 24% gaseous loss under alternate aerobic and anaerobic conditions (Reddy and Patrick, Reference Reddy and Patrick1975), 9–36% as leaching, dependent upon the percolation rate of water in soil (Vlek et al., Reference Vlek, Byrnes and Craswell1980) and 60% as N uptake (Aulakh et al., Reference Aulakh, Khera, Doren, Kuldip Singh and Singh1997). The simulated results showed that the major loss of N in this cropping system was through leaching in rice and as gaseous loss in wheat. Similar results have been reported from field studies by Bijay Singh et al. (Reference Bijay-Singh, Bronson, Yadvinder-Singh, Khera and Pasuquin2001). With shifting the date of transplanting in rice from D1rws to D3rws, gaseous loss and leaching of applied N was decreased; nutrient uptake and immobilization was increased but their magnitude of increase was much less. However, when the N fertilizer input to the rice-wheat system increased from 240 to 300 kg ha−1, there were increased losses of 17 kg ha−1 as gases (7 kg ha−1 in rice +10 kg ha−1 in wheat) and 9 Kg ha−1 as leaching (9 kg ha−1 in rice). Thirty-three kg ha−1 was used as N uptake (15 kg ha−1 in rice + 18 kg ha−1 in wheat).
Simulated nitrogen balance components (kg ha−1) of applied fertilizer in rice-wheat system.

Ini is Initial soil N, App is applied N, Min is mineralized N, GL is gaseous loss of N (ammonium volatilization plus denitrification), Le is Leached N, UT is Uptake N, Im is immmobilized N and S is residual N status in soil.
I1rws is irrigation at 2-days drainage in rice and IW/Pan-E ratio of 0.9 in wheat, and I2rws is irrigation at 4-days drainage in rice and IW/Pan-E ratio of 0.9 in wheat.
Economic analysis. In the rice–wheat system higher profit (Rs67 685 ha−1) was obtained in D2rws, which was Rs13 971 (20%) more than that of D1rws and Rs1678 (2%) more than that of D3rws, The best irrigation and N management practice in D2rws was I2rws and fertilizer N at the rate of 300 kg ha−1, where a profit of Rs69 847, IWP of 0.71 kg m−3 and CWP of 1.28 kg m−3 were realized. The EWP in D2rws (Rs5.6 m−3) was higher by Rs0.9 and 0.4 m−3 than that in D1rws and D3rws. The corresponding increase in ENP in D2rws (Rs230 kg−1 fertilizer N) was Rs79 and Rs6 kg−1 fertilizer N, respectively. At different levels of N, EWP was affected marginally. It was Rs5.8 m−3 in N240, Rs6.2 m−3 in N300 and 6.4 m−3 in N360. ENP was almost same in N240 and N300 (Rs211 kg−1 fertilizer N) but was less by Rs30 kg−1 fertilizer N at N360. In I2rws EWP (Rs5.3 m−3) was higher by Rs2.0 m−3 and ENP (Rs204 kg−1 fertilizer N) by Rs5 kg−1 fertilizer N than that in I1rws.
CONCLUSIONS
Results of the present field and simulation study suggests that in central Punjab of India, best management practice for the rice–wheat system (medium-duration varieties) is transplanting of rice on 20 June and sowing of wheat on 5 November, irrigation of rice at 4–day drainage period and to wheat at IW/Pan–E ratio of 0.9 and fertilizer dose of N 150 kg ha−1 to each crop. Higher yield and crop water productivity in this practice is mainly due to reduction in unproductive water loss as E (61 mm) and increase in productive loss as T (63 mm). Increasing productivity with higher dose of N fertilizer not only increases N losses as leaching and in gaseous form, but it may lead to environmental pollution and susceptibility of plants to insect-pests and diseases. Thus, there is a need to improve the efficiency of the present recommended rate of N fertilizer (240 kg ha−1 for the rice–wheat system) by (1) using it in conjunction with green manures (Aulakh et al., Reference Aulakh, Khera, Doren, Kuldip Singh and Singh1997) and (2) adopting need based application of N with leaf color chart or chlorophyll meter (Bijay Singh et al., Reference Bijay-Singh, Ladha, Bronson, Balasubramanium, Singh and Khind2002; Yadvinder-Singh et al., Reference Yadvinder-Singh, Bijay-Singh, Ladha, Bains, Gupta, Jagmohan-Singh and Balasubramanian2007). This study also warrants focusing future research on devising a package of economically and environmentally viable best management practices, which can sustain yield, give more profit, save ET and irrigation water for other agro-climatic conditions as well as futuristic scenarios of climate change.



