1 Introduction
In the late 1990s, Sweden undertook a major reform that gave individuals more responsibility for managing their pensions. The reformed pension system gives individuals more choice regarding the management of pension savings as well as when to start withdrawing benefits (Sundén, Reference Sundén and Lusardi2008). Yet, a growing body of research documents that many households do not have adequate tools for making complex financial decisions (Campbell, Reference Campbell2006).
This paper examines the extent to which Swedish adults are equipped to make complex financial decisions with a particular focus on pension planning. We focus on a simple measure of financial literacy designed to assess respondents' basic understanding of finance and their ability to perform basic calculations. We use three carefully designed questions that have been used in numerous surveys (see Lusardi and Mitchell, Reference Lusardi and Mitchell2007b, Reference Lusardi, Mitchell, Lusardi and Mitchell2011) to assess financial literacy levels of respondents. Previous research has shown that such narrow measures of financial literacy can be good predictors of financial decision making, including the decisions involved in retirement planning (see, e.g., Lusardi and Mitchell, Reference Lusardi and Mitchell2007a, Reference Lusardi and Mitchellb). Our data are from the Swedish Financial Supervisory Authority 2010 consumer survey, which uses a representative sample of about 1,300 adults aged 18–79 and is described in more detail below.
We find that many Swedish adults have low levels of financial literacy. We also find large differences between demographic groups. In particular, financial literacy levels are lower among the young, the old, women and those with low income or low educational attainment. In addition, many respondents report that they have not tried to plan for retirement, in the sense that they have not tried to figure out how much they need to save for their retirement.
We also find a positive relationship between financial literacy and planning for retirement. Levels of financial literacy are higher, on average, among those who report having tried to plan for retirement. When controlling for demographic variables, the relationship is less clear, but there is still a positive association between planning for retirement and correctly answering an advanced financial literacy question about risk diversification.
The paper proceeds as follows. In Section 2, we describe the data. In Section 3, we report what our data show about levels of financial literacy in the population and the relationship between financial literacy and planning for retirement. In the concluding section, we relate our findings to features of the Swedish pension system.
2 Data
The data were collected via a telephone survey of approximately 1,300 Swedish adults aged 18–79 that was commissioned by the Swedish Financial Supervisory Authority and carried out by a private contractor in May–June 2010. An independent random sample that is representative of the Swedish population between the age group of 18 and 79 was generated using Statens personadressregister, a database containing all individuals registered as residents of Sweden. Phone numbers for the sample were collected from another database, PAR, which collects both fixed and cell phone numbers from all major phone providers in Sweden. In order to minimize non-response, the individuals in the sample were called up to eight times at different times of the day and on different days until contact was made. The participation rate was 45%. There were no monetary incentives for participation.
The survey was targeted at individuals rather than households, and participation was not conditioned on being the main decision maker about the household finances. However, respondents were asked if they were the main financial decision maker in the household.
The data are cross-sectional. The respondents had not received the questions before. The sample is evenly divided between men and women. The average age is 44. Educational attainment was measured as belonging to one of five categories: having less than a high-school education, a high-school degree, vocational or some college education, a college degree and postgraduate education. Individuals were asked to report their monthly pre-tax income in Swedish kronor (SEK)Footnote 1 using four ascending categories. The majority of individuals in our sample reported being employed (57%). About one-third of respondents were single (36%) and about two-thirds in a relationship, either living together (61%) or apart (3%). Less than one-tenth of respondents were born outside of Sweden (8%). More information about the sample can be found in Almenberg and Widmark (Reference Almenberg and Widmark2011) .
3 Empirical results
3.1 Financial literacy levels
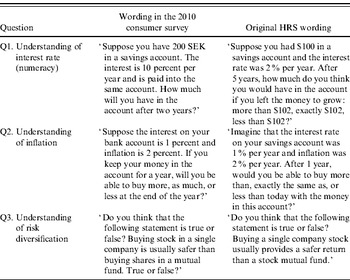
The questionnaire includes questions measuring financial literacy that are largely based on those designed by Annamaria Lusardi and Olivia Mitchell for the 2004 U.S. Health and Retirement Study (HRS) and the Rand American Life Panel (ALP) (see Lusardi and Mitchell, Reference Lusardi and Mitchell2007b, Reference Lusardi, Mitchell, Lusardi and Mitchell2011). The questions are as follows (they are also reported in Table A1, together with the wording of the 2004 U.S. HRS questions).
1. Understanding of Interest Rate (Numeracy). Suppose you have 200 SEK in a savings account. The interest is 10 percent per year and is paid into the same account. How much will you have in the account after two years? Respondent calculation/Do not know/Refuse to answer.
2. Understanding of Inflation. Suppose the interest on your bank account is 1 percent and inflation is 2 percent. If you keep your money in the account for a year, will you be able to buy more, as much, or less at the end of the year? Do not know/Refuse to answer.
3. Understanding of Risk Diversification. Do you think that the following statement is true or false? Buying stock in a single company is usually safer than buying shares in a mutual fund. True/False/Do not know/Refuse to answer.
The first question (compound interest) is similar to the corresponding HRS question but more difficult to answer correctly, as it is open ended. HRS respondents were offered three possible answers in addition to ‘do not know’. The question we used places greater demand on numeracy and it is not clear whether incorrect answers are due to not understanding interest compounding or to not being able to perform the exact calculation. By contrast, the inflation and risk diversification questions are more similar to the HRS questions and were translated into Swedish with only minor modification.
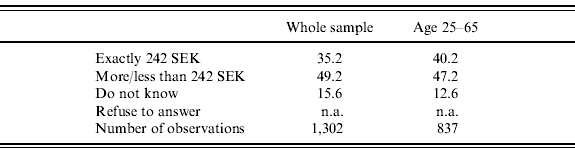
Table 1a displays the answers to the compound interest question. Only slightly more than one-third, 35%, provided the correct answer. About half of the respondents, 49%, gave incorrect answers and 16% said they did not know the answer, suggesting that a majority of respondents lack the ability to calculate compound interest. We cannot rule out, however, that some respondents understand interest compounding quite well but made a minor mistake in the calculation, thus providing an incorrect answer. Some of these respondents would probably have provided a correct answer to the simpler HRS question. The question is open-ended, but since the answers were coded only as ‘correct’, ‘incorrect’ or ‘do not know’, we are not able to make precise comparisons with the corresponding HRS question.
Interest question
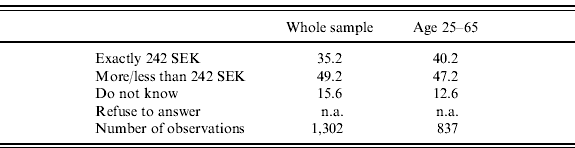
Note: Our wording was more difficult than the original HRS question. We asked: ‘Suppose you have 200 SEK in a savings account. The interest is 10% per year and is paid into the same account. How much will you have in the account after 2 years?’
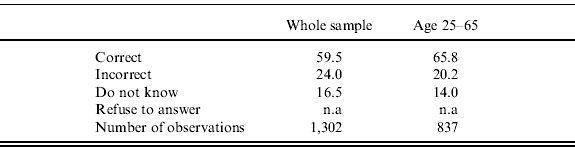
The answers to the inflation question are summarized in Table 1b. Around 60% of all respondents correctly answered that they would be able to buy less at the end of the year. Around 24% gave incorrect answers and 16% answered that they did not know. Thus, 40% of respondents seem to lack a basic understanding of inflation. Similar to many other countries, it is primarily the older generations of Swedes who have experience with high levels of inflation. Sweden had inflation in the 5–15% range for most of the 1970s and 1980s. Following a move to explicit inflation targeting and central bank independence in the 1990s, inflation declined and has hovered around 2% for most of the last decade.
Inflation question
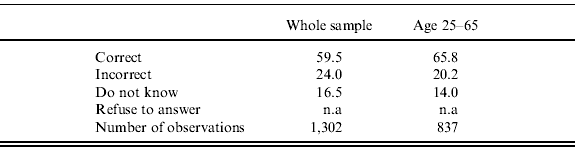
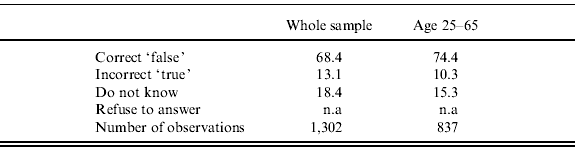
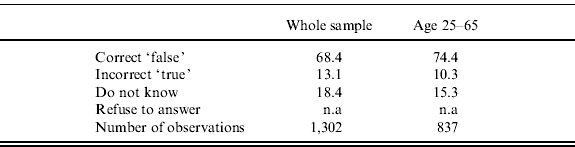
Table 1c displays the answers to the risk diversification question. The respondents show a good understanding of risk diversification, with 68% having provided a correct answer, i.e., that the statement is false. Only 13% provided an incorrect answer and 18% answered that they did not know. A large fraction of the Swedish population hold stocks and/or shares in mutual funds (see, e.g., Christelis et al., Reference Christelis, Jappelli and Padula2010), and the large percentage of correct answers to this question aligns with what one would expect, assuming investor experience is positively associated with financial knowledge.
Risk question
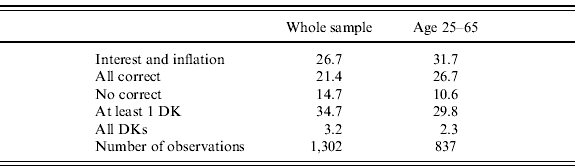
The overall performance of respondents is summarized in Table 1d. Only about one-quarter of respondents correctly answered the two questions on compound interest and inflation. Moreover, only 21% answered all three questions correctly. This poor overall performance is to some extent driven by the high fraction of respondents who failed to provide a correct answer to the compound interest question. If we look only at the inflation and risk diversification questions, the performance is better, with about 46% of the sample providing correct answers to both questions. Approximately 15% of the sample could not provide a correct answer to any of the questions. More than a third of the respondents, 35%, answered ‘do not know’ at least once. Only 3% answered ‘do not know’ to all questions.
Answers across questions
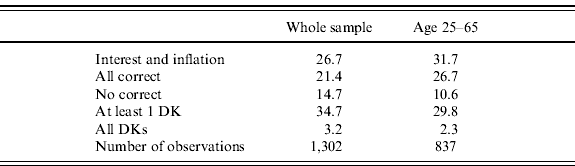
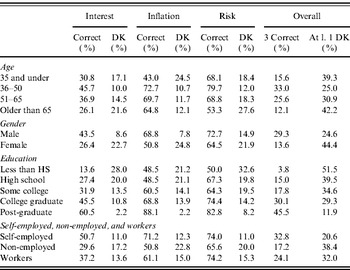
Below, we analyze overall performance on the three financial literacy questions and examine how performance varies across demographic groups. Previous research has found that financial literacy levels are lower among those with low income, low educational attainment and women (e.g., Lusardi and Mitchell, Reference Lusardi and Mitchell2008). Table 2 reports the answers to the three questions and overall performance across different demographic characteristics.
Distribution of financial literacy across demographics

Source: Data from 1,302 observations from telephone interviews with a representative sample of the Swedish population.
Note: The sample size is restricted to 1,277 observations with no missing values on age and education. ‘DK’ refers to ‘do not know’ responses. ‘at l. 1 DK’ refers to ‘at least one do not know’ response.
Age. Financial literacy follows a hump-shaped profile with age for overall performance on the three questions as well as for each question separately, in line with other research that shows a similar pattern for financial decisions (see Agarwal et al., Reference Agarwal, Driscoll, Gabaix and Laibson2009). The differences in means between all age groups are statistically significant (two-sided t tests).Footnote 2 The best performance is found among respondents who are between 36 and 50 years of age. The worst performance, apart from that of understanding inflation, is found among respondents who are older than 65.
Similarly, the proportion of respondents who reply that they do not know the answer to one of the three questions follows a U-shaped pattern for all questions apart from the inflation question. Here the ‘do not know’ responses decrease with age, suggesting that it is the younger respondents, who have less experience of high inflation, that have less familiarity with the concept of inflation.
Education. Financial literacy is highly correlated with educational attainment. Among those who lack high school education only about 4% answered all three questions correctly, compared to 46% of those with the highest level of schooling. Similarly, over half of the respondents who lack a high school degree responded ‘do not know’ to at least one question, compared to only 12% of those with post-graduate education. Two-sided t tests confirm the pattern, with all differences between educational groups being statistically significant except high school versus some college or vocational education. We find similar patterns for all three questions separately.
In the survey, we also have information on college majors. Of 491 respondents with a college degree, 27% majored in engineering, 17% majored in economics, 18% majored in social sciences, 19% majored in arts and humanities and 15% majored in medicine. We find large differences in performance on the financial literacy questions among respondents with different college majors, with quantitative majors performing better. Almost half of the respondents with a major in economics or engineering answered all three questions correctly compared to about one-quarter of respondents with other majors. The largest difference is in the fraction of correct answers to the first and second questions. Among those with an economics major, 68% and 82%, respectively, provided a correct answer to the compound interest and the inflation questions. Among other college majors, the fraction was 36% and 66%, respectively. There is no large difference in answering the risk diversification question correctly among the college majors (81%, 75%, 81%, 74% and 67%, respectively, for the five groups).
Employment status. Financial literacy also varies with employment status. The lowest levels of financial literacy are found among those who are not working. Two-sided t tests confirm the pattern, with all differences between the groups being statistically significant except for the risk diversification question. The same pattern is found in the ‘do not know’ answers.
Gender. Women perform significantly worse than men on each of the three financial literacy questions as well as in overall performance.Footnote 3 Only 14% of female respondents provided correct answers to all three questions, compared to 29% of male respondents. Moreover, almost half of the female respondents answered ‘do not know’ to at least one question. This could indicate that women are aware of their lack of financial knowledge. Two-sided t tests also confirm that differences in the means between men and women in overall performance, as well as in having at least one ‘do not know’, are significantly different from zero.
The question that elicits the greatest difference in response by gender is the compound interest question. Forty-four percent of men compared to 26% of women provided the correct answer. To this question, women were more likely to respond ‘do not know’. On the inflation question, more women than men answered ‘do not know’, but men and women were equally likely to be wrong, with approximately 24% responding incorrectly, while 69% of men compared to 51% of women correctly answered the inflation question. Gender differences in responses are less with the risk diversification question, with 73% of men and 65% of women correctly answering that buying shares of stock is riskier than buying shares of a mutual fund. The difference again arises from a larger share of women answering ‘do not know’.
3.2 Gender differences in Sweden
Lower levels of financial literacy among women has been documented in research in other countries (see, e.g., Lusardi and Mitchell, Reference Lusardi and Mitchell2008), but it is noteworthy that we find such large gender differences given that Swedish women have a high labor force participation rate, implying that they participate in public and occupational pension plans to an extent similar to men. Swedish women have been found to be at least as active as men in managing their mandatory individual pension accounts (Engström and Westerberg, Reference Engström and Westerberg2003) and to choose similar levels of stock market exposure (Säve-Söderbergh, Reference Säve-Söderbergh2011).
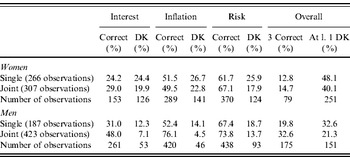
A possible explanation is that the gender differences in financial literacy levels are due to women not making the economic decisions in the household. In Table 3, we show responses to financial literacy questions according to responsibility for household economic decision-making.
Distribution of financial literacy across single and married/cohabitant households

Source: Data from 1,302 observations from telephone interviews with a representative sample of the Swedish population.
Note: The sample size is restricted to 1,277 observations with no missing values on age and education. Furthermore individuals who reported that either they or their partner single-handedly were responsible for larger financial decisions are dropped due to too few observations (43 for women (of which 13 indicated ‘the partner alone’ decides on economic decisions and 30 indicated ‘I alone’ decide on economic decisions) and 30 observations for men (of which 3 indicated ‘the partner alone’ decides on economic decisions and 27 indicated ‘I alone’ decide on economic decisions). ‘Joint’ refers to individuals in married or cohabitant relationship with joint decision-making in economic decisions. ‘Single’ refers to single-headed households. ‘DK’ refers to ‘do not know’ responses. ‘At l. 1 DK’ refers to ‘at least one do not know’ response.
Very few of the married or cohabiting respondents state that their partner is single-handedly responsible for the economic decision-making (2% of women and 0.4% of men) and few claim to be single-handedly responsible for the economic decision-making (5% of women and 4% of men). Therefore, comparisons to these groups are not possible. If we instead look at financial literacy levels as correlated with responsibility for household economic decision-making among respondents who are single and those who are in relationships with joint economic decision-making, we find similar patterns for men and women. The lowest levels of financial literacy are found among respondents who are single. Two-sided t tests confirm the pattern, with differences between single respondents and married/cohabiting joint decision makers being statistically significant. Men who are joint decision-makers perform best overall in the financial literacy questions, while single women perform worst overall. The same pattern is found in evaluating the ‘do not know’ answers.
3.3 Financial literacy and retirement planning
Survey respondents were asked the following question about financial planning for retirement:
‘I have tried to figure out how much I need to save for retirement’.
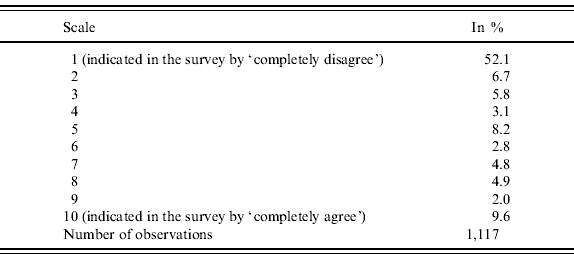
Respondents were asked to respond on a scale from 1 to 10, with 1 representing ‘completely disagree’ and 10 representing ‘completely agree’. The distribution of responses is concentrated at the lower end, implying that most responded 1. The median response is 1 and the average response is 3.4. See Table A2 for details.
From this index, we categorize individuals into two groups: planners and non-planners. Respondents in the top quarter of responses (6 or higher) are classified as planners. Three-quarters (76%) of the sample are classified as non-planners: they have not tried to figure out how much they need to save for retirement.
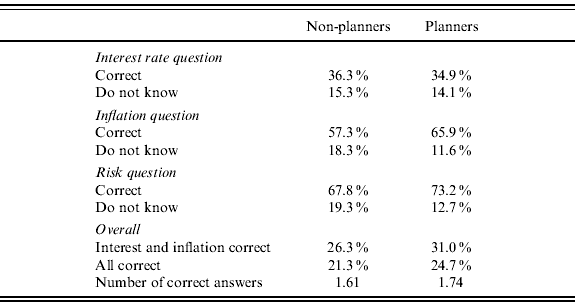
In Table 4, we display correlations between being a planner and level of financial literacy. Planners and non-planners do not differ in their ability to calculate compound interest, but planners are more likely to understand the concept of inflation and interest. A two-sided t test confirms that this difference is significantly different from zero at the 1% level. Planners are more likely to provide a correct answer to the risk diversification question than are non-planners, with the difference being statistically significant at the 1% level. A larger share of non-planners answer ‘do not know’. Overall performance on the financial literacy measures is better among planners than non-planners. The difference in the means of number of correct answers is statistically significant at the 5% level.Footnote 4
Financial literacy by retirement planning
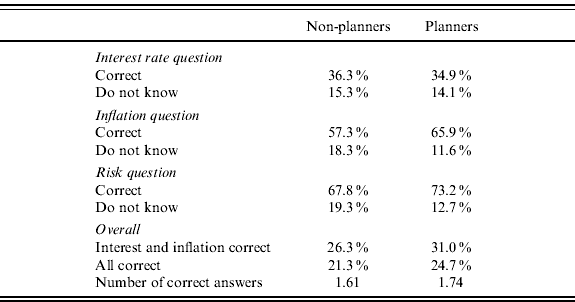
Source: Data from 1,302 observations from telephone interviews with a representative sample of the Swedish population.
Note: The sample size is restricted to 1,177 observations with no missing values on pension planning or on demographics.
Next, we regress the planning variable (0–10) on financial literacy. In the first specification, financial literacy is a dummy variable that equals one if a respondent correctly answered all three financial literacy questions (Table 5, column 1). In the second specification, the financial literacy variable is the number of correct answers to the three financial literacy questions (Table 5, column 2). We control for age, gender, education, income group, marital status, household size, employment status, being a home-owner and living in the northern regions of Sweden.
OLS estimates of retirement planning on financial literacy

Source: The data are constituted of 1,302 observations from telephone interviews with a representative sample of the Swedish population.
Note: The sample size is restricted to 813 observations to include only respondents between 25 and 65 years of age with no missing information on pension planning or on demographics. Robust standard errors in parentheses.
a Our wording was more difficult than the original HRS question, see Table A1.
Legend:
*** P<0.01, **P<0.05, *P<0.1.
Our main finding is that neither measure of financial literacy appears to be linked to planning.
These results can be understood by looking at the effect of each financial literacy question. By adding three dummy variables for having correctly answered each of the three questions separately (Table 5, column 3), we find that two of the questions have the opposite impact on planning, together yielding a zero impact on planning. A correct answer to the risk diversification question is positively correlated with planning, whereas a correct calculation of the interest compounding problem is negatively correlated with planning. The interest rate question in our survey is considerably more difficult than the question that appeared in the 2004 HRS – one could argue that it measures numeracy rather than financial literacy – whereas the question measuring more advanced financial sophistication (the risk diversification question) has a positive and statistically significant effect on planning. We also use the number of ‘do not know’ responses as a measure of financial literacy (Table 5, column 4). We find a clear negative and statistically significant association between being less financially literate, measured as the number of ‘do not know’ responses, and planning.Footnote 5
Looking at the effect of the other variables in the regressions, we find a link between planning and age, with older individuals being far more inclined to plan. We do not find a statistically significant link between education and planning, while there is a positive and significant relationship between having a higher income and planning.
4 Discussion
Our results point to a link between financial literacy and planning, but the link is not as strong as in some other countries (see, e.g., Lusardi and Mitchell, Reference Lusardi and Mitchell2007a). A possible reason is that features of the Swedish pension system affect the relationship between financial literacy and planning. About one-eighth of an individual's contribution to the public pension system is directed to fully funded, mandatory individual accounts (the ‘premium pension’). When these accounts were introduced in 2000, a great deal of financial information was disseminated to everybody eligible for a pension, independent of income or expressed interest. The pension agency continuously provides all participants with information about basic financial concepts, in particular the relative risks of equities and bonds and how asset returns are associated with risk levels. The provision of extensive but simple financial information to the entire working population of Sweden is likely to have contributed to raising awareness of basic financial concepts.
The pension system also makes an effort to provide simple forecasts about the future value of pensions. Individually tailored information about accrued (notional and funded) claims, as well as forecasts about future benefits, are provided to all participants in the public pension system on an annual basis through the ‘Orange Envelope’. The information is brief and simple. At the pension agency website, further forecasts can be obtained throughout the year using an online calculator that draws on information about the individual's past contributions. When such information is provided to everybody and expressed in simple terms, financial literacy may become a less important determinant of planning for retirement.
Even if it is the case that the design of the pension system has raised financial literacy levels and lowered the knowledge barriers to planning for retirement, our results still give cause for concern. Our analysis indicates that many Swedish adults lack the financial literacy required for informed financial decision-making, and that broad groups of the adult population may be susceptible to making financial mistakes. In light of this, it is noteworthy that the fraction of individuals making active choices in the pension system's individual accounts has declined considerably, from about two-thirds when the accounts were first introduced to about 10% or less. There is also ample evidence of investor mistakes with regard to the individual accounts: not rebalancing portfolios or exhibiting home-market bias (Palme et al., Reference Palme, Sundén and Söderlind2007), using heuristics such as a 1/n rule to choose investments (Cronqvist and Thaler, Reference Cronqvist and Thaler2004) and being inattentive (Dahlquist and Martinez, Reference Dahlquist and Martinez2010). Even though most recipients claim to read the information in the Orange Envelope, fewer than half report having a good understanding of the pension system and many report that they lack sufficient knowledge to manage their individual accounts (Sundén, Reference Sundén and Lusardi2008). In other words, we still have reason to be concerned about the low levels of financial literacy in the Swedish population, in particular among the most vulnerable groups.
Appendix
Financial literacy questions

Distribution of responses to the question about planning for retirement: ‘I have tried to figure out how much I need to save for retirement’ on a 1–10 scale
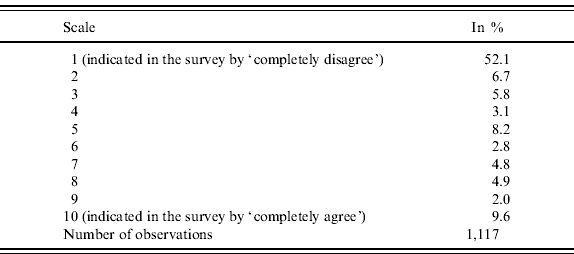
Note: The data are constituted of 1,302 observations from telephone interviews with a representative sample of the Swedish population. The sample size is restricted to 1,117 observations with no missing information on pension planning or on demographics.