1. Introduction
The Xilamulun metallogenic belt on the northern margin of the North China Craton (NCC) is an important Mo–Ag–Pb–Zn producer in China (Fig. 1). The Xilamulun metallogenic belt extends E–W for approximately 400 km and S–N for 100 km. It contains medium- to large-scale molybdenum deposits, such as the Chehugou, Xiaodonggou, Jiguanshan, Nianzigou, Baimashi and Kulitu deposits, and their discovery was an important breakthrough in recent years for mineral exploration on the northern margin of the NCC (Zeng et al. Reference Zeng, Liu, Zhang, Chen and Zhang2011a ). Previous studies suggested that the mineralization occurred during the Yanshanian period (Rui, Shi & Fang, Reference Rui, Shi and Fang1994). However, recent studies show that the Indosinian period is also an important ore-forming epoch in the Xilamulun metallogenic belt (Zeng et al. Reference Zeng, Liu, Zhang, Chen and Zhang2011a ; Liu et al. Reference Liu, Zhao, Sun, Li, Liu, Chen, Zhang and Sun2010). The ore-forming epoch in the Xilamulun metallogenic belt includes three stages: Early Triassic, Late Jurassic and Early Cretaceous. The Chehugou and Kulitu deposits are the only Triassic deposits. The Late Jurassic Mo deposits and granitoids are related to Palaeo-Pacific tectonic evolution, and the Early Cretaceous Mo deposits and granitoids are related to lithosphere thinning in east China (Zeng et al. Reference Zeng, Liu, Zhang, Chen and Zhang2011a ). All studies on the Xilamulun metallogenic belt show that the Mo mineralization is related to the granitoids in genesis (Nie et al. Reference Nie, Zhang, Du, Jiang and Liu2007; Qin et al. Reference Qin, Liu, Zeng and Luo2009; Wan et al. Reference Wan, Hegner, Zhang, Rocholl, Chen, Wu and Chen2009; Zeng et al. Reference Zeng, Liu, Zhang, Qin, Cheng, Yu and Ye2009, Reference Zeng, Liu, Qin and Zhang2010, Reference Zeng, Liu, Zhang, Chen and Zhang2011a ; Chen et al. Reference Chen, Liu, Liu, Zhang, Qin and Zhang2010; Liu et al. Reference Liu, Zhao, Sun, Li, Liu, Chen, Zhang and Sun2010; Zhang et al. Reference Zhang, Wu, Wan and Chen2009; Wu et al. Reference Wu, Zhang, Chen and Wan2008, Reference Wu, Zhang, Wan, Chen, Xiang, Pirajno, Du and Qu2011).
Regional geological map of the Chehugou (adapted from Zeng et al. Reference Zeng, Liu, Zhang, Zhang, Chu, Zhang, Wang and Duan2011b ). NCC – North China Craton; EPAZ – Early Palaeozoic accretion zone; LPAZ – Late Palaeozoic accretion zone; XF – Xilamulun River Fault; NF – Neijiang Fault; CF – Chifeng Fault. Molybdenum deposit names: 1 – Chehugou; 2 – Nianzigou; 3 – Jiguanshan; 4 – Kulitu; 5 – Baimashi; 6 – Xiaodonggou; 7 – Gangzi; 8 – Tuohe; 9 – Hongshanzi; 10 – Xinfangzi; 11 – Talagou; 12 – Yangchang; 13 – Longtoushan.

The Chehugou Mo deposit is granite hosted. Wan et al. (Reference Wan, Hegner, Zhang, Rocholl, Chen, Wu and Chen2009) reported a Rb–Sr isochron age of c. 256 Ma for chalcopyrite from the Chehugou Mo deposit that suggested its mineralization age was Late Permian. They proposed that the metallogenesis had a genetic relationship with the syenogranites. Recently, Zeng et al. (Reference Zeng, Liu, Zhang, Chen and Zhang2011a ) obtained a Re–Os isochron age for molybdenite from the Chehugou Mo deposit that showed that the Chehugou Mo deposit was formed in the Triassic period and that the metallogenesis had a relationship with the Triassic granite porphyry in the deposit area. Furthermore, Liu et al. (Reference Liu, Zhao, Sun, Li, Liu, Chen, Zhang and Sun2010) proposed that the Mo deposit was formed during the Late Permian period according to the Re–Os isochron age (257 Ma) of molybdenite from the NE-trending Cu–Mo veins of the Chehugou deposit and that the metallogenesis was structurally controlled. However, Rui, Shi & Fang (Reference Rui, Shi and Fang1994) suggested that the granitoid in this area formed during the Late Indosinian–Yanshanian period (205–135 Ma). To understand the metallogenesis of the Mo deposit and its genetic relationship to the host granites, we present the whole-rock elemental geochemistry, Sr–Nd–Pb isotope geochemistry and U–Pb zircon geochronology of the host granitoids for the Chehugou deposit, to constrain the ages and petrogenesis of the host granitoids and assess the broader tectonomagmatic implications of the Chehugou Mo deposit and its host granites. Our results have significant implications for constraining the molybdenum resource of the Mo deposit.
2. Geological setting and petrography
The Chehugou area is divided into two parts by the Chifeng Fault on the northern margin of the NCC (Fig. 1). The NCC lies to the south of the fault and the Early Palaeozoic accretion zone (EPAZ) in the north. The crystalline basement of the NCC is composed of Archaean gneiss and granite, whereas the EPAZ is mainly composed of Ordovician–Silurian metamorphic rocks and Permian and Jurassic volcanic and sedimentary rocks. There is a Late Palaeozoic accretion zone to the north of the Xilamulun River Fault, which is mainly composed of Permian volcanic and sedimentary rocks. The intrusive rocks in the area mainly include Jurassic and Cretaceous granitic intrusions (BGMR, 1991; Zeng et al. Reference Zeng, Liu, Qin and Zhang2010, Reference Zeng, Liu, Zhang, Chen and Zhang2011a ).
The Chehugou Mo deposit is located in the Chehugou granitic complex, which consists of monzogranite, syenogranite, syenogranite porphyry and granite porphyry, with an outcrop area of 30 km2. Mafic enclaves commonly occur throughout the monzogranite and syenogranite. The syenogranite porphyry intrudes into the syenogranite and monzogranite. The granite porphyry occurs as a stock and intrudes into the monzogranite and syenogranite (Fig. 2).
Simplified geological map of the Chehugou Mo deposit (modified from No. 243 Team, unpub. survey report of the Chehugou Mo deposit, 2007).

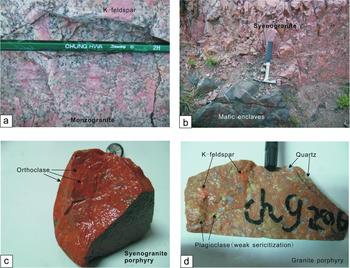
The monzogranite is typically porphyritic, with megacrysts of K-feldspar (up to 5 cm in length) and subordinate plagioclase (up to 3 cm in length), which commonly represent ~ 15% of the rock. K-feldspar is generally perthitic (Fig. 3a). Plagioclase is generally automorphic and subhedral, and is twinned. The matrix mineral assemblage includes perthite (40%), plagioclase (30%), quartz (25%) and biotite (5%), with or without minor hornblende. Accessory minerals include apatite, zircon, titanite and magnetite.
Photographs of major intrusive rocks in the Chehugou area. (a) Monzogranite; (b) syenogranite (containing mafic enclave); (c) syenogranite porphyry; (d) granite porphyry.

The syenogranite is fine grained (Fig. 3b) and consists of 50–55% alkali feldspar, 20–30% plagioclase, 20–30% quartz and minor (<1%) biotite. Accessory minerals include magnetite, zircon and apatite.
The syenogranite porphyry is typically porphyritic, with crystals of orthoclase, which commonly represent ~ 5–15% of the rock (Fig. 3c). The matrix mineral assemblage includes quartz, orthoclase, plagioclase and biotite. Accessory minerals include magnetite, zircon and apatite.
The granite porphyry is typically porphyritic, with crystals of quartz, plagioclase and K-feldspar, which commonly represent 20% of the rock (Fig. 3d). The matrix mineral assemblage includes quartz, K-feldspar and plagioclase, with minor biotite. Accessory minerals include magnetite, zircon and apatite. Silicification and kaolinization are developed in the granite porphyry stock.
The major intrusive rocks in the ore area were sampled and analysed to determine the timing of the magma intrusive activities, the sources of metals and to infer the ore-forming tectonic environment.
3. Analytical methods
Samples were crushed into granules less than 200 mesh and then analysed for major and trace elements and isotopes. The samples were analysed at the State Key Laboratory of Lithospheric Evolution, Institute of Geology and Geophysics, Chinese Academy of Sciences. Major elements were determined by X-ray fluorescence (XRF), with analytical uncertainties ranging from 1 to 3%. Trace element (including rare earth element; REE) concentrations were determined by inductively coupled plasma mass spectrometry (ICP-MS) with an ELEMENT system. According to Chinese national standards GSR-1 and GSR-2, the error was <5% for trace elements with concentrations >10 ppm and <10% for trace elements with contents <10 ppm (Gao et al. Reference Gao, Liu, Yuan, Hattendorf, Gunther, Chen and Hu2002).
Rb, Sr, Sm and Nd isotopes were analysed using a MAT-262 thermal ionization mass spectrometer (TIMS). The detailed analytical procedures are described by Chen, Hegner & Todt (Reference Chen, Hegner and Todt2000) and Chen et al. (Reference Chen, Siebel, Satir, Terzioglu and Saka2002). About 100 mg of a whole-rock powder sample were weighed, and then appropriate amounts of 87Rb–84Rb and 149Sm–150Nd mixed diluent and purified HF–HClO4 mixed acid were added so as to fully dissolve the sample at a high temperature. Separation and purification were carried out in a quartz exchange column filled with 5 ml of AG 50W-X12 exchange resin (200–400 mesh) for Rb and Sr, and in a quartz exchange column with 1.7 ml of Teflon powder as the exchange medium for Sm and Nd. Isotope ratios of 146Nd/144Nd = 0.7219 and 86Sr/85Sr = 0.1194 were adopted for correction of obtained Nd and Sr isotope ratios, respectively. The results of standard samples BCR and NBS987 were 143Nd/144Nd = 0.512630 ± 7 (n = 45) and 87Sr/86Sr = 0.710221 ± 4 (n = 100), respectively. The blanks were about 100 pg for Rb and Sr and about 50 pg for Sm and Nd, respectively. The errors on 147Sm/144Nd and 87Rb/86Sr were less than 0.5%.
The Pb isotopes were analysed using a MAT-262 TIMS. HF acid was used to dissolve the sample, and the sample solution was dried by evaporation. A 6N HCl solution was employed to convert the fluorinated sample into chloride, which was dried by evaporation, and then 0.6N HBr was used for sample extraction. Flows of 0.6N HBr and 6N HCl were adopted to separate and purify the Pb sample in a Teflon exchange column filled with 80 μl of AGl-X8 (100–200 mesh) exchange resin. The result for the Pb standard sample NBS981 was 207Pb/206Pb = 0.9138 (n = 37), and the whole-flow background for Pb was less than 50 pg (Chen, Hegner & Todt, Reference Chen, Hegner and Todt2000; Chen et al. Reference Chen, Siebel, Satir, Terzioglu and Saka2002).
The U–Th–Pb isotopic analysis of zircon for the granite porphyry and syenogranite porphyry was carried out with a sensitive high-resolution ion microprobe (SHRIMP) II instrument at the Beijing SHRIMP Centre. Standard zircon TEMORA 1 (417 Ma, Black et al. Reference Black, Kamo, Aleiikof, Davis, Korsch and Foudoulis2003) was used to correct 206Pb/238U, and SL13 (with a U content of 238 ppm and average Th/U = 0.09, Black et al. Reference Black, Kamo, Aleiikof, Davis, Korsch and Foudoulis2003) was used to standardize the U and Th contents in samples; data processing was conducted using SQUID1.0 and Isoplot 3.2 (Ludwig, Reference Ludwig2001). For the detailed test principles and analysis and data-processing flows, see Song, Zhang & Wan (Reference Song, Zhang and Wan2002). The measured 204Pb was used to correct the common Pb content in zircon, and the single-point analysis errors were at the 1σ level; the result was the average 206Pb–238U age with a confidence of 95%.
The U–Th–Pb isotope analysis of zircon for the monzonitic granite and syenogranite was conducted with a Cameca IMS-1280 ion microprobe at the Institute of Geology and Geophysics, Chinese Academy of Sciences. U–Th–Pb isotope ratios were obtained through correction with standard zircon Plesovice (Sláma et al. Reference Sláma, Koler, Condon, Crowley, Gerdes, Hanchar, Horstwood, Morris, Nasdala, Norberg, Schaltegger, Schoene, Tubrett and Whitehouse2008). The U and Th contents were obtained through correction with standard zircon 91500 (Li et al. Reference Li, Liu, Li, Guo and Chamberlain2009). For the detailed test flow and data-processing method, see Li et al. (Reference Li, Liu, Li, Guo and Chamberlain2009) and Stacey & Kramers (Reference Stacey and Kramers1975). The measured 204Pb value was used for correction of common Pb content. Because the common Pb content was very low, it could be thought that the common Pb was mainly from surface Pb contamination during sample preparation, and the average Pb isotope composition in the modern crust was used as the common Pb composition for correction. The single-point analysis error for the isotope ratio and age was reported at the 1σ level. Isoplot application software was employed for data processing (Ludwig, Reference Ludwig2001).
4. Geochronology
The cathodoluminescence (CL) imaging of zircon was completed at the Electron Microprobe Laboratory, Institute of Geology and Geophysics, Chinese Academy of Sciences (samples B14 and B231) and at the Beijing SHRIMP Centre (samples C270 and C134). All zircon grains have oscillating zones (Fig. 4), indicating a magmatic origin. The U–Pb isotopic data for the zircons are listed in Table 1 and shown in Figure 5. The errors of weighted mean ages are 2σ.
Cathodoluminescence (CL) images of zircons for Chehugou granitoids. (a) Porphyritic granite (B231); (b) fine granite (B14); (c) syenogranite (C270); (d) granite porphyry (C134).

Zircon U–Pb SIMS and SHRIMP data for the Chehugou granitic complex intrusive rocks

% 206Pbc denotes the percentage of 206Pb that is common Pb.
1 Common Pb corrected using measured 204Pb.
2 Common Pb corrected by assuming 206Pb/238U–207Pb/235U age-concordance.
3 Common Pb corrected by assuming 206Pb/238U–208Pb/232Th age-concordance.
* Zeng et al. (Reference Zeng, Liu, Zhang, Chen and Zhang2011a ).
U–Pb zircon Concordia plots.

Zircon grains from the porphyritic monzogranite (B231) in the deposit area (Table 1) have U and Th contents of 85–886 ppm and 87–971 ppm, with Th/U ratios of 0.29–1.1, possibly indicating a magmatic origin. The common Pb was low in all of the ten analyses. Two grains out of the ten analyses have ancient ages (2488 and 2473 Ma), indicating an inherited origin. The other eight zircon grains are concordant with a weighted mean 206Pb–238U age of 384.7 ± 4.0 Ma (MSWD = 0.10). The age is interpreted to be the crystallization age of the porphyritic monzogranite.
Zircon grains from the syenogranite (B14) have U and Th contents of 82–609 ppm and Th = 14–1752 ppm, with Th/U ratios of 0.1–2.88. The common Pb content was low at all of the 12 analysis points. Three zircon grains out of the 12 analyses have ancient ages of 2335–2560 Ma, indicating an inherited origin. The other nine grains are concordant and yield a weighted mean 206Pb–238U age of 373.1 ± 5.9 Ma (MSWD = 1.4), indicating the emplacement age of the syenogranite.
Zircon grains from the syenogranite porphyry (C270) have U and Th contents of 187–552 ppm and 172–637 ppm, with Th/U ratios of 0.67–1.59. Thirteen analysis have an age range of 253.9 ± 6.2 to 275.7 ± 6.6 Ma, and give a weighted mean 206Pb–238U age of 265.6 ± 3.5 Ma (MSWD = 1.02). The mean age is interpreted as the time of crystallization of the syenogranite porphyry.
Zircon grains from the granite porphyry (C134) have U and Th concentrations of 144–758 ppm and 67–610 ppm, with Th/U ratios of 0.38–1.33, indicating a magmatic origin. Twelve analyses give ages between 237.7 ± 5.9 and 256.4 ± 6.0 Ma. They plot on or near the concordia curve with a weighted mean 206Pb–238U age of 245.1 ± 4.4 Ma (MSWD = 1.4), indicating the crystallization age of the granite porphyry.
5. Geochemistry and Sr–Nd–Pb isotopic compositions
5.a. Major and trace elements
Major and trace element data for 11 rock samples, including two Devonian granite samples, three Permian syenogranite porphyry samples and six Triassic granite porphyry samples, from the Chehugou granitic complex are listed in Table 2.
Major (wt%), rare earth and trace element (ppm) data for the Chehugou granitic complex intrusion

A/CNK – Al/(Ca+Na+K) molar; A/NK – Al/(Na+K) molar; LOI – loss on ignition.
The two Devonian granite samples have SiO2 contents of 68.5–74.6 wt% and Al2O3 contents of 13.3–16.2 wt%, with K2O/Na2O ratios of 0.44–0.52. They are metaluminous to weakly peraluminous with A/CNK of 0.95–1.04 and belong to the calc-alkaline series of granitic rocks (Fig. 6a, b). Three Permian syenogranite porphyry samples have SiO2 contents of 70.7–71.6 wt%, Al2O3 contents of 14.4–14.9 wt%, K2O/Na2O ratios of 1.13–1.25 and are alkali-calcic. Six Triassic granite porphyry samples have SiO2 contents of 70.3–74.0 wt%, Al2O3 contents of 13.3–15.1 wt% and K2O/Na2O ratios of 0.78–1.63. They belong to the calc-alkaline and alkali-calcic series of rocks (Fig. 6a). The Permian and Triassic granitoids are metaluminous to weakly peraluminous with A/CNK ratios of 0.96–1.10 (Fig. 6b).
(a) Diagram of Na2O + K2O − CaO versus SiO2 (after Frost et al. 1976); (b) Diagram of A/NK versus A/CNK.

The Devonian, Permian and Triassic granitoids are enriched in light REEs (LREEs) and depleted in heavy REEs (HREEs) (i.e. Yb = 0.27–0.48), with (La/Yb)CN values of 24–83. In the chondrite-normalized REE diagram (Fig. 7), they all show concave-up REE patterns with differentiation of light–heavy REEs without Eu anomalies, similar to those in the Archaean tonalite–trondhjemite–granodiorite (TTG) suite (Condie, Reference Condie1993). They have Eu/Eu* values of 0.9–1.2, 0.9–1.2 and 1.0–1.3 for the Devonian, Permian and Triassic granitoids, respectively.
Chondrite-normalized REE patterns of the Chehugou granitic complex intrusion (normalization values after Boynton, Reference Boynton and Henderson1984).

The Devonian, Permian and Triassic granitoids have high Sr contents of 189–1256 ppm and low Y concentrations of 3.87–5.43 ppm, with Sr/Y ratios of 59–281. They are enriched in large-ion lithophile elements (LILEs), such as Rb, Sr, K and Th, and depleted in high-field-strength elements (HFSEs), such as Nb and Ta. In the primitive mantle-normalized trace element diagram (Fig. 8), they have strongly negative Nb and Ta anomalies and with generally positive Sr anomalies.
Primitive mantle-normalized trace elements web diagram of the Chehugou granitic complex intrusion (normalization values after Taylor & McLennan, Reference Taylor and McLennan1985).

5.b. Sr–Nd–Pb isotopes
The Rb–Sr, Sm–Nd and Pb isotopic compositions of the Chehugou granitic complex are listed in Tables 3 and 4 and shown in Figures 9 and 10. The Devonian granites have relatively high initial 87Sr/86Sr ratios (0.7100–0.7126), and relatively homogeneous 143Nd/144Nd ratios (0.51166–0.51167), with ɛNd(t) values of −12.3 to −12.4. They have 206Pb/204Pb, 207Pb/204Pb and 208Pb/204Pb ratios of 16.46–17.50, 15.32–15.46 and 37.61–38.40, respectively.
The Sr–Nd isotopic data for the Chehugou granitic complex intrusive rocks

TGP – Triassic granite porphyry; PSP – Permian syenogranite porphyry; DG – Devonian granite.
Whole-rock Pb isotope data for the granitoids and mafic rocks in the Chehugou ore area

Diagram of initial Sr versus ɛNd(t) of the Chehugou granitic complex intrusion. Depleted mantle (DM), mid-ocean ridge basalt (MORB), ocean island basalt (OIB), primitive mantle (PM) and enriched mantle (EM) are defined by Hart (Reference Hart1984) and Zindler & Hart (Reference Zindler and Hart1986). Precambrian basement is from Wu et al. (Reference Wu, Yang, Wilde and Zhang2005).

Diagram of Pb isotopic composition of the Chehugou wall rock Pb on the growth curves of Zartman & Doe (Reference Zartman and Doe1981). Data for Precambrian basement are from Chen et al. (Reference Chen, Zhang, Liu, Wang, Xu and Zheng1994) and Li & Wang (Reference Li and Wang1995).

The Permian and Triassic granites have relatively low initial 87Sr/86Sr ratios (0.7048–0.7074), and heterogeneous 143Nd/144Nd ratios (0.51165–0.51180), with ɛNd(t) values of −13.1 to −10.1. They have 206Pb/204Pb, 207Pb/204Pb and 208Pb/204Pb ratios of 17.23–17.51, 15.32–15.51 and 37.87–38.41, respectively.
The Chehugou granitoids have similar Sr–Nd isotopic compositions to the basement rocks of the NCC (Jahn et al. Reference Jahn, Wu, Lo and Tsai1999) but are distinct from the Phanerozoic granites in the Central Asia Orogenic Belt (Wu, Sun & Lin, Reference Wu, Sun and Lin1999; Hong et al. Reference Hong, Wang, Xie and Zhang2000, Reference Hong, Wang, Xie, Zhang and Wang2003). Furthermore, they have similar Pb isotopic compositions to the host mafic rocks in the deposit, which have 206Pb/204Pb, 207Pb/204Pb and 208Pb/204Pb ratios of 17.44, 15.50 and 38.36, respectively.
6. Discussion
6.a. Petrogenesis of the Chehugou granitoids
The Chehugou granitoids are characterized by relatively high silica and alkaline contents and low FeO and MgO concentrations. They are calc-alkaline and alkali-calcic (Fig. 6a). They are enriched in LILEs, such as Rb, K, U and Th, and depleted in HFSEs, such as Nb, Ta, Ti and P. They have relatively high initial 87Sr/86Sr ratios of 0.7048–0.7126 and strongly negative ɛNd(t) (−10.1 to −13.1). Their ancient Nd model ages (1.5−2.69 Ga) (Table 3) are similar to the ages of the Palaeoproterozoic rocks in the northern NCC (Yang, et al. Reference Yang, Chung, Wilde, Wu, Chu, Lo and Fan2005; Zhang et al. Reference Zhang, Liu, Zhao, Yang, Song and Liu2007). All these geochemical features indicate that they were derived from partial melting of an ancient crustal source.
The Chehugou granitoids have relatively high Sr and Ba contents and low Y and Yb concentrations with high Sr/Y ratios. In the Sr/Y v. Y diagrams (Fig. 11), they plot in the field of adakites and TTG, far from the field of typical arc magmas. Furthermore, they have relatively high LREE concentrations and are depleted in HREEs, with (La/Yb)CN values of 24–83. All these geochemical features are similar to those of TTG/adakite and Na-rich granitoids in the world (e.g. Defant & Drummond, Reference Defant and Drummond1990; Atherton & Petford, Reference Atherton and Petford1993; Martin, Reference Martin1999), which were suggested to be derived from partial melting of subducted oceanic crust or newly underplated lower crust under garnet stability conditions (e.g. Defant & Drummond, Reference Defant and Drummond1990; Atherton & Petford, Reference Atherton and Petford1993; Martin, Reference Martin1999). Therefore, the Chehugou granites were derived from partial melting of ancient crustal materials at depth with garnet in stability, and with a plagioclase-poor and garnet-rich residual assemblage (Atherton & Petford, Reference Atherton and Petford1993; Patino Douce, Reference Patino Douce, Castro, Fernández and Vignersse1999).
Sr/Y versus Y diagram for granitoids in Chehugou ore area.

However, they have variable Nd isotopic compositions, indicating crustal assimilation and/or a mantle material addition process. The occurrence of ancient zircons in the dated samples possibly indicates a crustal assimilation of the parental magmas of the Chehugou granitoids. However, the Chehugou granites contain plenty of microgranular enclaves. They mostly range from angular to oval in shape, but locally form dyke-like trails that progressively thin toward their terminations with the host granitoid. They range in composition from diorite to quartz diorite. Igneous textures include oscillatory-zoned plagioclase, local quartz and K-feldspar megacrysts and some myrmekitic intergrowths between plagioclase and alkali feldspar, identical to textures described from mafic enclaves around the world (Eichelberger Reference Eichelberger1980; Vernon, Reference Vernon1984; Holden et al. Reference Holden, Halliday and Stephens1987; Vernon et al. Reference Vernon and Flood1988; Didier & Barbarin, Reference Didier and Barbarin1991; Yang et al. Reference Yang, Wu, Chung, Wilde and Chu2004), indicating a magma mixing process in the origin of the Chehugou granites. Moreover, the mafic enclaves and host granites have similar Pb isotopic compositions, and plot between the lower crust and mantle lines of the 207Pb/204Pb v. 206Pb/204Pb diagram of Zartman & Doe (Reference Zartman and Doe1981) (Fig. 10), indicating at least two components (lower crust and mantle) involved in the origin of the Chehugou granitoids.
Therefore, the whole-rock geochemical features and Sr–Nd–Pb isotopic compositions indicate that the Chehugou granitoids were mainly derived from partial melting of ancient crustal materials with garnet in the residues at high pressures, with crustal assimilation. Mafic enclaves can be considered to represent remnants of a mafic component added to intermediate to felsic magma chambers, indicating that the mantle-derived magmas provide heat and materials in the origin of the Chehugou granitoids.
6.b. Genetic relationship between the granites and Mo mineralization
It is well accepted that porphyry Cu and Cu–Mo deposits have genetic relationships with the petrogenesis of porphyritic granites. Porphyry Cu and Cu–Mo deposits are associated with intermediate to felsic, calc-alkaline intrusive rocks that range from granodiorite to granite in composition (60−72 wt% SiO2) (Kesler, Jones & Walker, Reference Kesler, Jones and Walker1975; Titley & Beane, Reference Titley, Beane and Skinner1981). Porphyry Mo deposits, in comparison, are typically associated with felsic, high-silica (72−77 wt% SiO2) and, in many cases, strongly differentiated granitic plutons (Mutschler et al. Reference Mutschler, Wright, Ludington and Abbott1981; White et al. Reference White, Bookstrom, Kamilli, Ganster, Smith, Ranta, Steininger and Skinner1981; Kooiman, McLeod & Sinclair, Reference Kooiman, McLeod and Sinclair1986). Subduction-related calc-alkaline rocks are related to the Endako-type Mo deposit (or arc-type), and alkaline rocks are related to the Climax-type Mo deposit (rift-type) (Sillitoe, Reference Sillitoe1980; Carten, White & Stein, Reference Carten, White, Stein, Kirkham, Sinclair, Thorpe and Duke1993). Subduction-related Chehugou granitoids belong to the calc-alkaline and alkali-calcic series of rocks, so it is favourable to form Endako-type Mo deposits (granitic porphyry Mo deposits) in the Chehugou complex.
In the Chehugou area, field observations show that the Mo orebodies spatially occur within the granite porphyry (Fig. 2). The Mo mineralization at Chehugou is predominantly localized in the Triassic granite porphyry stock. Stockwork and breccia mineralizations are recognized in the ore area. Stockwork veins (0.2 to 2 cm wide) include quartz, quartz-sulphide and sulphide veins that have narrow sericite envelopes. The stockwork mineralization is characterized by dissemination and veinlets of pyrite, molybdenite and chalcopyrite. Breccia mineralization occurs within a steep cryptoexplosive breccia pipe. Hydrothermally cemented breccias are spatially associated with higher ore grades than nearby veinlet-related mineralization. Ore minerals form part of the cement in these breccias. Widespread kaolinization, approximately round in shape in plan view, is recognized at Chehugou (Zeng et al. Reference Zeng, Liu, Zhang, Zhang, Chu, Zhang, Wang and Duan2011b ). The sericitization and silicification zone, associated with the stockwork and breccia ores, is under the kaolinization zone. Chehugou Mo deposits can be classified as granitic porphyry Mo deposits according to the classification scheme (Seedorff et al. Reference Seedorff, Dilles, Proffett, Einaudi, Hedenquist, Thompson, Goldfarb and Richards2005). Comparing the well-known Endako Mo deposit in British Columbia, Canada (Selby et al. Reference Selby, Nesbitt, Muehlenbachs and Prochaska2000) with the Chehugou Mo deposit, we found that the Endako and Chehugou Mo deposits belong to the same deposit type, but there are interesting differences between them. For example, three episodes of mineralization are related to three episodes of granitoid intrusion in the Endako deposit, but Mo mineralization in the Chehugou deposit is related to the last granite porphyry intrusion.
The excellent correlation between the Re–Os date from molybdenite and the ages of the granite porphyry from the area indicate a direct genetic relationship between the granite porphyry intrusion and Mo mineralization. The Re−Os isochron age for molybdenite is 245 ± 5 Ma (Zeng et al. Reference Zeng, Liu, Zhang, Chen and Zhang2011a ), and the zircon U−Pb age of the granite porphyry is 245.1 ± 4.4 Ma. δ34S values of sulphide from the Chehugou deposit range from −0.61‰ to 0.86‰ (Zeng et al. Reference Zeng, Liu, Zhang, Zhang, Chu, Zhang, Wang and Duan2011b ). The δ34S values of sulphide are similar to the δ34S values of typical magmatic sulphide sulphur (Ohmoto, Reference Ohmoto, Valley, Taylor and O'Neil1986), suggesting that the ore-forming materials are magmatic in origin. Geochemical features suggest that the Devonian, Permian and Triassic Chehugou granitoids were mainly derived from partial melting of ancient crustal materials with garnet in the residues at high pressures, with minor involvement of a mantle component and crustal assimilation. Therefore, we infer that the Mo is derived from the ancient crustal rocks and that the minor Cu is derived from the mantle. This result is consistent with the study of the source region of metals in porphyry deposits (Candela & Piccoli, Reference Candela, Piccoli, Hedenquist, Thompson, Goldfarb and Richards2005; Seedorff et al. Reference Seedorff, Dilles, Proffett, Einaudi, Hedenquist, Thompson, Goldfarb and Richards2005).
The monzogranite, syenogranite and syenogranite porphyry in the Chehugou deposit have crystallization ages of 373.1 ± 5.9 Ma, 384.7 ± 4.0 Ma and 265.6 ± 3.5 Ma, respectively. Furthermore, the Devonian granites have distinct initial 87Sr/86Sr ratios from the Permian and Triassic granitoids in the Chehugou granitic batholith, indicating a different source. Although the Mo deposits are hosted by granitoids, there is no genetic relationship between the Mo mineralization and the Devonian and Permian granites in the Chehugou deposit.
6.c. Tectonic implications
The northern margin of the NCC and southern margin of the Siberian Craton underwent Andean-type magmatism in Late Palaeozoic time. The presence of both northward- and southward-facing active continental margins in Permian time suggests that the Palaeo-Asian Ocean closed at this time by subduction in two directions (Xiao et al. Reference Xiao, Windley, Hao and Zhai2003). Many studies show that the collision between the Siberian plate and the North China plate ceased at the end of the Permian period (Dobretsov, Berzin & Buslov, Reference Dobretsov, Berzin and Buslov1995; Windley et al. Reference Windley, Kroner, Guo, Qu, Li and Zhang2002; Xiao et al. Reference Xiao, Windley, Hao and Zhai2003; Wu et al. Reference Wu, Zhao, Sun, Wilde and Yang2007). The emplacement age (244 Ma) of the Hegenshan ophiolite (Miao et al. Reference Miao, Fan, Liu, Zhang, Shi and Guo2008), a series of post-collision granites (Shi et al. Reference Shi, Miao, Zhang, Jian, Fan and Liu2004), mafic–ultramafic rocks (Wu et al. Reference Wu, Wilde, Zhang and Sun2004), the Permian radiolarians (Shang, Reference Shang2004) and a syncollision granite (248 Ma) (Wu et al. Reference Wu, Zhao, Sun, Wilde and Yang2007) indicate that the tectonic setting of the northern margin of NCC is a syncollision setting in Early Triassic time.
The Chehugou granitoids have strongly negative ɛNd(t) values (−13.14 to −10.14), distinct from those of Phanerozoic granites in the Central Asian Orogenic Belt (−2.2 to +7.1; Wu, Sun & Lin, Reference Wu, Sun and Lin1999; Hong et al. Reference Hong, Wang, Xie and Zhang2000) on the northern side of the deposit area, but similar to those of Phanerozoic granites in the northern NCC (Zhang et al. Reference Zhang, Liu, Zhao, Yang, Song and Liu2007), indicating that the Chehugou deposit is likely located in the northern NCC.
The Chehugou granitic complex mainly consists of monzogranite, syenogranite, syenogranite porphyry and granite porphyry. The geochemical features of the granitoids indicate that the Devonian granite belongs to the calc-alkaline rock series, the Permian syenogranite porphyry belongs to the alkali-calcic rock series and the Triassic granite porphyry belongs to the calc-alkaline and alkali-calcic rock series. The calc-alkaline rocks are generally formed in subduction zones related to arc-continent or continental collision (Barbarin, Reference Barbarin1999). So, the Chehugou granitoids were formed in a subduction zone related to arc-continent or continental collision between the North China and Siberian plates. The Devonian granites are sodic with relatively low K2O/Na2O ratios, similar to the geochemical features of continental arc magmatism and may be formed within a subduction zone and related to the closure of the Palaeo-Asian Ocean. The Permian and Triassic granitoids have geochemical features of syn- or post-orogenic magmatism (Batchelor & Bowden, Reference Batchelor and Bowden1985). The trace element spider diagram shows enrichment in LILEs, impoverishment in HFSEs and depletions of Nb, Ta, P and Ti, all indicative of the trace element features of postcollision calc-alkaline and alkali-calcic I-type granite (Kuster & Harms, Reference Kuster and Harms1998; Xiao, Deng & Ma, Reference Xiao, Deng and Ma2002). The data suggest that all of the granitoids of the Chehugou batholith, regardless of age, were formed within a compressional tectonic setting. The formation of the granitic rocks is likely related to subduction of the Palaeo-Asian Ocean and subsequent collision between the Siberian and North China blocks.
The Devonian (384–373 Ma) granite reflects the southward subduction of the Palaeo-Asian Ocean plate, whereas the Permian (265 Ma) syenogranite porphyry and Triassic (245 Ma) granite porphyry indicate that the Palaeo-Asian Ocean was closed during the Late Permian period, and subsequent continent–continent collision occurred after the closure of the Palaeo-Asian Ocean during the Early Triassic period. Therefore, the Devonian, Permian and Triassic granites on the northern margin of the NCC were formed by partial melting of the North China Block during the period of subduction and continental collision between the North China and Siberian plates (Fig. 12a, b).
Schematic cartoons showing the Devonian to Triassic evolution of the northern margin of North China Craton (modified from Xiao et al. Reference Xiao, Windley, Hao and Zhai2003). (a) Devonian–Early Permian: two-way subduction of Palaeo-Asian Ocean plate; (b) Late Permian–Early Triassic: syncollision-related porphyritic stocks and formation of porphyry-related Mo mineralization.

7. Conclusions
(1) The Chehugou granitic complex is composed of monzogranite, syenogranite, syenogranite porphyry and granite porphyry, with the former two belonging to a calc-alkaline rock series, the syenogranite porphyry belonging to the alkali-calcic rock series and the granite porphyry belonging to the calc-alkaline and alkali-calcic rock series.
(2) The granitoids yield SIMS U–Pb zircon ages of 384.7 ± 4.0 Ma for the monzogranite and 373.1 ± 5.9 Ma for the syenogranite, and the SHRIMP U–Pb zircon ages are 265.6 ± 3.5 Ma for the syenogranite porphyry and 245.1 ± 4.4 Ma for the granite porphyry; the metallogenesis relates to the Triassic granite porphyry.
(3) The Devonian to Triassic granite on the northern margin of the NCC was formed by partial melting of the North China Block during the period of subduction and continental collision between the North China and Siberian plates.
Acknowledgements
We sincerely thank the following organizations and people for their support and help: Chifeng Chehugou Molybdenum Mine, which greatly supported our field work; Dr Liu Jianhui from the Ion Microprobe Centre, Institute of Geology, Chinese Academy of Geological Sciences, who helped us with the SHRIMP U–Pb zircon dating test; senior engineer Li He from the Rock and Mineral Analysis Laboratory, Institute of Geology and Geophysics, Chinese Academy of Sciences, who helped with our major element analysis of rocks; researcher Jin Xindi from the Trace Element Analysis Laboratory, Institute of Geology and Geophysics, Chinese Academy of Sciences, who helped us with the trace and rare earth element analysis of the rocks; and Dr Chu Zhuoyin from the Laboratory for Radiogenic Isotope Geochemistry, Institute of Geology and Geophysics, Chinese Academy of Sciences, who provided help with our Pb isotope analysis. We thank J. Gregory Shellnutt, Zhu Laimin, Clive Rice and an anonymous reviewer for their detailed comments. We specially thank Dr Phil Leat, journal editor, for his constructive comments and help. This work was financially supported by the National Natural Science Foundation of China (No. 40972065) and the Special Study Programme of the Continuous Resources of Crisis Mine of China (No. 20089931).