In a recent article published in this journal, Yaojiang Shi and John Kennedy suggest that China's missing girls problem is much more a statistical artefact than previously known. According to their analysis, unreported female births, or hidden girls, account for 73 per cent of the 15 million missing girls from the 1990–2010 birth cohorts in the 2010 census.Footnote 1 Their conclusion is based in part on their fieldwork, but the numerical estimate is grounded on their understanding and analyses of Chinese census data. While the insights from their fieldwork – that China's political system leaves ample room for data manipulation and delayed registration – cannot be faulted, Shi and Kennedy's analyses of Chinese census data are questionable and their conclusion is in contradiction with the “missing girls” shown in other data sources. In this short note, I present three lines of evidence to challenge Shi and Kennedy's conclusion: one from the censuses, one from official education statistics, and one from survey data. For the sake of clarity, I use two terms to describe missing girls: nominal missing – the number of missing girls as revealed by population statistics, and truly missing – the number of missing girls excluding those hidden (unreported) girls.Footnote 2 My conclusion backs the conventional wisdom about the missing girls phenomenon in China: the elevated sex ratios in Chinese population, or “missing girls,” is not a statistical artefact, but a real social challenge that China has to face for now and for the foreseeable future.
There are several obvious oversights in Shi and Kennedy's numeric analysis of missing girls for the 1990–2010 birth cohorts. First, their analysis (e.g. Tables 1 and 5) does not include military personnel, who are counted separately in the Chinese censuses. Like most other countries in the world, China's 2.3 million People's Liberation Army (PLA) personnel in 2010 were predominantly young men: 79 per cent were between ages 18 and 30, and with a sex ratio of 2247:100 (males to females). Including the 2.3 million PLA in the population count alone could add almost 2 million to the estimate of China's “missing girls,” although only about half a million would be in the 1990–2010 birth cohorts, i.e. the total number of missing females in Shi and Kennedy's Table 1 would be 14.2 million instead of 13.7 million. Second, Shi and Kennedy apparently do not appreciate the difference between sex ratio at birth (SRB) and sex ratio at different ages. Under normal circumstances, females have some advantages over males in mortality, thus there is a gradual decline of sex ratio with age. Shi and Kennedy's Table 1 clearly does not take this factor into account: the ratio of column “Male” and “Expected at 105 SRB” is always 105, indicating the number of expected females is calculated assuming a constant sex ratio of 105 across all ages, not a constant sex ratio of 105 only at birth. Appropriate adjustment of the expected sex ratio at each age could increase the estimate of the number of missing girls in the 1990–2010 cohorts by 1.5 million. Third, Shi and Kennedy's estimate of “about 15 million missing girls from 1990 to 2010”Footnote 3 constitutes a double counting: the 13.7 million directly derived from the census data (i.e. nominal missing) already include the 700,000 presumed underreported due to adoption and the one million due to elevated female death rates.
Shi and Kennedy's article appears to take the 2010 census at face value without providing a critical review of its data quality.Footnote 4 Such an approach is illogical given the main support for their claim that China's missing girls are data artefacts resulting from under-enumeration of girls in the 1990 and 2000 censuses. If the earlier censuses were faulty, why should one trust the quality of the 2010 census?
China's 2010 census is far from perfect. Not only does it come with some familiar problems as seen in the previous censuses, such as undercounting of births and mortality, it also comes with its own unique problems.Footnote 5 Partly as a response to the under-enumeration of migrants in the 2000 census, the 2010 census adopted a new counting scheme: the census recorded everyone both at place of hukou registration and at place of current residence, and then applied a computer algorithm to determine where s/he should be enumerated as a resident. Although this new scheme did reduce some under-enumeration, it created new problems, such as double-counting for cohorts born in the 1980s.Footnote 6 Given the well-known problems in China's censuses, caution is always needed when we use such data.
Shi and Kennedy's main support for their “hidden girls” argument is in their observation of the sex ratio for the 1990 birth cohort. It's worthwhile to have a careful examination of the relevant paragraph:
The sex ratio for 10-year-olds in 2000 is similar to the SRB in 1990 at 111. However, the sex ratio drops to 103 for 20-year-olds in 2010, with an additional 4.8 million undercounted births (i.e. late registration) and over 900,000 more females than males. The pattern and numbers are the same when we examine the different age groups, such as aged two years in 1990 and aged 22 years in 2010, with additional females ranging from 550,000 to 950,000 for each cohort. Moreover, life expectancy for males and females over the age of ten has been increasing during the 1980s and 1990s. If we consider a lower bound conservative estimate of 550,000 undercounted or additional females per year from 1990 to 2010, then there are possibly 11 million more females (or 16.5 million since 1980). This confirms the administrative bias hypothesis.Footnote 7
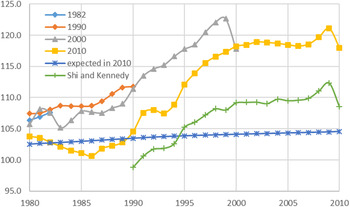
To provide context and easier interpretation, I re-present Shi and Kennedy's analysis in Figure 1, which compares sex ratio by birth cohort observed in the four recent Chinese censuses (1982, 1990, 2000, and 2010) and expected sex ratio in the 2010 census by assuming a sex ratio at birth at the normal level of 105 boys per 100 girls and sex neutral mortality schedules presented in Coale and Demeny's Model West life tables.Footnote 8 The data presented in Figure 1 include PLA population. Also included in Figure 1 is the expected sex ratio implied by Shi and Kennedy by adding 550,000 supposedly hidden girls back to each cohort – a naïve illustration of Shi and Kennedy's estimate.
Observed and Expected Sex Ratio by Birth Cohort in Chinese Censuses

As can be seen in Figure 1, there is indeed a major decline in the sex ratio between the 2000 census and 2010 census, and a similar gap exists for almost all the cohorts born between 1980 and 1999. However, the drop is apparently too deep for the cohorts born in the mid-1980s. Should those sex ratios be true, there would be a substantial number of “missing boys” in those cohorts, which is impossible – a strong indicator of data problems in the 2010 census. Moreover, there are no grounds to extrapolate the deduced number (550,000–950,000 per year) of “hidden girls” for the cohorts born in 1990–2000 to cohorts born after 2000 – not only because it is self-contradictory to the assumed good quality of the 2010 census, but also because it fails to take into account the declining birth cohort size in this period. The naïve illustration of expected sex ratio by Shi and Kennedy implies the existence of “missing boys” in the 1990–1995 birth cohorts – contradicting what we know about China.
Shi and Kennedy's estimate also contradicts the number of missing girls shown in the official education statistics. Shi and Kennedy argue that “it is possible that some of the missing girls were able to attend elementary school without registration, but then needed to be registered formally after the age of 12 in order to attend junior high school.”Footnote 9 If that were true, sex ratios of primary school students should be much closer to normal level.
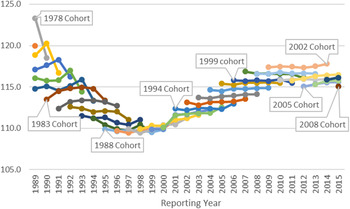
Using the enrolment data of primary school students from the annual publication of Educational Statistics Yearbook of China (1989–2015)Footnote 10 , Figure 2 shows the sex ratio by birth cohort (year), assuming a simple translation of grade vs age: grade 1 at age 7, grade 2 at age 8, etc.Footnote 11 Each cohort is counted up to six times as they progress through primary school from grade 1 to grade 6; and there is a great internal consistency across different years/grades. The data also confirm the Chinese government's reporting on the improvement of gender equality in primary education: the decline in the sex ratios of primary school students for cohorts born before 1988 is driven by the rise in female enrolment – China quickly closed the gender enrolment gap in the 1990s. By the late 1990s, China's primary enrolment rate is close to 100 per cent for both males and females.
Sex Ratio by Reporting Year and Birth Cohort in Primary Schools, China 1989–2015

Figure 2 reveals a similar time trend in sex ratio as that shown in Figure 1. The sex ratio of primary school students reaches nadir at around 110 for cohorts born around 1990. After that, the sex ratio of primary school students sees a continued increase, parallel to that shown in the demographic data (see Figure 1). It reaches a peak at sex ratio of 117 for the 2002 birth cohort, and then shows a possible level-off or even decline for the cohorts born after – there is a similar, although less pronounced, levelling off in sex ratio for cohorts born after 2002 as shown in the 2010 census.
Taking Figures 1 and 2 together, the education statistics support the existence of truly missing girls at least for cohorts born after 1988: the sex ratio stayed above 110, and reached 117 by 2002. A note of caution is necessary here. Just like birth statistics or economic statistics, there are some built-in incentives to manipulate enrolment data. Because enrolment numbers and rates, including female enrolment rates, are used for fiscal allocations and local government official evaluations, there is a tendency to inflate enrolment numbers/rates.Footnote 12 If government officials were to inflate female enrolment numbers/rates, the education statistics would provide a conservative estimate for truly missing girls.
If government statistics like population census or enrolment data are at risk of data manipulation for administrative or political reasons, surveys conducted by nongovernment entities could provide independent verification of the existence or the scale of missing girls. Taking family rosters from three recent large national surveys (China Family Panel Studies 2014, China General Social Survey 2013 and China Health and Nutrition Survey 2011) together, the observed sex ratio are 123.1, 117.6, 112.7 and 102.6, respectively for cohorts born in 2006–2010, 2001–2005, 1996–2000, and 1991–1995. These large sample surveys again confirm that the “missing girls” observed in the population data are more likely to be real than mostly statistical artefacts. Care is necessary when using survey data to calculate sex ratios. Sex ratio is highly sensitive to sample size – even the largest sample surveys do not provide large enough sizes to estimate sex ratio by age. Because surveys use complicated sampling designs based on target populations – often taken or derived from government statistics such as censuses – thus using sample weights defeats the purpose (of being independent), while not using sample weights risks overlooking sampling bias. Also, most surveys are household based, thus are more likely to miss people living in nonconventional household settings, such as migrants. Therefore surveys are not suitable to provide good estimates of the sex ratio beyond child age – as indicated by the very low sex ratio of 102.6 for cohort 1991–1995 in these three surveys.
To conclude, China's “missing girls” – one of the most glaring social and demographic abnormalities in the modern world – is real. While Shi and Kennedy's work reminds us that underreporting or “hidden girls” is an important component of China's missing girls phenomenon, we need to be careful that its contribution is not exaggerated. The underreporting problems in China's population data have been well known for decades. The very existence of data problems makes estimates of truly missing girls difficult, but not impossible. Many careful demographic analyses have shown that under-enumeration accounts for a substantial, but much smaller, proportion of missing girls than suggested by Shi and Kennedy's study.Footnote 13 The total number of truly missing girls in China from 1980 to 2010, after discounting for hidden girls, is likely to be in the 20-some million range, not the few million implied by Shi and Kennedy.Footnote 14 This estimate is more consistent with the “missing girls” observed in other data sources, such as household registration and educational enrolment statistics. Since the 2010 census, China's sex ratio at birth has levelled off, but has stayed above the normal level, thus the total number of missing girls has continued to rise, and could have reached 30 million by 2017. Given its scale and deep cultural roots, “missing girls” is one of the biggest challenges that China has to face now and for the foreseeable future.
Acknowledgement
I thank Martin Whyte, Wang Feng and William Lavely for their comments and suggestions, and Deborah Davis for her support. This research is supported by the National Science Foundation of China (71490734, 71461137003) and by Fudan University, China.
Biographical note
Yong Cai is associate professor in the department of sociology and fellow in the Carolina Population Center at the University of North Carolina at Chapel Hill, USA.