

The assumptions of the measurement model will influence the conclusions researchers draw both about the underlying theoretical concept of interest, as well as the empirical linkages between these concepts and other political phenomena.
Fariss et al. (Reference Fariss, Kenwick and Reuning2020, 366)Introduction
Religion has played a significant role in American politics since the founding period (Lambert Reference Lambert2008; Kosek Reference Kosek2017; Smidt et al. Reference Smidt, L and JL2017). Yet, for much of this history, the American party system resisted the particization of religious differences—First Amendment guarantees regarding the separation of Church and state and interfaith differences in theological and political beliefs mostly weakened attempts to tie religion to specific partisan expression (Harder Reference Harder2014). However, despite the failures of early manifestations of the Christian Right to institutionalize religious particularism within the Republican Party (Jelen Reference Jelen and Williams1997), the marriage of political and religious conservatism in the late 20th century has had profound effects on the party system (Layman Reference Layman1999; Mathew Reference Mathew2018), religious (Fea Reference Fea2018) and political behavior (Margolis Reference Margolis2018), and public opinion (Calfano and Djupe Reference Calfano and P2013). In fact, from gay marriage (Olson et al. Reference Olson, W and JT2006) to the provision of government services (Habel and Grant Reference Habel and Grant2013) and to foreign policy preferences (Baumgartner et al. Reference Baumgartner, Francia and Morris2008), there is hardly a matter of public opinion untouched by religious affiliation, practice, or belief.
In particular, one late development in the religious sorting of partisan preferences (Layman Reference Layman2001; Green Reference Green2007; Patrikios Reference Patrikios2008; Davis Reference Davis2018) involves the matter of “Christian nationalism”—a hybrid religious-political ideology that invokes mythological narratives about the United States' Christian heritage and calling (Whitehead and Perry Reference Whitehead and Perry2020; Gorski and Perry Reference Gorski and Perry2022). As a catch-all construct encompassing a brand of white, politically conservative religious belief, Christian nationalism has received enormous attention from lay pollsters (Pew Research Center 2021) and scholars alike. It predicts support for same-sex marriage (Whitehead and Perry Reference Whitehead and Perry2015), opposition to interracial marriage (Perry and Whitehead Reference Perry and Whitehead2015), pandemic-related behaviors (Perry et al. Reference Perry, Whitehead and Grubbs2020), support for police (Perry et al. Reference Perry, Whitehead and Davis2019) and gun laws (Whitehead et al. Reference Whitehead, Schnabel and Perry2018b), and, perhaps most noteworthy given the political context, casting a vote for Donald Trump (Whitehead et al. Reference Whitehead, Perry and Baker2018a).
The apparent predictive usefulness of this construct notwithstanding, little attention has been paid to how Christian nationalism is measured. Fitting a theoretical construct to a measurement model is never an easy task, but it is an essential one. This paper takes up that work to assess the construct and predictive validity of the most popular method of operationalizing Christian nationalism today. I begin by showing that the six items often used to construct an index of Christian nationalist belief fit awkwardly in one-dimensional space after factor rotation. Semi-supervised machine learning is then used to illustrate classification problems inherent with that traditional measurement approach; the continuous scale does a poor job identifying who is and is not a Christian nationalist. In turn, I investigate whether the Christian nationalism index performs well as an explanatory variable at the interval level—a basic psychometric requirement for unidimensional latent traits. I find that the Christian nationalism scale often exhibits a threshold rather than a linear relationship to political preferences, which seems to be a result of both measurement error and the sorting out of religious and political preferences more generally.
These results warrant two important recommendations for future research. First, the six-item, additive Christian nationalism scale deployed in much social science research as an explanatory variable is flawed and should be avoided. Measurement error is nontrivial, in part due to coding decisions about how to treat “missing” responses, but also because the scale is comprised of moving parts that do not readily collapse into a single latent trait. The result is that the intervals of the additive scale are too coarse to be interpretable and so bound up with partisanship that they often explain relatively little attitudinal variation among partisans across the scale's range of values. However, all is not lost. Instead, a more modest approach to modeling Christian nationalism involves using only those instruments from the six-item index that speak to whether the United States ought to be a Christian nation with Christian values (an approach I return to in the conclusion).
Second, by extension, more attention should be paid to the exact conceptual feature(s) of Christian nationalism that researchers desire to measure and analyze. Identity and instrumental beliefs are separable both theoretically and empirically (e.g., Ellis and Stimson Reference Ellis and Stimson2012), but Christian nationalism research seemingly mixes these features together haphazardly. The consequence is the creation of a Maslow's hammer, in which anything resembling conservative expressions of religious-political belief appears to be evidence of “Christian nationalism.” Yet, that approach flattens the various ways that religious identities and beliefs may move dynamically to shape social and political attitudes. Given that work on Christian nationalism has blossomed over the last decade, these issues are vital to producing empirically-informed scholarship that faithfully reveals how these attitudes work and why they are important.
What is Christian nationalism? A brief review
Although no serious historian would describe the birth of the United States as a predominantly, much less particularly Christian endeavor, the role of religion still looms large over both the founding period and American political development in the interim. Today, some 40 years after the Right's hard turn in the Evangelical-fueled culture wars (Lewis Reference Lewis2017), a curious, albeit revisionist narrative about the relationship between Christianity and American political heritage has developed and spread among the faithful. While the civil religion of the founders is widely accepted (Gorski Reference Gorski2010), in this telling of the country's origin myth, the U.S.' founding values of liberty and justice were rooted in its special relationship to the divine plan of the Christian god. In the Christian nationalist's worldview, the United States is not simply a land with religious freedom, where Christianity has flourished alongside other major faith traditions, but is, instead, a country with an especially Christian heritage, purpose, and calling (Whitehead and Perry Reference Whitehead and Perry2020).
While Christian nationalism draws from general theories of religious nationalism (e.g., Brubaker Reference Brubaker2011; Aho Reference Aho2013), it involves several particular features. First, it is more than just civil religion, instead blending religious particularism, victimization, and messianism together (Gorski Reference Gorski2020). Within the Christian nationalist's worldview, there is a persistent fear that America has not just strayed from its birthright as a Christian nation but that there are liberal forces conspiring to actively prevent government from embodying Christian values. Second, it also incorporates views about racial order and social hierarchies. Whiteness plays a role (Gorski and Perry Reference Gorski and Perry2022), as does gender, and its theological roots are less about morality or virtue and, instead, involve ideas about power and who should wield it.
In part, one reason why this “ideology” has proliferated among right-leaning religious believers in the United States involves the fact that Christian nationalism's appeals are generically pan-Christian. As Whitehead et al. (Reference Whitehead, Perry and Baker2018a, 151) write, “Christian nationalism, while more common among white conservative Protestants…provides a resilient and malleable set of symbols that is not beholden to any particular institution, affiliation, or moral tradition…This allows its influence to reach beyond the Christian traditions of its origins.” Christian nationalism emphasizes both a cultural purity (Perry and Whitehead Reference Perry and Whitehead2015) and an apocalyptic view of the future that cuts across denominational boundaries, warning that religious liberty, freedom, and institutions are under siege; and given the religious-political sorting of the mass public over the last several decades (Liebman and Wuthnow Reference Liebman and Wuthnow1983; Wuthnow Reference Wuthnow1995; Layman Reference Layman2001; Wald and Wilcox Reference Wald and Wilcox2006; Green Reference Green2007), this Christian nationalism has developed into a cornerstone element of the modern Republican Party (Whitehead and Perry Reference Whitehead and Perry2020; Pew Research Center 2021; Gorski and Perry Reference Gorski and Perry2022).
However, despite growing scholarly interest in this subject, an unexplored area of this research agenda involves the quality or complexity of Christian nationalism as an ideological worldview. While the empirical properties of political belief systems have been scrutinized dating back to Converse (Reference Converse1964/2006), little research has seriously investigated the psychometric properties of Christian nationalism to inquire whether its operationalization is both internally and externally valid. The remainder of this paper takes up this task and is devoted to exploring the measurement qualities of this religious-political ideology.
Data and measurement
The data used in the following analyses were drawn from both the 2007, Wave II and the 2017, Wave V Baylor Religion Surveys (BRS).Footnote 1 The surveys were administered by Gallup and funded by the John Templeton Foundation. Details corresponding to question wording and top-lines, as well as the data itself, are accessible from an online repository curated by the Association of Religious Data Archives (ARDA).Footnote 2
Christian nationalism has been measured in several different ways over time. Froese and Mencken (Reference Froese and FC2009), for example, investigate it by another name—“sacralization ideology”—which involves ideas about whether the government should advocate and defend Christian values, fund faith-based organizations, and allow religious symbols in public spaces and prayer in classrooms. Similarly, McDaniel et al. (Reference Mcdaniel, Nooruddin and Shortle2011) operationalize Christian nationalism as (dis)agreement with the ideas that America is special to God's plan, that he has chosen it to lead, that it was founded as a Christian nation and its heritage should be protected, and that its success is due to divine will. These multi-item indices stand in stark contrast to other, recent work by Davis and Perry (Reference Davis and Perry2021), who treat agreement with the statement “Christian identity is an essential marker of what it means to be a true American” as Christian nationalism. While these measurement approaches share some obvious discursive commonalities, the content of the underlying Christian nationalism concept appears dependent upon what instruments are available to the survey researcher, rather than on the basis of what instruments best fit the theoretical latent construct of interest. The result is something of a game of measurement whack-a-mole—given the different permutations that Christian nationalism takes across studies, it is difficult to settle on any one measurement strategy to evaluate in good faith.Footnote 3
However, probably the most popular measure of Christian nationalism today involves a battery of six items that were fielded as far back as the 2007, Wave II BRS. Respondents are asked to rate the extent to which they agree or disagree with the following statements:
• The federal government should declare the United States as a Christian nation.
• The federal government should advocate Christian values.
• The federal government should enforce strict separation of church and state. (reverse coded)
• The federal government should allow the display of religious symbols in public spaces.
• The success of the United States is part of God's plan.
• The federal government should allow prayer in public schools.
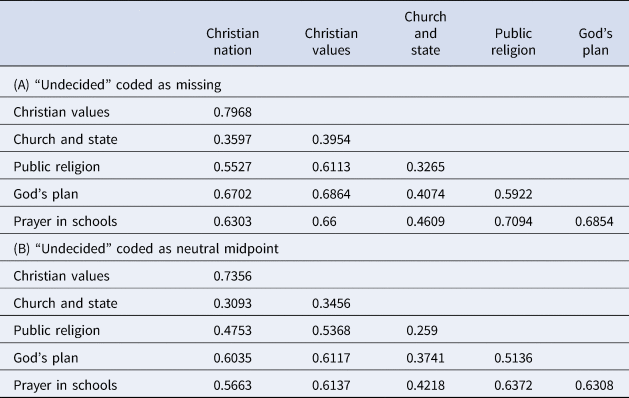
Responses to the questions range from “strongly disagree” (1) to “strongly agree” (4), with a fifth option for “undecided” (5). In much of the literature involving Christian nationalism, these undecided responses are recoded to a neutral mid-point, after which all items are summed together. All coding and measurement schemes are imperfect. Listwise deletion risks omitting interesting variation. Multiple imputation, on the other hand, is model-based and can over-identify relationships. In the case of moving “undecided” responses to the neutral mid-point, this coding decision is also not without its own serious drawbacks.Footnote 4 For example, it is unclear whether “undecided” conveys a non-attitude or a substantively moderate (neutral) stance.Footnote 5 The practical result, at any rate, is that this coding decision will always contribute a nontrivial number of “points” to the overall Christian nationalism score, which likely introduces measurement error (e.g., it decreases the interitem correlations among these instruments per Appendix Table A1).
Finally, in addition to these variables, several other socio-demographic quantities of interest are included in later modeling. Partisanship is measured via the traditional seven-category approach. Later analysis will combine leaning-partisans with their partisan peers, leaving only “pure” Independents between Democrats and Republicans. Ideology ranges from extremely liberal to extremely conservative. Age is a continuous variable ranging from 18 upwards. Education is a categorical variable ranging from “no high school degree” to “post-graduate.” White and Black racial identification are dichotomous variables, leaving persons who identify with other racial or ethnic groups in the excluded category. Religious affiliation is split into separate, dichotomous variables for Evangelical, Mainline Protestant, and Catholic identification, with other forms of religious affiliation in the excluded category.
Analysis
The analysis of the BRS data proceeds in two parts. First, I begin by exploring the construct validity of the Christian nationalism index. This task involves analyzing the factor structure of the six Christian nationalism instruments widely used in religion and politics research. I then show how categorical approaches to operationalizing Christian nationalism bring into relief problems with the traditional, unidimensional scale. Second, I evaluate how the Christian nationalism scale functions as a predictive instrument. This final task incorporates the role of partisanship to demonstrate that Christian nationalism operates in a somewhat peculiar manner not identified by past research.
The factor structure of Christian nationalism
As is often the case when exploring the psychometric structure of a construct, we might begin by assessing the measurement properties of the Christian nationalism scale according to several simple analyses. Past research often includes two pieces of information about the items that make up this index: it displays acceptable levels of Cronbach's α and appears to load onto a single factor when conducting exploratory factor analysis. While Cronbach's α is indeed high for the six instruments in these data (α = 0.86), it bears acknowledging that this property only communicates whether a test sample reports a pattern of values that are consistent across a set of instruments (Gardner Reference Gardner1995). It does not follow, however, that shared variance will necessarily involve unidimensionality.Footnote 6 In fact, because internal consistency is a necessary but not sufficient condition for unidimensionality, additional data reduction methods like, say, factor analysis are needed to assess whether a scale faithfully captures a single latent trait or is, instead, multidimensional. In short, Cronbach's α cannot tell the researcher much about dimensionality, despite researchers commonly reporting it as such.
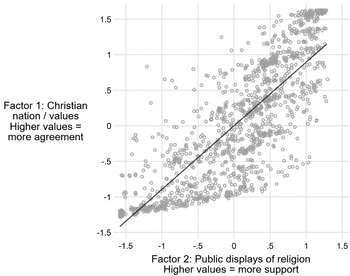
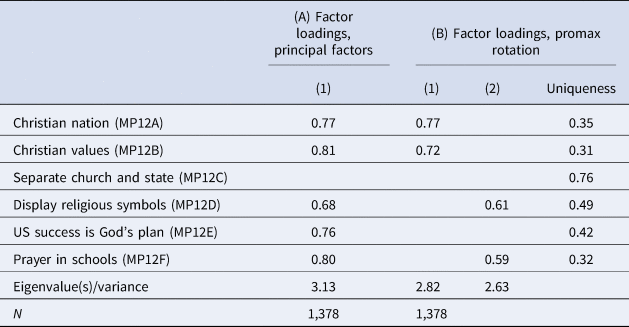
So, what does factor analysis report about this measure? At first blush, the results in column A of Table 1 suggest that a single factor adequately captures the variation among the six input instruments—a result commonly included in Christian nationalism research to justify constructing an additive scale from these variables. However, rotating the factor solution, which helps minimize the complexity of factor loadings, hints that the index hides a second factor. Here, we use promax rotation, which allows for the resulting factors to be correlated (an obvious possibility here).Footnote 7 As column B in Table 1 indicates, this analysis produces two factors (although best practices associated with scale construction would suggest that the lower loadings of the items in the second factor are insufficient to proceed with treating it as such; see Furr Reference Furr2011). The first dimension involves beliefs about whether the United States is a Christian nation that is girded with especially Christian values; the second dimension involves attitudes toward public displays of religion.Footnote 8 The two dimensions are highly correlated (r = 0.8), despite being empirically separable. One could believe that Christian values have a place in government (Factor 1), for example, while still promoting religious pluralism in public spaces (Factor 2).Footnote 9 Indeed, that is a hallmark of religious tolerance, and some respondents appear to think this way. Figure 1 illustrates a scatterplot of these two indices against each other and conveys that beliefs about the appropriateness of public displays of religion vary among persons who reject the idea that America is an especially Christian nation (negative values on Factor 1). In contrast, as we might expect, persons who connect Christian values to government are much more likely to approve of public displays of religion (i.e., the tight clustering in the upper-right quadrant of the graph).
Comparing views about whether America is a Christian nation and the appropriateness of public displays of religion.
Notes: Results derived from principal factors analysis with promax rotation. Responses are lightly jittered. Higher (lower) values convey (dis)agreement with the idea that America is a Christian nation and (dis)favor for public displays of religion.

Principal factors analysis of the Christian nationalism index, with and without rotation

Notes: Data drawn from 2017 BRS. Cell entries convey factor loadings of respective variables. Loadings less than 0.50 have been omitted for clarity. Uniqueness values correspond to the rotated, oblique solution.
The existence of two factors is not entirely surprising given the conceptual differences among these items. In fact, past research describes Christian nationalism as a multifaceted concept. Whitehead et al. (Reference Whitehead, Perry and Baker2018a, 147), for example, describe it as an “ideology,” while Whitehead et al. (Reference Whitehead, Schnabel and Perry2018b, 4) echo that it is a “multidimensional measure.” Yet, they—and many others—still collapse these items into a one-dimensional, additive scale. While this approach may be attractive in the sense that Christian nationalism may incorporate different theoretical ideas that contribute to a broader worldview, the construction of latent traits must be guided (and tested) by data generating processes in an iterative fashion (Fariss et al. Reference Fariss, Kenwick and Reuning2020)—something the Christian nationalism measurement project has lacked. In fact, given the various ways that this construct has been measured over time—ranging from personal religious identity's connection to American-ness (Davis and Perry Reference Davis and Perry2021), to views about public displays of religion (Whitehead and Perry Reference Whitehead and Perry2020), to beliefs about divine providence (McDaniel et al. Reference Mcdaniel, Nooruddin and Shortle2011)—it stands to reason that these beliefs may not condense into a single latent trait.Footnote 10
The categorical approach to measuring Christian nationalism
One additional way of testing whether a unidimensional approach to operationalizing Christian nationalism is appropriate involves exploring whether there are “levels” or “categories” within the scale. Although Christian nationalism is usually treated as a continuous measure for modeling its relationship to various social and political preferences, some research has created groupings from the Christian nationalism scale (e.g., Whitehead and Perry Reference Whitehead and Perry2020). In theory, by binning individuals together into these groups, it becomes easier to assess how persons with varying levels of Christian nationalism think about politics and religion and differ across sociodemographic features such as race, education, and gender.Footnote 11
In Taking America Back for God, for example, the authors construct a four-group typology from the Christian nationalism scale that ranges from low to high values of Christian nationalism. The cut-points for group thresholds in the first three groups are spaced equally apart on the additive scale, at values of six (0–5, 6–11, 12–17), while the fourth group incorporates seven values (18–24). The group labels may be somewhat opaque to those unfamiliar with this research, so a brief set of descriptions may be in order. Rejecters (0–5) resemble pluralists, if not secularists, favoring no specific religious content in government; Resisters (6–11) are akin to civil religionists, or those who are open to, but do not necessarily advocate for specifically Christian values in government; Accommodators (12–17) resemble normie, mainline Christians who see a place for Christian values in public spaces but do not necessarily advocate for special treatment; finally, Ambassadors (18–24) openly endorse a theocratic state grounded in Christian principles.
While these groupings are sensible, there are at least two problems with this ad hoc measurement approach. First, if the exploratory analysis above correctly identifies underlying dimensionality in the Christian nationalism index, then an additive combination of these items will necessarily interject measurement error into the scale. By extension, this will mechanistically result in misclassification errors, where scores are added together in ways that violate the underlying pattern of responses to the individual instruments. Second, this arbitrary set of thresholds for group assignment is not ideal. It is unclear whether someone who scores a 6 is meaningfully different from someone who scores a 7 on the additive scale.
Instead, a better way of creating such a typology would be to use an empirical sorting method that systematically clusters respondents based on patterns in their responses to the Christian nationalism input items.Footnote 12 That approach would provide an opportunity to test whether the groups created from the Christian nationalism scale are justifiable, while simultaneously illustrating whether scale values have distinct “meaning.” If the two approaches come to different conclusions about what people belong in which group, then this analysis offers another piece of evidence that the additive scale contains problematic measurement error.
To sort persons into groups on the basis of their responses to the Christian nationalism battery, I use latent class analysis (LCA), which is a form of mixture modeling. Practically, LCA first determines how many classes are needed to account for the variation among input items and then assigns respondents a probability of being placed in a group with other individuals whose pattern of responses to the input items resembles a group archetype.Footnote 13 It is an agnostic approach to clustering that can determine how many groups exist within the Christian nationalism index, as well as who goes with what group.
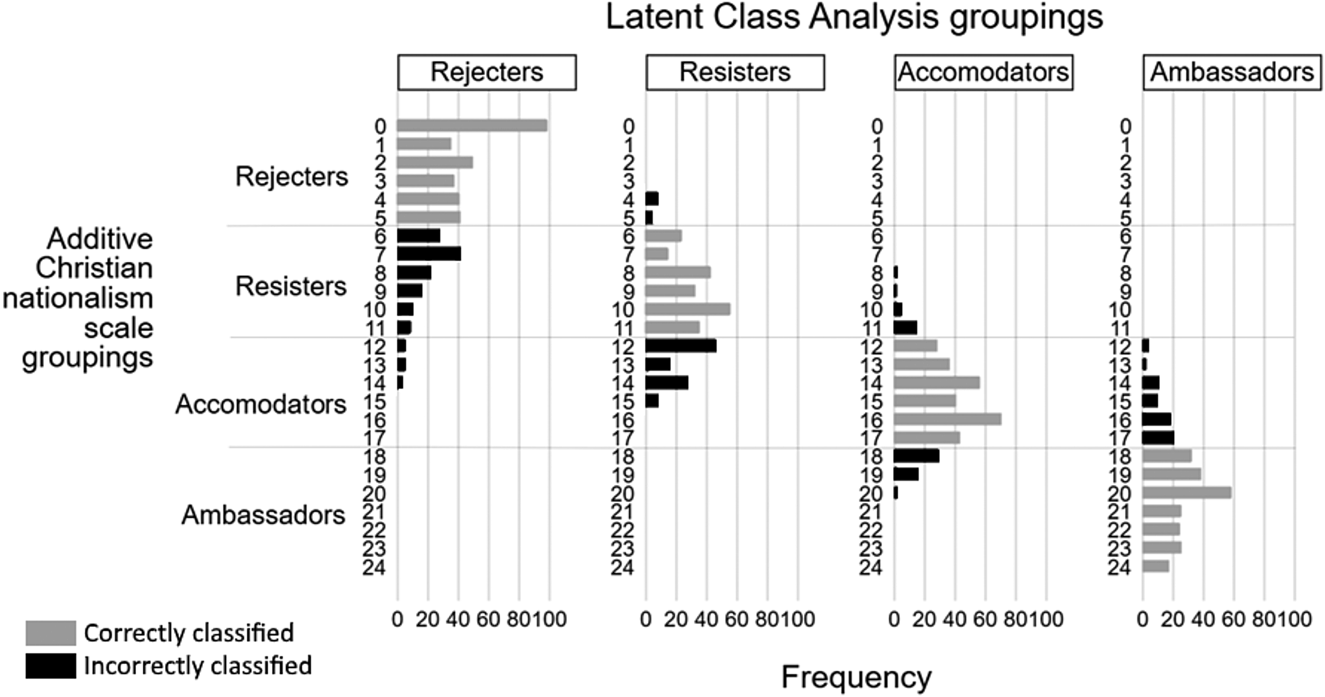
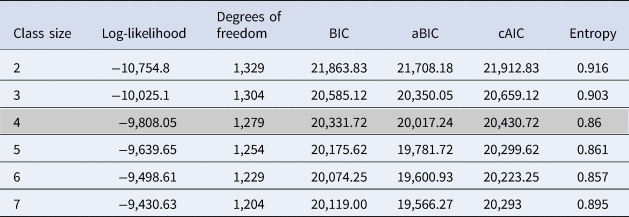
A series of models were estimated and a four-group solution was retained.Footnote 14 We can compare the groups created by LCA against the groups from the additive approach. In perfect world, where the additive scale and the thresholds chosen by Whitehead and Perry (Reference Whitehead and Perry2020) did an efficient job at parsing people into groups, group assignment from LCA would match the threshold-based assignment from the additive scale. As Figure 2 illustrates, however, this is clearly not the case. Here, the y-axis arrays persons by score on the additive Christian nationalism scale, with the Whitehead and Perry (Reference Whitehead and Perry2020) cut-points and group names superimposed onto the distribution of values ranging from lowest to highest Christian nationalism scores. The panels arrayed from left to right display the corresponding groups derived from the LCA, which are ordered by mean levels of Christian nationalism from low to high. The lightly shaded, grey bars convey observations (persons) where the additive and LCA groupings match. The darker black bars reflect persons who were assigned to the LCA group, but fall outside of the corresponding group on the additive scale.
Comparing an additive and latent class analysis typology of Christian nationalism.
Notes: Observations within panels were assigned via latent class analysis. Scale on the y-axis orders group members' Christian nationalism scores, with superimposed group thresholds according to the additive scale cut-points in Whitehead and Perry (Reference Whitehead and Perry2020). Lighter shaded (grey) bars convey agreement between the two classification methods, where observations (people) were sorted into a consistent group. Darker (black) bars indicate misclassification; these are persons who are included in a given LCA-derived group but not in the corresponding group within the additive index.

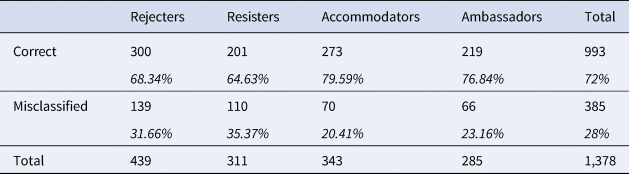
Visually, Figure 2 illustrates that there is serial misclassification in the additive scale, where persons belonging to groups in the additive Christian nationalism scale are assigned to different groups in the LCA analysis. Table 2 depicts the scope of these problems by summing the classification errors by group. Overall, about 28% of all respondents are misclassified using the threshold scale imposed onto the additive Christian nationalism index.Footnote 15 Given the significant spillage of persons in groups of the additive scale across groups of the LCA typology, it would seem that an arbitrary set of thresholds applied to the additive index is not an ideal way to construct a typology of Christian nationalism.Footnote 16 Further, it highlights how different values on the scale may hold less meaning than their numerical positioning suggests. For example, despite the value “12” being associated with the “Accommodator” class in the additive scale, respondents who scored that value can be found in each of the four groups produced by the LCA model. In turn, this noise in the interior of the scale raises the possibility that there may be consequences for prediction involving Christian nationalism as an explanatory variable. We turn next to investigating that prospect.
Misclassification across the Christian nationalism typology
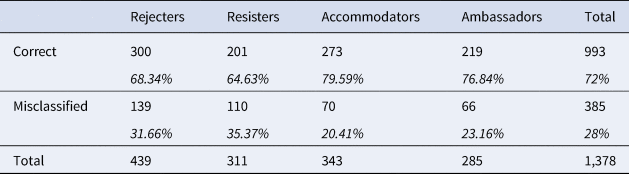
Notes: Misclassification occurs when a respondent's grouping on the additive Christian nationalism scale does not match the corresponding group of the latent class analysis' assignment. Percentages are in italics. Columns sum to 100%.
How (well) does Christian nationalism function at the scale level?
The previous two analyses raise questions regarding the construct validity of the six-item Christian nationalism measure. Do these issues extend to predictive validity? One suggestive finding in the previous section implies that the Christian nationalism scale's values have unclear meanings (i.e., persons at certain values can be sorted into multiple groups simultaneously). This raises the question of whether values on the scale are ordinal or interval in nature. When a scale is ordinal but not interval, the meaning of one-unit changes in values on the index may become difficult to compare, much less interpret. In fact, the problem is so acute that, ordinal scales are often not useful unless the distance between categories has some sort of consistent substantive meaning (Kemp and Grace Reference Kemp and Grace2021, 1).
One simple way of analyzing Christian nationalism's predictive validity, then, involves exploring its relationship to relevant outcomes of interest. Consider panel A in Figure 3, which roughly corresponds to Whitehead et al.'s (Reference Whitehead, Perry and Baker2018a) model of 2016 presidential vote choice. As persons move from low to high values of Christian nationalism, the probability of casting a Trump vote increases and in serial, linear fashion. However, what this approach emphatically does not do is test whether the values of Christian nationalism display interval-level properties nor the extent to which values on the scale are differentiable from each other. In fact, while it appears that Christian nationalism is a substantively powerful predictor of vote choice, we have no way of knowing whether the marginal effect of a given value of Christian nationalism on vote choice is different, much less significantly so from that of a neighboring value. For this, additional estimation would be required.Footnote 17
The relationship between Christian nationalism and Trump vote choice.
Notes: Logistic regression models include following list of covariates: age, education, religious denomination, age, gender, race, ideology, and partisanship. Marginal predictions in panel A were calculated via margins post-estimation command in Stata; bars convey 95% confidence intervals. Odds ratios in panel B are marginal effects of given Christian nationalism value on Trump vote choice relative to scale midpoint (12). Solid bands convey 95% confidence intervals; those that cross the horizontal bar at 0 are not distinguishable from the scale midpoint's coefficient.

Panel B in Figure 2 does just this, and the results are curious. For this analysis, all of the values of the Christian nationalism scale are treated as dummy indicators, with the true midpoint of the scale—the value 12—as the omitted category. In theory, based on panel A, we expect to observe a consistent, linear increase in the magnitude of log-odds coefficients as we move from minimum to maximum values on the underlying Christian nationalism index. These coefficients should be negative at the low end of the scale and positive at the upper end. While these coefficients do, in fact, shift from negative to positive, values clustered close together on the scale often overlap—in fact, linear combination tests in Table 3 indicate that scores of, say, 1 and 6 or 9 and 15 do not differ in their relationship to the outcome. Those null results are concerning given the significant distance they represent across the scale; in the case of the comparisons between values 9 and 15, that distance represents almost 30% of the total range of the scale. It would seem, then, that the Christian nationalism scale does not do a very efficient job of reflecting attitudinal “strength” in this case because the values do not seem to exhibit an interval nature, but, instead, a coarse ordinal one.Footnote 18
Linear combination tests for differences among different values of Christian nationalism

Notes: Linear combination tests were calculated via the lincom command in Stata, v.16. The values here were chosen in part because they span different groups in the additive Christian nationalism typology.
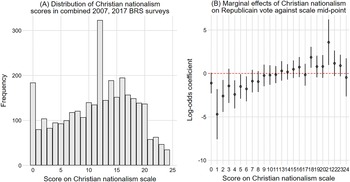
One may object to this sort of analysis, however, on the basis of power—perhaps there are simply not enough observations at each given category within the Christian nationalism scale to reduce the standard errors associated with each respective point estimate. In that case, the insignificant results depicted here are more artifact than reality. The 100-point feeling thermometers commonly used by researchers to assess coolness or warmth toward groups, for example, suffer from such problems. Despite the efficiency of linear regression, it would be difficult to expect the values 46 and 53 on such a scale to exhibit statistically distinguishable marginal effects on an outcome given that few observations occur at these values. To reduce concern that this finding is an artifact of too few observations at given values on the Christian nationalism scale, I pooled the 2007 and 2017 BRS surveys together and replicate the analysis in Figure 4 using Republican vote choice as dependent variable. Pooling the surveys together, there are a significant number of observations at each category of the Christian nationalism scale, as panel A in Figure 4 illustrates. Here, the number of observations at values on the scale range from 35 (~1.5% of the sample) to roughly 300 people (over 12% of the sample). This test is far more robust to small-sample concerns than the one presented in Figure 3, and yet the results are nearly identical. While the poles of the scale are obviously different from each other—thereby driving the “average” effect of Christian nationalism presented in panel A in Figure 3—there is considerable noise among the interior values on the Christian nationalism scale. Secularists (low values) and bonafide theocrats (high values) are distinct, but it is anyone's guess as to what the middle of the scale means.
Distribution of Christian nationalism scores and marginal effects of casting Republican presidential vote.
Notes: Analysis pools 2007 and 2017 Baylor Religion Surveys together. Point estimates in panel B are derived from a model with the same covariates as the one used to produce Figure 2, with the addition of a fixed year effect for 2017.

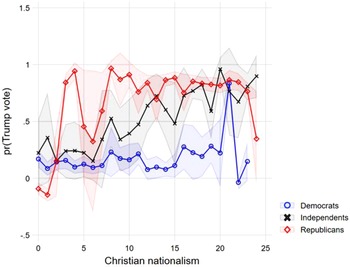
Even still, perhaps Christian nationalism means different things to people with different political backgrounds, in which case this sort of analysis makes less sense than would analyzing these relationships by respondent partisanship. Perhaps, given Christian nationalism's close correspondence to Republicanism, the scale will efficiently predict vote choice among right-leaning persons, whereas its relationship to Democratic vote choice is weaker or even nonlinear. Figure 5 depicts the results of a vote choice model with an interaction term between partisanship and Christian nationalism. In this analysis, however, we pivot to a linear probability model because the inclusion of this interaction term introduces such collinearity that the logistic regression model is unidentified. In fact, that development is revealing: Christian nationalists are Republicans and Republicans voted for Donald Trump. There is simply insufficient variation in Christian nationalism among Republicans to avoid perfect prediction. While the linear probability model sidesteps this problem, it does present second-order problems of its own with negative predictions in cases of sparcity (e.g., Republican voting at the extreme low-end of the Christian nationalism measure where there are no such people). Still, the results are instructive.
Predicted Trump voting among partisans.
Notes: Point estimates derived from linear probability model (LPM) and bracketed by 95% confidence intervals.

The estimates presented in Figure 5 reveal that Christian nationalism simply does not exhibit interval-level properties. Beyond, say, the 30th percentile of Christian nationalism, higher scores—more Christian nationalism—are not related to a higher probability of voting for Donald Trump. That pattern is more or less the same for Democrats—Christian nationalism does not introduce more conservative behavior as scores increase. In fact, the only group for which Christian nationalism works in the way predicted by its designers is among Independents. For those respondents, higher values of Christian nationalism do predict higher chances of casting a vote for Trump, although the effects are still noisy (e.g., values 16 and 23 overlap).Footnote 19
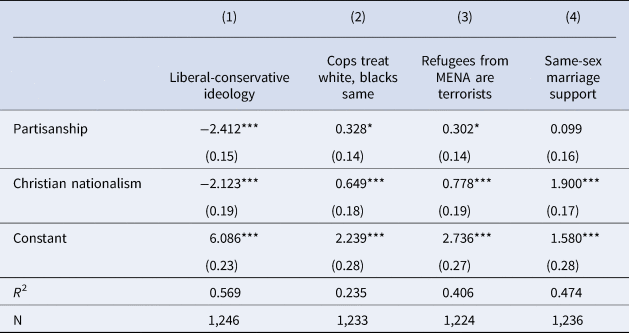
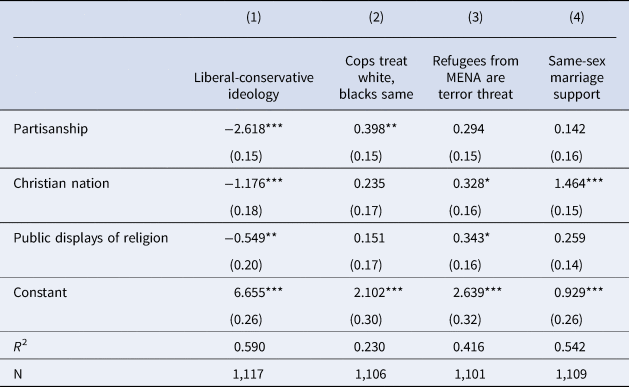
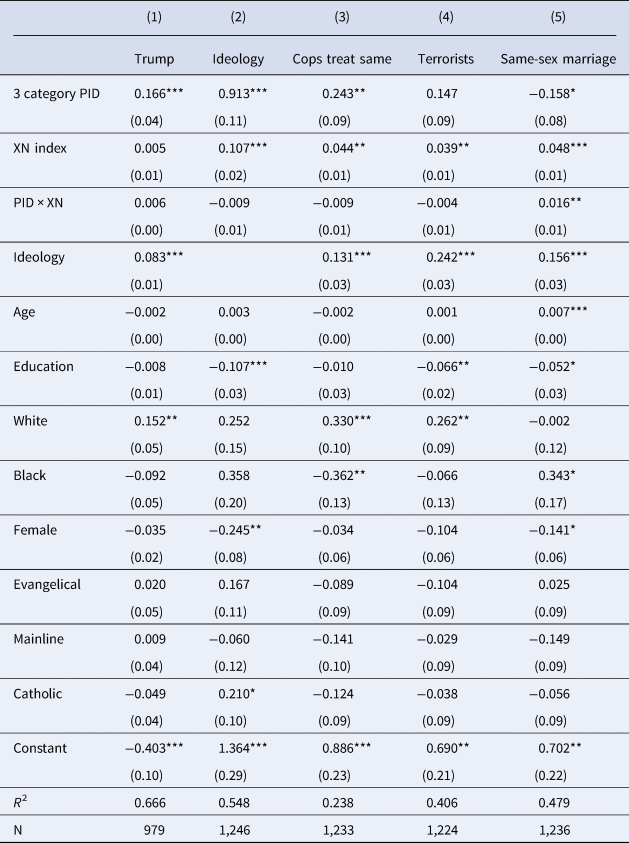
Yet, one might argue that presidential voting is only one outcome of interest. To what extent does this pattern generalize to other social and political preferences? Past research suggests that Christian nationalism is associated with conventional ideological beliefs (Whitehead and Perry Reference Whitehead and Perry2020), views about police (mis)treatment of racial minorities (Perry et al. Reference Perry, Whitehead and Davis2019), stereotypical attitudes about refugees (Al-Kire et al. Reference Al-Kire, MH, J-A, J and WC2022), and same-sex marriages (Whitehead and Perry Reference Whitehead and Perry2015). While Table 4 replicates those analyses and indicates that Christian nationalism is strongly related to each of these attitudes, the devil is in the details.
Social and political beliefs associated with six-item Christian nationalism index

Notes: Data draw from 2017 BRS. Both Christian nationalism and partisanship have been rescaled to range from 0 to 1 to increase the legibility of comparisons in the coefficients associated with these variables. Standard errors in parentheses. Full model includes ideology, race, gender, education, age, and evangelical identification. *p < 0.05, **p < 0.01, ***p < 0.001.
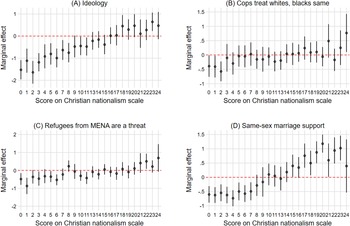
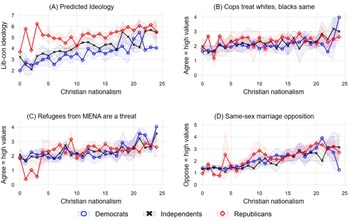
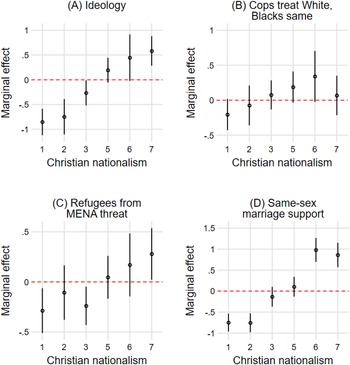
Similar to Figures 3 and 4, Figure 6 breaks apart Christian nationalism at the scale level to assess how its range of values are related to the outcomes modeled in Table 4. Beginning with ideology in panel A in Figure 6, the results seem promising. Despite there being some overlap of neighboring values, the pattern of marginal effects is sufficiently steep from minimum to maximum values on the Christian nationalism index that it does appear that these scores discriminate how people place themselves in liberal-conservative space; many values are “correctly” and significantly distinct from the scale midpoint. However, comparing predicted values of Republican and Democratic Christian nationalism in Figure 7, we again observe that this linearity is mostly driven by Independent respondents. Among partisans, the results are extremely noisy. Republicans at value 3 on Christian nationalism, for example, are more conservative than Republicans at 15; meanwhile Republicans at value 12 are about as conservative as those at value 20. This pattern does not at all look like what we would expect. For Democrats, the relationship is a bit more sensible, though values 16 through 23 exhibit an idiosyncratic flattening of the predicted placement—perhaps because there are simply not many Democrats who score at the upper threshold of Christian nationalism. Still, compared to Trump voting, these results seem more in line with what we might expect from this measure.
Marginal effect estimates associated with values on the Christian nationalism index and various social and political attitudes.
Note: Point estimates convey marginal effects of given value of Christian nationalism against the scale's true midpoint value. Solid bands convey 95% confidence intervals; estimates that cross the dotted line at zero are not distinguishable from midpoint value. Models are specified verbatim across dependent variables and include ideology, partisanship, gender, race, education, age, and religious denomination.

Predicted outcome values across range of Christian nationalism scores, by partisanship.
Note: Point estimates convey marginal predictions of dependent variable at given value of Christian nationalism for respective partisan group. Shaded bands convey 95% confidence intervals. Models are specified verbatim across dependent variables and include ideology, gender, race, education, age, and religious denomination.

However, looking at panels B and C in Figure 6, it seems that Christian nationalism—despite its alleged prowess at predicting racial attitudes and views about immigration (refugee threat)—is weakly related to these outcomes. Figure 7 puts this non-relationship into sharper relief. Among partisans, the predicted values on the dependent variables across the range of Christian nationalism are extremely flat. In both cases, it is values at the very extreme ends of the Christian nationalism index that are creating the illusion that there is a gradual, positive relationship among these variables (per Table 4). This pattern extends to same-sex marriage as well. Panel D in Figure 6 suggests that values across large portions of the Christian nationalism scale are indistinguishable from the midpoint of the scale. Panel D in Figure 7, in turn, reveals that at low values of Christian nationalism, Democratic preferences for same-sex marriage are quite similar, while the interior of the scale is essentially flat for Republicans. Again, it is the preferences of people at the poles of this measure that seem to be driving most of the effect associated with this scale. Thus, it would seem that simply averaging the Christian nationalism input items together, tossing them into a regression, and then plotting the marginal predictions will obscure how this index functions at the interval level—not well at all.
Conclusion
The results of this paper should not be taken as evidence that Christian nationalism is not real. Republicans hold the view that God has a special plan for the United States and that it is, in turn, a nation that ought to live according to Christian values (Whitehead and Perry Reference Whitehead and Perry2020; Gorski and Perry Reference Gorski and Perry2022). The events of the last several years, from the election of Donald Trump to the prospective overturning of Roe v. Wade, illustrate the power of religious nationalism in the United States. As a theoretical framework, Christian nationalism presents a reasonable account of how racial, religious, and political elements combine together to form a summary property of religious-political motivations that explains these developments.
However, for all its attractive discursive properties, Christian nationalism's psychometric properties as a latent trait are poorer than past work conveys. In fact, despite the apparent prowess of the six-item index's predictiveness, analysis of the input items used to construct Christian nationalism conveys that the additive scale is dimensional and contains significant measurement error. Further, the scale exhibits a disturbing lack of consistency—values across wide ranges of the scale are often indistinguishable from each other, a problem that comes into sharper relief when Christian nationalism is broken apart by partisanship. It is not necessarily that Christian nationalism is empirically unimportant, but that it has so fully incorporated itself into mainstream, conservative Republicanism that its ability to independently predict variation in behavior among partisans is minimal. Today, to be a Christian nationalist is to be a Republican; to reject Christian nationalism is to be a Democrat. Extracting religious nationalism from partisanship is difficult, though not impossible.Footnote 20
Moving forward, more attention should be paid to the exact conceptual feature(s) of Christian nationalism that researchers desire to measure and analyze. Symbolic and instrumental beliefs are separable both theoretically and empirically, but Christian nationalism research seemingly mixes these features together haphazardly. The consequence of this approach is that anything involving conservative expressions of religious-political belief appears to be “Christian nationalism”—yet this flattens the various ways that identity and religious beliefs may move dynamically to shape social and political attitudes.
The six-item Christian nationalism index jams together several ideas that not only seem theoretically and empirically separable but are described as such by the scholars conducting this research. At minimum, these ideas encompass: (1) endorsement of the idea that the America is a Christian nation with Christian values; (2) the appropriateness of the separation of church and state; and, (3) approval of public displays of religion. If Christian nationalism is a broad ideology that encompasses many of these features, then the fit between theory and measurement should reflect this variety. Researchers should carefully assess which of these facets are of interest when designing instruments to capture these latent beliefs inasmuch as they carefully theorize how such beliefs relate to outcomes of interest. While these different items all seem to nibble around the edges of the “Christian nationalist” worldview, reducing them down into a single linear continuum ranging from a rejection of Christian nationalism at one end to maximally Christian nationalist at the other is simply asking too much from these instruments.
Instead, if one must use these items, then researchers should begin by avoiding recoding missing or “don't know” replies to a neutral midpoint; although losing data is not ideal, this approach injects undesirable measurement error (see: Appendix Table A1). Next, according to the rotated factor solution presented above, it would seem that at least one, if not two separate additive indices could be produced by combining the “Christian nation” and “Christian values” instruments into one summary measure and “religious display of symbols” and “school prayer” into another. Table 5 suggests that the first combination of variables—views that America is a uniquely Christian nation—is modestly related to several of the outcomes explored in this paper; the second index, in contrast, is much more weakly related to these attitudes. Further, and vitally, Figure 8 reveals that measure combining “Christian nation” with “values” displays reasonable predictive movement across its range of values. It is not perfect—and more scale development is warranted using these items as foundation—but, mechanistically, it is certainly better than the six-item instrument used by so much research on Christian nationalism.
Marginal effects of two-item “Christian nation” index on social and political beliefs.
Notes: Point estimates derived from OLS regression models include following list of covariates: age, education, religious denomination, age, gender, race, ideology, and partisanship. Solid bands convey 95% confidence intervals. Point estimates should be interpreted against the scale midpoint; bands that cross the dotted line at 0 are not distinguishable from that value.

Modeling social and political beliefs as a function of a two-factor Christian nationalism solution

Notes: Data draw from 2017 BRS. Both Christian nationalism and partisanship have been rescaled to range from 0 to 1 to increase the legibility of comparisons in the coefficients associated with these variables. Standard errors in parentheses. Full model includes ideology, race, gender, education, age, and evangelical identification. *p < 0.05, **p < 0.01, ***p < 0.001.
However, whether this truncated index fully embodies how scholars desire to operationalize Christian nationalism is an open question. Moving forward, despite Christian nationalism's prominence as an explanatory tool, more attention should be paid to the intersection of theory and scale development, especially given the apparent relevance of this research for interpreting contemporary political events. It might have been a happy accident that the six items used to measure Christian nationalism were included in the 2007 BRS, but concepts demand continued evaluation and refinement. To that end, perhaps more attention to Juergensmeyer's (Reference Juergensmeyer, Hopkins, Batsone, Lorentzen and Mendieta2011) work on ideological religious nationalism is warranted. Taking a broader view of religious-political motivations, he described religious nationalism as a combination of “traditional religious beliefs in divine law and religious authority with the modern notion of a nation-state” (468). Christian nationalism seems comfortably nested within this framework and constructing scales around these more general ideas about the connection between religion and national identity may prove fertile for future researchers interested in measuring the psychological boundaries of Christian nationalism.
Dr. Nicholas Davis is an Assistant Professor in the Department of Political Science at the University of Alabama and the principle investigator of the Democracy and Open Science (DEMOS) lab. His research investigates the structure of political and religious belief systems, with a focus on how ordinary people think about democracy and the demands of pluralism.
Appendix
Pearson's product moment correlations among Christian nationalism items with and without “undecided” responses

Latent class fit statistics associated with varying class sizes

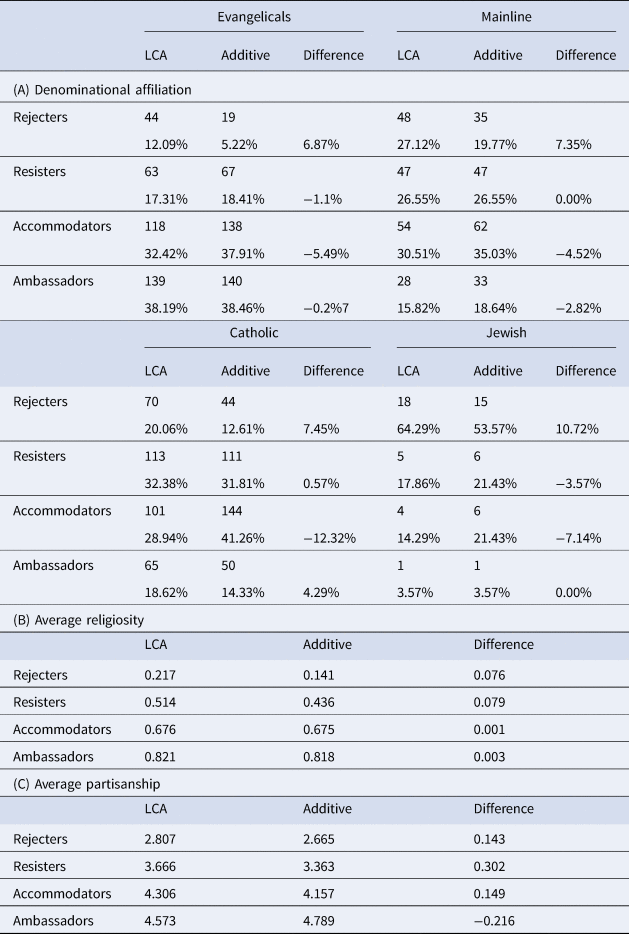
Demographic differences among the additive and LCA typologies

Modeling Christian nationalism among partisans

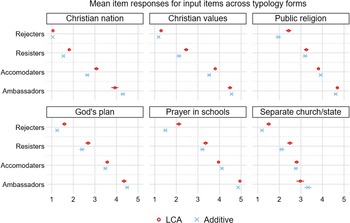
Summary stats for the typology—avg item scores across groups.
Notes: Figure displays mean response values for the six items that comprise the Christian nationalism index according to two typologies: the LCA classes produced here and those found in Whitehead and Perry (Reference Whitehead and Perry2020).