Introduction
The preimplantation development of mammals takes place from the time of fertilization. During this process, the oocytes and sperm are rapidly reprogrammed into a totipotent state, ensuring that the newly formed zygotic genome can subsequently drive development (Lepikhov and Walter, Reference Lepikhov and Walter2004; Schulz and Harrison, Reference Schulz and Harrison2019). After efficient reprogramming, the zygotic genome onsets transcription and developmental control is handed from maternally provided gene products to those synthesized from the zygotic genome through a process known as maternal-to-zygotic transition (MZT). During this process, the degradation of maternal products is coordinated with zygotic genome activation (ZGA) (Lee et al., Reference Lee, Bonneau and Giraldez2014; Schultz et al., Reference Schultz, Stein and Svoboda2018). In mice, minor ZGA occurs between S-phase of the 1-cell embryo and G1 of the 2-cell embryo, which is pronuclear stage (PN) 4–5, while major ZGA occurs during the mid-to-later 2-cell stage (Qiu et al., Reference Qiu, Zhang, Wu, Wang, Qian and Li2003). It has been demonstrated that both minor and major ZGA are crucial for preimplantation development (Warner and Versteegh, Reference Warner and Versteegh1974; Latham et al., Reference Latham, Garrels, Chang and Solter1991; Abe et al., Reference Abe, Funaya, Tsukioka, Kawamura, Suzuki, Suzuki, Schultz and Aoki2018).
Transcription of zygotic genes is finely regulated by chromatin accessibility. The nucleosome is the basic unit of chromatin. It contains octamers of two copies of the core histone proteins H2A, H2B, H3 and H4, which in turn form compacted heterochromatin. Chromatin accessibility is regulated through nucleosome position and configuration, which is influenced by histone variants and modification of histone N-terminal tails, such as methylation. Recently, an increasing number of studies have suggested that histone methylation and variants are in place to ensure tight control of ZGA (Lepikhov and Walter, Reference Lepikhov and Walter2004; Vastenhouw et al., Reference Vastenhouw, Zhang, Woods, Imam, Regev, Liu, Rinn and Schier2010; Eckersley-Maslin et al., Reference Eckersley-Maslin, Alda-Catalinas and Reik2018; Hanna et al., Reference Hanna, Demond and Kelsey2018; Wu et al., Reference Wu, Xu, Liu, Yao, Wang, Lin, Huang, Wang, Li, Shi, Zhang, Duan, Ming, Zhang, Niu, Song, Jin, Guo, Dai, Hu, Fang, Wang, Li, Li, Na, Xie and Sun2018).
Histone methylation is associated with both activation and repression of transcription depending on the methylation site. Methylation on 4, 36 and 79 in histone 3 (H3K4, H3K36 and H3K79) is associated with active transcription. In contrast, methylation on lysine 9 and 27 in histone 3 (H3K9 and H3K27) and on lysine 20 in histone 4 (H4K20) is linked to repression of transcription. It has been reported that broad histone H3K4 tri-methylation (H3K4me3) modulates the mouse ZGA process (Dahl et al., Reference Dahl, Jung, Aanes, Greggains, Manaf, Lerdrup, Li, Kuan, Li, Lee, Preissl, Jermstad, Haugen, Suganthan, Bjørås, Hansen, Dalen, Fedorcsak, Ren and Klungland2016) and demethylation of H3K27 tri-methylation (H3K37me3) is required for normal development of bovine preimplantation embryos (Chung et al., Reference Chung, Bogliotti, Ding, Vilarino, Takahashi, Chitwood, Schultz and Ross2017). These studies and subsequent ones demonstrated that histone methylation is essential for embryogenesis (Zheng et al., Reference Zheng, Huang, Zhang, Xiang, Du, Xu, Li, Wang, Ma, Peng, Xu and Xie2016; Wang et al., Reference Wang, Liu, Gao, Yang, Li, Liu, Chen, Kou, Zhao, Chen, Wang, Le, Wang, Duan, Zhang and Gao2018). However, detailed exchanges of these modifications in early embryos, especially during ZGA, remain to be determined.
As for canonical histones, histone variants (e.g. H2A and H3.3) are also linked to transcriptional activity. H2A has the largest number of variants, including macroH2A.1 (also known as H2AY1), H2A.X and H2A.Z. Rangasamy et al. (Reference Rangasamy, Berven, Ridgway and Tremethick2003) reported that H2A.Z first becomes detectable in trophectoderm cells. Nashun et al. (Reference Nashun, Yukawa, Liu, Akiyama and Aoki2010) reported an absence of H2A.Z from the 2-cell stage until the late 8-cell, while Bošković et al. (Reference Bošković, Bender, Gall, Ziegler-Birling, Beaujean and Torres-Padilla2012) showed that H2A.Z can be detected in zygotes and as early as in 4-cell stage embryos in mouse embryogenesis. This discrepancy motivated us to study the dynamics exchange of histone variants during the minor and major ZGA process in early mouse embryo.
In the present study, we investigated the dynamics of several histone modifications, as well as histone variants in the nuclei of cleavage-stage mouse embryos. We showed a dynamic exchange of histone variants and methylation during ZGA and our data suggested that macroH2A1, H2A.Z, H3K9me2/3 and H3K27me2/3 may play crucial roles during ZGA.
Materials and Methods
All materials were obtained from Sigma-Aldrich (St. Louis, MO, USA) unless otherwise stated.
In vitro fertilization
In vitro fertilization was performed as previously described (Huang et al., Reference Huang, Wang, Ma, Sun, Zhou, Zhu and Liu2014). Briefly, female Institute of Cancer Research (ICR) mice aged 42–49 days were superovulated with 10 IU pregnant mare serum gonadotrophin followed by 10 IU human chorionic gonadotrophin 48 h later via intraperitoneal injection. After 13–14 h, spermatozoa were collected from caudal epididymides of 8-week-old ICR male mice and pre-incubated in human tubal fluid (HTF) for 1 h under mineral oil at 37°C with 5% CO2. Subsequently, meta-phase II-stage (MII) oocytes were collected from the ampulla of oviducts and placed in HTF. The capacitated spermatozoa were moved to the HTF droplets for the insemination of these MII oocytes. After insemination (2 h), fertilized oocytes were washed five times and moved to KSOM medium for further culture.
Embryo collection
Zygotes and cleavage-stage embryos were collected at the indicated hours post insemination. PN stages were classified according to Adenot et al. (Reference Adenot, Mercier, Renard and Thompson1997) and zygotes were collected at 8 h and 12 h post insemination, which was PN 2–3 and PN 4–5 in our strain, respectively. Cleavage-stage embryos were collected at 28 h (2-cell), 38 h (4-cell), 52 h (8-cell) and 86 h (early blastocyst).
Immunofluorescence staining
Zygotes and embryos were washed in phosphate-buffered saline (PBS) containing 1 mg ml −1 bovine serum albumin (BSA), fixed with 4% paraformaldehyde in PBS for 15 min at room temperature (RT) and permeabilized with 0.5% Triton X-100 for 30 min at RT, followed by blocking with 5% BSA in PBS for 1 h at RT. Zygotes and embryos were incubated with primary antibodies (1:200 dilution) overnight at 4°C. After washing in PBS containing 1 mg ml-1 BSA, zygotes and embryos were incubated for 1 h at RT with corresponding second antibodies in the dark and stained with 1 mg/ml 4′,6-diamidino-2-phenylindole for 8 min at RT. After washing, the zygotes and embryos were placed on a glass slide and observed using a LSM710 laser scanning confocal microscope (Carl Zeiss, Prenzlauer, Berlin, Germany) under the same conditions. Images were exported using the Carl Zeiss LSM 700 bundled software and saved in .TIFF format. To quantify the histone modification changes in the nuclei, signal intensity was assessed with ImageJ software (version 1.52a). All information on antibodies is shown in Supporting Information Table S1.
Statistical analysis
Statistical analyses were conducted using SPSS software (version 18.0, SPSS). Analysis of variance (ANOVA) test was achieved to test the differences among the cleavage-stage embryos, while Student’s t-test was performed in pronuclei. Data are presented as mean ± standard error of the mean (SEM) and a P-value < 0.05 was considered as statistically significant.
Results
Dynamic expression of variant histone H2A in early development
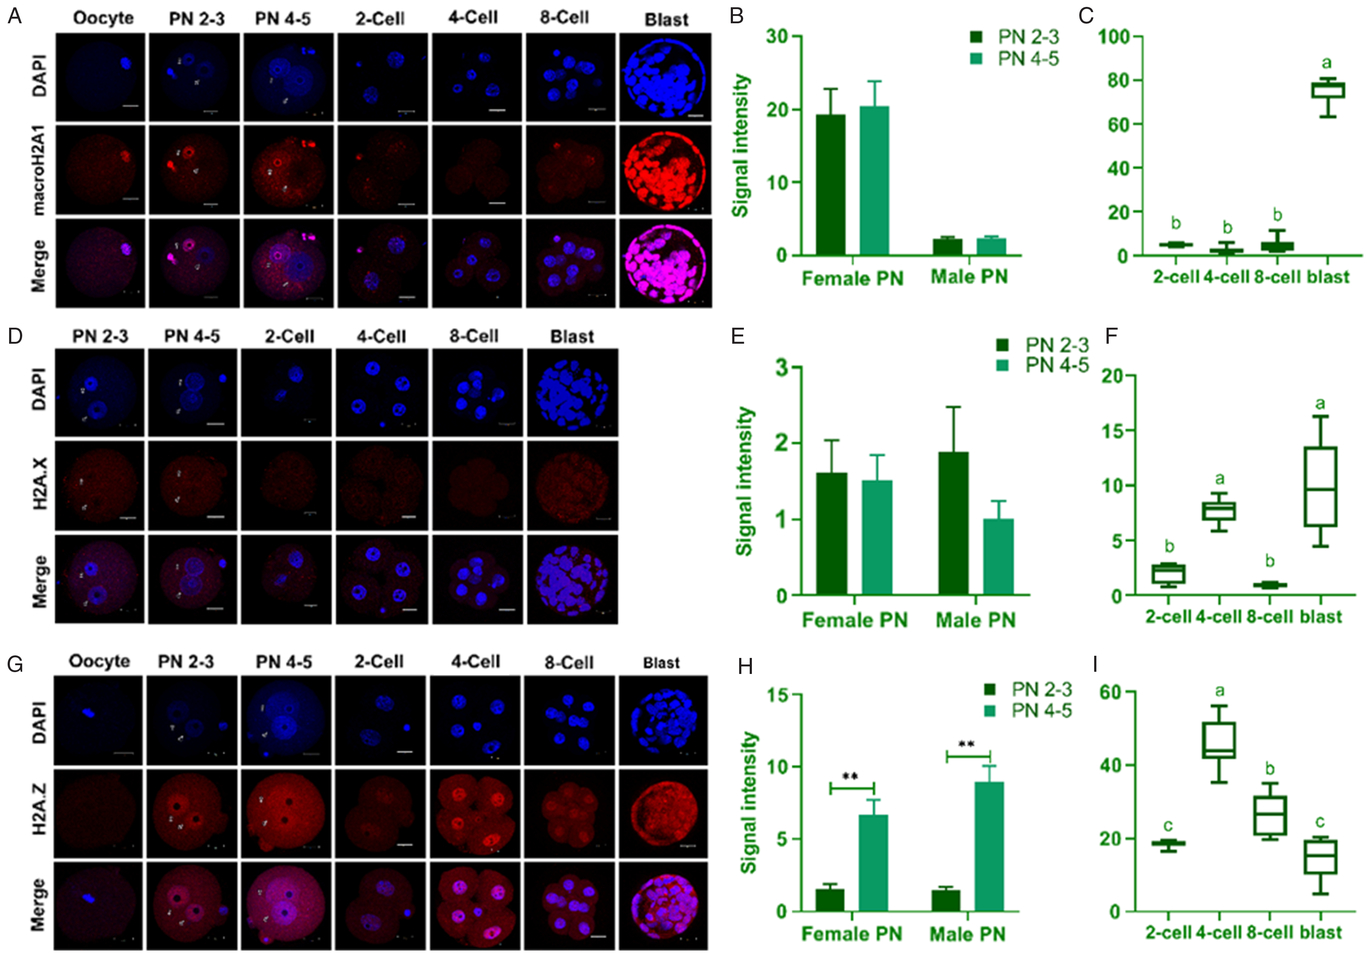
Variant histone H2A replaces conventional H2A in a subset of nucleosomes. In MII stage oocytes, microH2A1 was strongly stained. At PN 2–3 and PN 4–5 stages, microH2A1 was strongly stained in the female pronucleus, but not in the male pronucleus (Fig. 1 A, B). In 2-cell stage embryos, microH2A1 was weakly stained, suggesting that microH2A1 was reprogrammed during major ZGA. From 4-cell to 8-cell stage embryos, microH2A1 was not detectable, but strongly stained in the early blastocyst (Fig. 1 A, C), suggesting that microH2A1 may be associated with cell differentiation.
Dynamic expression of variant histone H2A in early development. (A) Exclusive staining of microH2A1 in the female pronucleus during minor ZGA and weak staining of microH2A1 in major ZGA. (B) MicroH2A1 signal intensity showed no statistical change in both the female and the male pronucleus, Student’s t-test. (C) MicroH2A1 was significantly increased in blastocysts, ANOVA. (D) Symmetric and weak staining of H2A.X in the male and female pronucleus and during mouse cleavage development. (E) H2A.X signal intensity showed no statistical change in both the female and the male pronucleus, Student’s t-test. (F) H2A.X was significantly increased in the 4-cell stage embryos and blastocysts, ANOVA. (G–I) Dynamic expression of H2A.Z during mouse early development. The H2A.Z signal was symmetrically present in the male and female pronucleus during minor ZGA and was significantly increased in the male and female pronucleus in the PN stage 4–5. H2A.Z was weakly stained in 2-cell stage embryos but increased in 4-cell stage embryos. Nuclei were counterstained with 4′,6-diamidino-2-phenylindole (DAPI, blue). MacroH2A1, H2A.X and H2A.Z were labelled with an anti-macroH2A1, anti-H2A.X and anti-H2A.Z antibody, respectively (red). The bottom panel shows a merged image of the corresponding Z-section of DNA and macroH2A1/H2A.X/H2A.Z. Embryos were analysed through confocal microscopy under the same conditions and in parallel. Scale bar represents 20 μm.

Another H2A variant that has been identified is H2A.X, which plays roles in DNA repair. After fertilization, H2A.X was weakly and symmetrically stained during pronuclear development and from 2- to 4-cell stage embryos, as well as in the early blastocysts. However, it was not detected in the 8-cell stage embryos (Fig. 1 D–F).
Histone H2A.Z is another variant of histone H2A. H2A.Z was not detected in MII stage oocytes. During minor ZGA, H2A.Z was symmetrically stained in both male and female pronuclei in PN 2–3 stage embryos and PN 4–5 stage embryos. However, the expression of the variant was slightly reduced in 2-cell stage embryos, but reached the highest level in the 4-cell stage embryos (Fig. 1 G, I). In 8-cell stage embryos and early blastocyst, the expression level of H2A.Z was decreased (Fig. 1 G, I).
Increased expression of H3.3 during ZGA
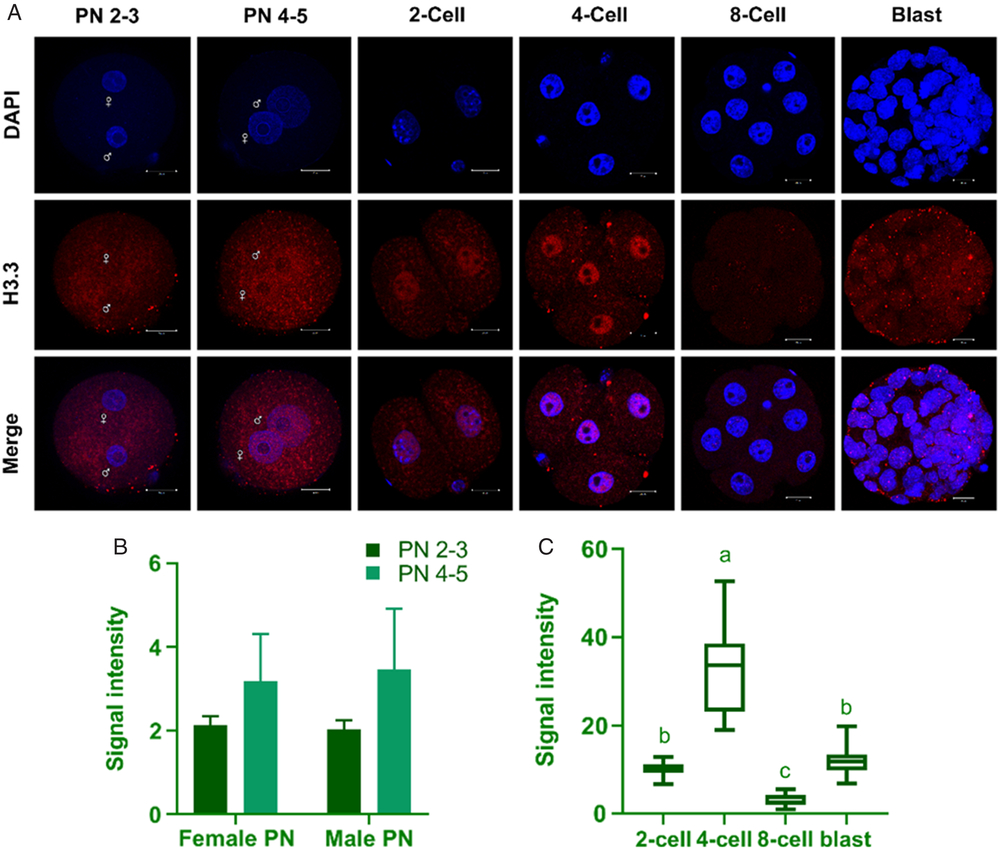
Histone H3.3 plays vital roles in maintaining genome integrity during mammalian development. Immunofluorescence staining revealed that H3.3 was not expressed in PN 2–3 stage pronuclear; however, it became detectable in male and female pronuclei in PN 4–5 (Fig. 2 A, B). Notably, the signal of H3.3 staining increased from 2- to 4-cell stage embryos and reached its highest level in 4-cell stage embryos, suggesting that H3.3 might play vital roles during ZGA. However, H3.3 was weakly stained in 8-cell stage embryos and blastocysts (Fig. 2 A, C).
Increased expression of H3.3 during ZGA. (A) H3.3 first became detectable at the PN 4–5 stage pronucleus and showed increased expression in 2- and 4-cell stage embryos, however, the signal was lost at the 8-cell stage. (B, C) Statistical analysis of H3K9me3 signal in the pronucleus and cleavage-stage embryos. Nuclei were counterstained with 4′,6-diamidino-2-phenylindole (DAPI, blue). H3.3 was labelled with an anti-H3.3 antibody (red). The bottom panel shows a merged image of the corresponding Z-section of DNA and H3.3. Embryos were analysed under confocal microscopy under the same conditions and in parallel. Scale bar represents 20 μm.

Asymmetric expression of H3K9me2 and H3K9me3 during ZGA
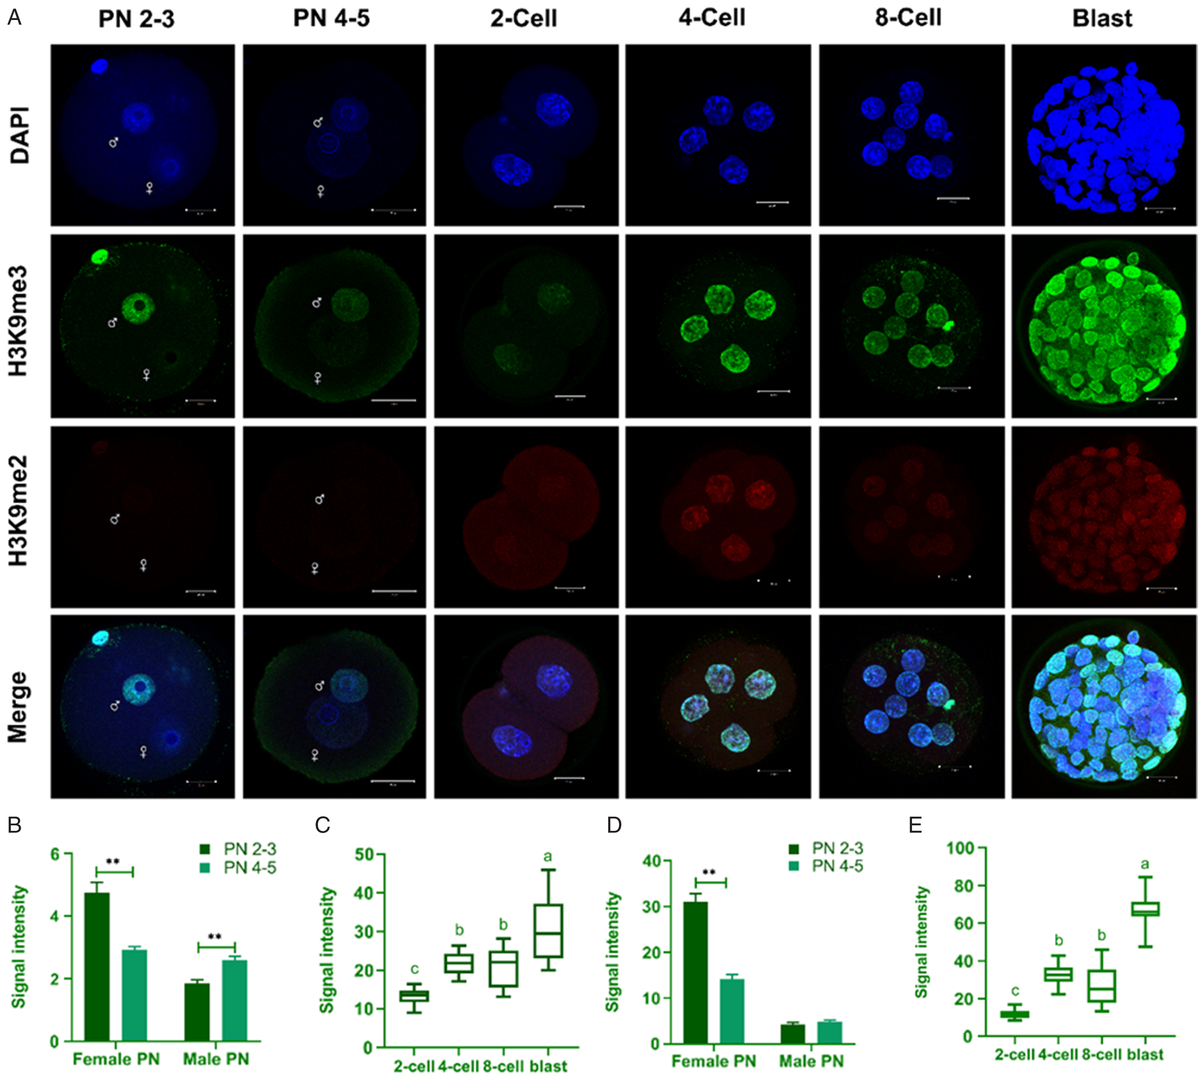
Di-methylation and tri-methylation of H3K9 is associated with repression of transcription. Immunofluorescence staining revealed that H3K9me2 was weakly stained in the female pronucleus and was barely detected in the male pronucleus in PN 2–3 and PN 4–5 (Fig. 3 A, B). After minor ZGA, H3K9me2 was symmetrically presented from 2-cell to early blastocysts and reached its highest level in the blastocysts (Fig. 3 A, C).
Asymmetric expression of H3K9me2 and H3K9me3 during ZGA. (A) H3K9me3 staining was decreased in the female pronucleus and increased in the male pronucleus, reached its lowest level in 2-cell embryos and gradually increased from 4-cell stage embryos to blastocyst; H3K9me2 was also decreased in the female pronucleus and increased in the male pronucleus and gradually increased form 2-cell stage embryos to blastocysts. (B, C) Statistical analysis of the H3K9me2 signal in the pronucleus and cleavage-stage embryos. (D, E) Statistical analysis of H3K9me3 signal in the pronucleus and cleavage-stage embryos. Nuclei were counterstained with 4′,6-diamidino-2-phenylindole (DAPI, blue). H3K9me2 and H3K9me3 were labelled with anti-H3K9me2 (red) and anti-H3K9me3 (green) antibodies, respectively. The bottom panel shows merged images of the corresponding Z-sections of DNA, H3K9me2 and H3K9me3. Embryos were analysed under confocal microscopy under the same conditions and in parallel. Scale bar represents 20 μm.

H3K9me3 was strongly stained in the female pronucleus, but weakly stained in the male pronucleus at PN stage 2–3. During minor ZGA, expression of H3K9me3 was decreased in the female pronucleus, but increased in the male pronucleus (Fig. 3A, D), indicating that H3K9me3 was asymmetrically expressed in pronucleus reprogramming. The signal of H3K9me3 was at its lowest level in major ZGA and markedly increased in 4-cell stage embryos. Notably, it was decreased in the 8-cell stage embryos, but reached the highest level in early blastocysts (Fig. 3 A, E). Collectively, the data related to pronuclear development suggested that the male genome onsets transcription first.
Dynamics of H3K27me3 and asymmetrical expression of H3K27me2
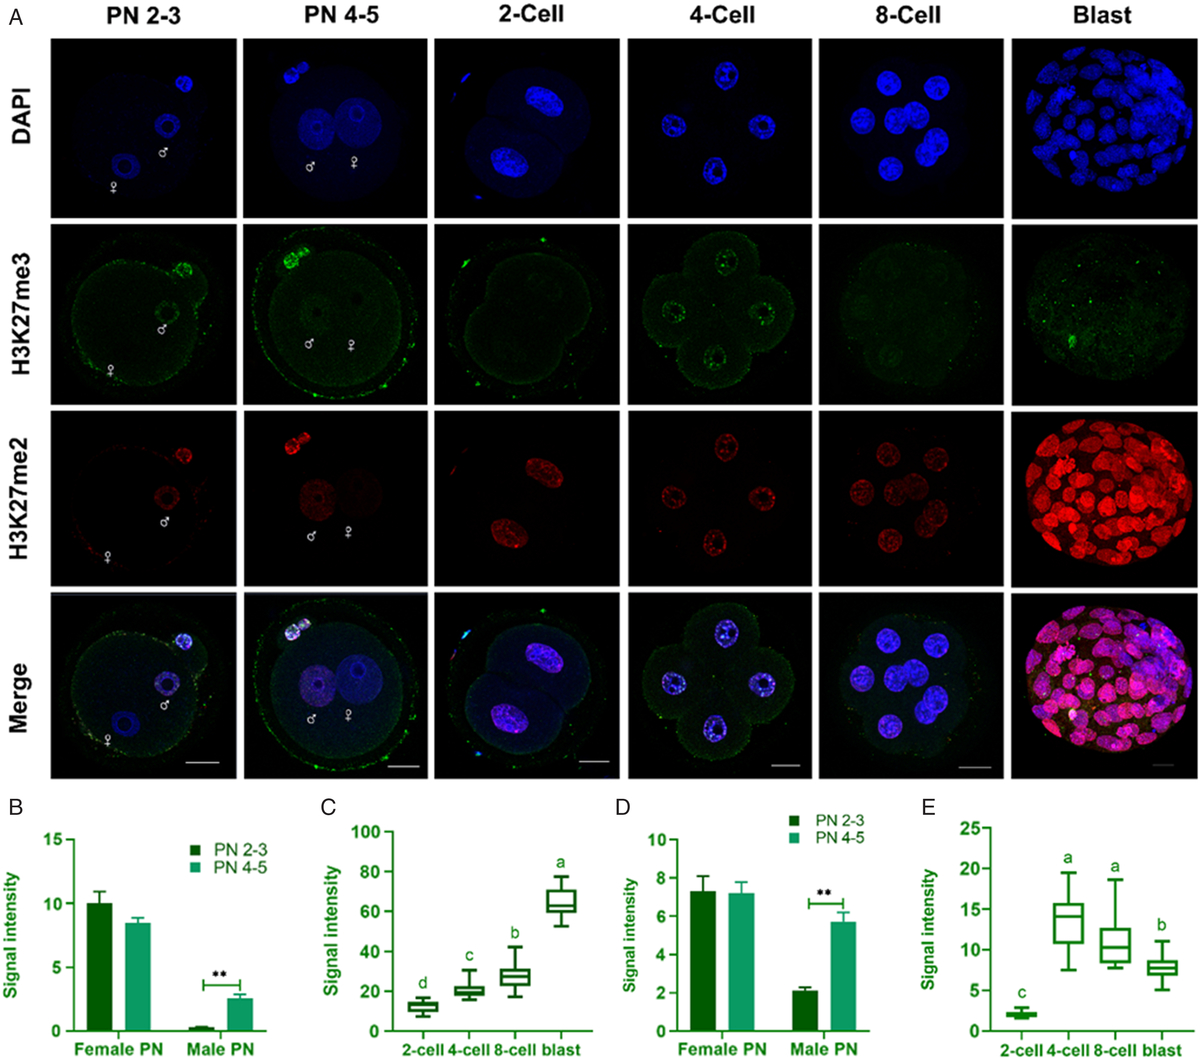
Di-methylation and tri-methylation of H3K27 is also linked with repression of transcription. As shown in Fig. 4, H3K27me2 was present throughout the process from pronucleus to early blastocysts. In both PN stages 2–3 and 4–5, H3K27me2 was exclusively and strongly stained in the female pronucleus. In the male pronucleus, H3K27me2 was not detectable in PN stage 2–3 embryos and weakly stained in PN 4–5 stage embryos (Fig. 4 A, B). From 2- to 8-cell stage embryos, the expression level of H3K27me2 was statistically increased and reached its highest level in the early blastocysts (Fig. 4 A, C).
Dynamics exchange of H3K27me2 and H3K27me3 during ZGA. (A) H3K27me2 was exclusively expressed in the female pronucleus and the signal remained statistically unchanged until the blastocyst stage; H3K27me3 staining was decreased in the female pronucleus, but increased in the male pronucleus during minor ZGA. (B, C) Statistical analysis of the H3K27me2 signal in the pronucleus and cleavage-stage embryos. (D, E) Statistical analysis of the H3K27me3 signal in the pronucleus and cleavage-stage embryos. Nuclei were counterstained with 4′,6-diamidino-2-phenylindole (DAPI, blue). H3K27me2 and H3K27me3 were labelled with anti-H3K27me2 (red) and anti-H3K27me3 (green) antibodies, respectively. The bottom panel shows merge images of the corresponding Z-sections of DNA, H3K27me2 and H3K27me3. Embryos were analysed under confocal microscopy under the same conditions and in parallel. Scale bar represents 20 μm.

H2K27me3 was particularly stained in the female pronucleus in PN stage 2–3 and detected in both male and female pronuclei in PN stage 4–5. Staining of H3K27me3 was weak in the 2-cell stage embryos, increased in 4-cell stage embryos, decreased in 8-cell stage embryos and was barely detectable in early blastocysts (Fig. 4 A, D, E).
Dynamics of H3K36me2 and H3K36me3 during ZGA
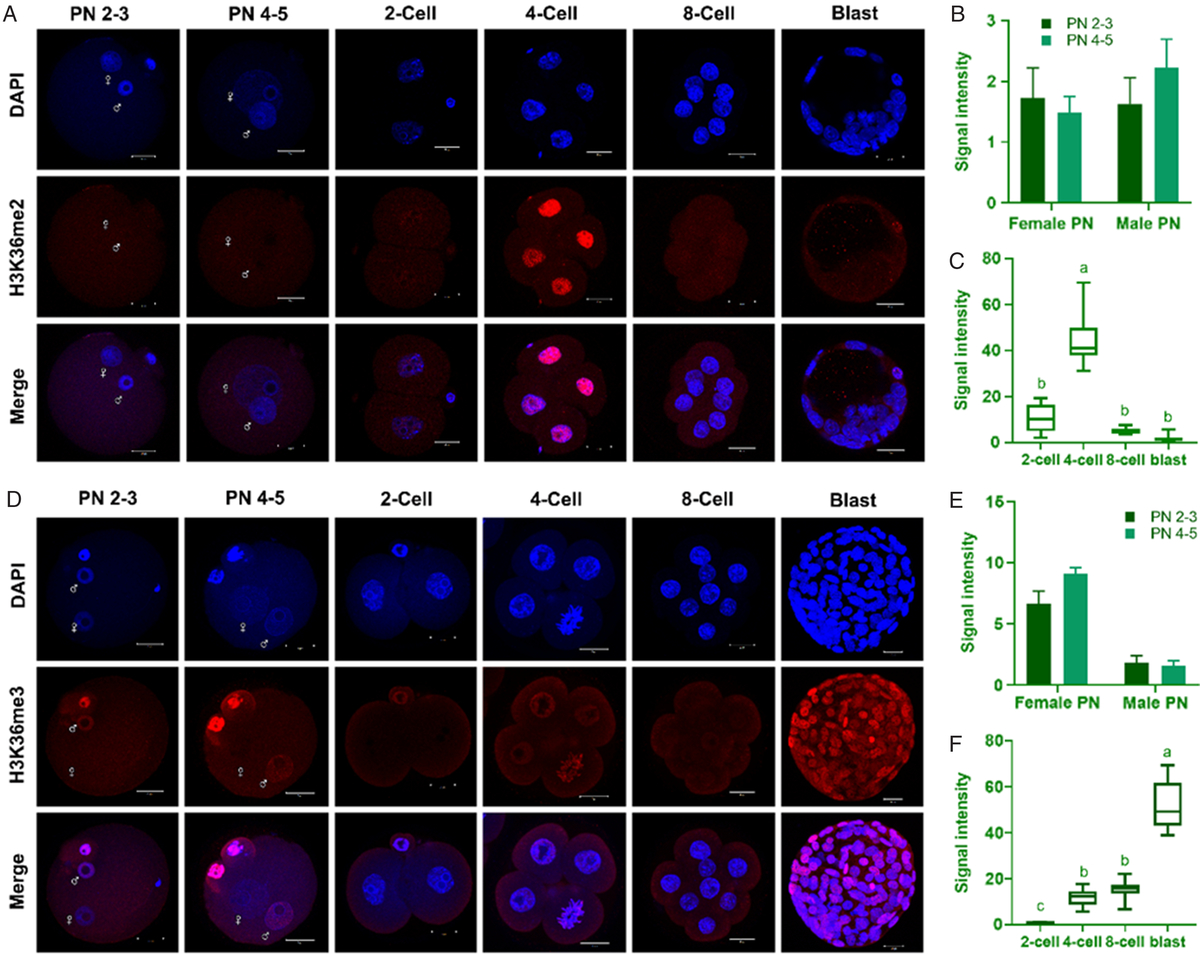
Methylation on H3K36 is involved in active transcription. H3K36me2 was undetectable until the 2-cell stage, but demonstrated strong staining in the 4-cell stage embryos. In the 8-cell stage embryos and early blastocysts, H3K36me2 was weakly stained (Fig. 5 A–C). Unlike H3K36me2, H3K36me3 was moderately stained in the female pronucleus in PN stages 2–3 and PN 4–5, but disappeared in the 2-cell stage embryos. In the 4- and 8-cell embryos, H3K36me3 was present but not statistically changed. In the early blastocyst, H3K36me3 showed the highest expression (Fig. 5 D–F). These data suggest that H3K36me3 may be linked with embryonic pluripotency.
Dynamics of H3K36me2 and H3K36me3 during ZGA. (A–C) H3K36me2 was weakly stained in 2-cell stage embryos and strongly stained in 4-cell stage embryos, however it was not detected at other stages. (D–F) H3K36me3 was exclusively expressed in the female pronucleus and disappeared in 2-cell stage embryos, however its expression increased from 4-cell stage embryos to blastocysts. Nuclei were counterstained with 4′,6-diamidino-2-phenylindole (DAPI, blue). H3K36me2 and H3K36me3 were labelled with anti-H3K36me2 (red) and anti-H3K36me3 (red) antibodies, respectively. The bottom panel shows merge images of the corresponding Z-sections of DNA and H3K36me2, DNA and H3K36me3, respectively. Embryos were analysed under confocal microscopy under the same conditions and in parallel. Scale bar represents 20 μm.

Discussion
ZGA is a crucial stage of early development. Recent studies have demonstrated that histone methylation and variants play vital roles during embryogenesis. Therefore, in the present study, we investigated the dynamics of several histone modifications and histone variants during mouse ZGA. Our data revealed that histone variants and methylation was dynamically exchanged during ZGA. We further inferred that macroH2A1, H2A.Z, H3K9me2/3 and H3K27me2/3 may play crucial roles during mouse ZGA.
Di-methylation and tri-methylation of H3K9 is associated with gene repression. In the present study, staining of H3K9me3 reached its lowest level during major ZGA, This finding is consistent with the results reported in goat (Deng et al., Reference Deng, Liu, Ren, Zhang, Pang, Zhang, Wang and Wan2018) and bovine (Liu et al., Reference Liu, Wang, Gao, Su, Zhang, Xing, Zhou, Yao, An and Zhang2018), Furthermore, our data showed that H3K9me3 was strongly stained in the female pronucleus, but weakly stained in the male pronucleus, which is in line with the results observed in sheep (Hou et al., Reference Hou, Liu, Zhang, Cui, Yan, Guan, Chen and An2008). H3K9me2 was detectable through all the stages in mouse and bovine (Lepikhov et al., Reference Lepikhov, Yang, Wrenzycki, Zakhartchenko, Niemann, Wolf and Walter2005). Moreover, H3K9me2 was highly expressed in the female pronucleus instead of the male pronucleus (Lepikhov et al., Reference Lepikhov, Zakhartchenko, Hao, Yang, Wrenzycki, Niemann, Wolf and Walter2008), as shown in the present study. However, Lepikhov et al. reported that H3K9me2 was hardly detectable after bovine and rabbit ZGA (Lepikhov et al., Reference Lepikhov, Yang, Wrenzycki, Zakhartchenko, Niemann, Wolf and Walter2005), which may be explained by the specificity of the H3K9me2 antibody. Of note, the exclusive strong staining of H3K9me2 and H3K9me3 in the female pronucleus was consistent with the notion that the paternal genome onsets transcription first (Park et al., Reference Park, Jeong, Shin, Lee and Kang2007; Svoboda, Reference Svoboda2017; Schulz and Harrison, Reference Schulz and Harrison2019).
Methylation on H3K27 can be catalyzed by enhancer of zeste homolog 2 (EZH2) and demethylated by lysine specific demethylase 6A (Kdm6a) and Kdm6b. In the present study, we found that H3K27me3 was strongly stained in the female pronucleus in PN stage 2–3 and became detectable in the male pronucleus during minor ZGA, suggesting that H3K27me3 is in involved in reprogramming. Chung et al. reported that demethylation of H3K27me3 is required for normal development of bovine preimplantation (Chung et al., Reference Chung, Bogliotti, Ding, Vilarino, Takahashi, Chitwood, Schultz and Ross2017). Cao et al. reported H3K27me3 was strongly stained in the 1-cell embryo, but weakly stained after 2-cell stage embryos in porcine (Cao et al., Reference Cao, Li, Chen, Wang, Zhang, Zhou, Wu, Ling, Fang, Li and Zhang2015). Consistent with these studies, we detected loss of the H3K27me3 signal in 4-cell stage embryos and subsequently. H3K27me2 was detectable through all the stages in the mouse (Huang et al., Reference Huang, Wang, Ma, Sun, Zhou, Zhu and Liu2014) and porcine (Cao et al., Reference Cao, Li, Chen, Wang, Zhang, Zhou, Wu, Ling, Fang, Li and Zhang2015), a similar result was found in our study. Moreover, studies revealed that knockdown of Kdm6b and EZH2 resulted in a lower percentage of blastocyst (Huang et al., Reference Huang, Wang, Ma, Sun, Zhou, Zhu and Liu2014; Chung et al., Reference Chung, Bogliotti, Ding, Vilarino, Takahashi, Chitwood, Schultz and Ross2017), suggesting that early embryo development was finely regulated by H3K27me3. Moreover, the present and previous studies revealed that removal of H3K27me3 during ZGA was crucial for preimplantation (Chung et al., Reference Chung, Bogliotti, Ding, Vilarino, Takahashi, Chitwood, Schultz and Ross2017; Zhou et al., Reference Zhou, Wang, Zhang, Su, An, Liu, Zhang, Wang, Liu and Zhang2019).
H3K36me3 is enriched in active genes in the mammalian genome. In the present study, H3K36me3 was exclusively presented in the female pronucleus during minor ZGA, consistent with the results reported by Bošković et al. (Reference Bošković, Bender, Gall, Ziegler-Birling, Beaujean and Torres-Padilla2012). H3K36me3 was hardly detectable in major ZGA, consistent with the results observed in bovine (Bošković et al., Reference Bošković, Bender, Gall, Ziegler-Birling, Beaujean and Torres-Padilla2012). It has been reported that H3K36me3 marks Pol II elongation (Lindeman et al., Reference Lindeman, Andersen, Reiner, Li, Aanes, Østrup, Winata, Mathavan, Müller, Aleström and Collas2011), which should be activated during ZGA (Schultz et al., Reference Schultz, Stein and Svoboda2018). In contrast, H3K36me3 was weakly stained in the whole embryo level. Therefore, the distribution of H3K36me3 required further investigation at single-base resolution.
Consistent with our data, it has been reported that macroH2A is preferentially found in the mouse female pronucleus and persists in morulae and blastocysts (Chang et al., Reference Chang, Ma, Jacobs, Tian, Yang and Rasmussen2005). Given that macroH2A is a repressive H2A variant and should be progressively lost as the embryo becomes transcriptionally active, therefore, it was not detected in major ZGA. In contrast, embryonic H2A.Z is detectable throughout the embryogenesis and symmetric distributed in the male and female pronucleus, consistent with the results reported by Bošković et al. (Reference Bošković, Bender, Gall, Ziegler-Birling, Beaujean and Torres-Padilla2012). Moreover, our data are consistent with the notion that H2A.Z is required for early development (Faast et al., Reference Faast, Thonglairoam, Schulz, Beall, Wells, Taylor, Matthaei, Rathjen, Tremethick and Lyons2001). Histone H3.3 is an oocyte exchange factor that plays roles in maintaining the decondensed chromatin state, allowing gene transcription (Lin et al., Reference Lin, Conti and Ramalho-Santos2013; Wen et al., Reference Wen, Banaszynski, Liu, Geng, Noh, Xiang, Elemento, Rosenwaks, Allis and Rafii2014). Consistent with this notion, we found that H3.3 was presented from minor ZGA to 4-cell stage embryos.
In conclusion, microH2A1, H3K9me2, H3K9me3, H3K27me3 and H3K36me3 were asymmetrically stained, while H2A.Z and H3.3 were symmetrically stained during ZGA. Our data suggested that macroH2A1, H2A.Z, H3K9me2/3 and H3K27me2/3 may play crucial roles during mouse ZGA, which warrants further investigation of loss and gain of function during embryogenesis.
Acknowledgements
The authors would like to express their gratitude to Jiangsu Livestock Embryo Engineering Laboratory and Jun Liu from Northwest A&F University for their full support.
Financial support
This study was supported financially by grants from the National Natural Science Foundation of China (No. 31672422).
Ethical standards
All the experimental procedures involving animals were conducted according to the National Research Council’s publication Guide for the Care and Use of Laboratory Animals and approved by the Committee of Institutional Animal Care and Use at Nanjing Agricultural University, China.
Declaration of interest
The authors declare that there is no conflict of interest that could be perceived as prejudicing the impartiality of the research reported.
Supplementary material
To view supplementary material for this article, please visit https://doi.org/10.1017/S0967199419000649