Implications
Manure management is associated with considerable emissions of ammonia and greenhouse gases, which are harmful for the environment. Moreover, a precise knowledge of manure characteristics could improve the economical and environmental impacts of spreading. However, current methodologies are inadequate with respect to proper accounting of local climate and management. This paper presents a model predicting the effects of actual on-farm conditions and climate on manure characteristics and gaseous emissions in the animal housing and during manure storage and treatment. The equations are partially based on expert judgements, and partially on functions parameterised on the basis of literature data.
Introduction
Manure is an important source of ammonia (NH3) and greenhouse gases (GHG), with recognised detrimental effects on the environment (Steinfeld et al., Reference Steinfeld, Gerber, Wassenaar, Castel, Rosales and de Haan2006). Approximately, 90% of NH3 emissions would be due to agriculture, in several European countries, 40% of which coming from animal housing and manure storage (Pain et al., Reference Pain, Van der Weerden, Chambers, Phillips and and Jarvis1998; Misselbrook et al., Reference Misselbrook, Van Der Weerden, Pain, Jarvis, Chambers, Smith, Phillips and Demmers2000). NH3 emissions can lead to health issues for farmers and animals. NH3 emitted may also be transported in the air near the farm or over long distances in ammonium form. This may have detrimental consequences on crops, ecosystem eutrophication or soil acidification (Steinfeld et al., Reference Steinfeld, Gerber, Wassenaar, Castel, Rosales and de Haan2006). Greenhouse gases emitted from manure are nitrous oxide (N2O) and methane (CH4). N2O is a powerful GHG, which contributes 296-fold more than carbon dioxide (CO2) to global warming in a 100-year horizon (Intergovernmental Panel on Climate Change (IPCC), 2006). Carbon flows lead to CO2 and CH4 emissions, which are other GHG. CH4 contributes 23-fold more than CO2 to global warming (IPCC, 2006). In 1995, agriculture in the European union emitted 470 Tg CO2-equivalents, of which 56% originated from N2O, 36% from CH4 and 8% from CO2 (Freibauer, Reference Freibauer2003). Manure in livestock production systems is also a valuable source of nutrient for crops and organic matter (OM) for soils, but its utilisation can also lead to pollutions such as nitrate leaching, P run-off or heavy metal accumulation. In fact, manure management has a key role in the agroecosystem, and should be precisely balanced with crop production. Therefore, the definition of sustainable manure management systems requires a precise evaluation of both harmful gas production and manure characteristics (mass, volume, nutrient contents, OM, etc.) (Burton and Turner, Reference Burton and Turner2003).
Nutrient and matter flows in manure management systems can be evaluated through sampling and analysis, but this approach is expensive and difficult to achieve in commercial conditions. Particularly, gaseous emission measurement is almost impossible in most on-farm situations. Another alternative is the utilisation of mathematical models that can predict these environmental hazards from the available on-farm information. Two main kinds of models can be distinguished: empirically based models use few variables associated with an emission factor (EF), sometimes combined with some additional factors that are applicable for a certain set of conditions. Such models correspond to national or international reviews such as the European Union (EU) emission inventory program (EMEP/CORINAIR) (Dämmgen and Webb, Reference Dämmgen and Webb2006) for NH3, and IPCC (2006) for GHG. In the IPCC approach (Tier 1, IPCC, 2006), CH4 and N2O emissions are estimated with specific EF given per animal category, and country or region. For CH4, a more detailed approach has been proposed, where EF is related to maximum CH4 production potential for a given manure type, volatile solid (VS) content of manure, as estimated from animal diet (dry matter (DM) intake, energy digestibility and ash content), and a CH4 conversion factor that takes climate and type of manure storage into account (Tier 2, IPCC, 2006). However, compared to the wide diversity of practices, empirical models remain imprecise because they do not sufficiently take into account farmer practices and climatic conditions. For example, storage practices are generally grouped according to manure total solids content in solid (>20%), semi-solid (10%–20%) and liquid systems (<10%), whereas emissions could be contrasted within each category, depending on farmer practices. This could lead to misleading evaluation of some systems (Monteny et al., Reference Monteny, Groenestein and Hilhorst2001). On the other hand, mechanistic models attempt to describe the processes at detailed levels (molecular or cellular). Emissions are simulated as the result of physicochemical reactions controlled by key factors (such as pH or O2) and possibly by microbial consumption/production. Such models have been published to predict NH3 emissions, particularly for slurry in animal housing (Aarnink and Elzing, Reference Aarnink and Elzing1998; Dourmad et al., Reference Dourmad, Moset-Hernandez, Espagnol, Hassouna and Rigolot2008) and/or outside (Berthiaume et al., Reference Berthiaume, Bigras-Poulin and Rousseau2005). Mechanistic models have also been developed, to a lesser extent, for GHG. Sommer et al. (Reference Sommer, Petersen and Moller2004) proposed algorithms to quantify CH4 emissions from liquid manure during storage, and N2O emissions from soils after field application of slurry. Models have also been developed for treatment processes, notably biological N removal process (Béline et al., Reference Béline, Boursier, Daumer, Guiziou and Paul2007), composting process (Sole-Mauri et al., Reference Sole-Mauri, Illa, Magrı, Prenafeta-Boldu and Flotats2007) or anaerobic digestion (SAN). However, such mechanistic models are often built from laboratory experiments, and their use remains very limited on a real scale. They often require key parameters that cannot be easily predicted (such as manure pH), which are not available on farm.
Therefore, there is a need to develop intermediary approaches taking into account the effect of farmer practices and climate more precisely than current reference methodologies, and more easily achievable at farm scale than mechanistic models (Nicholson et al., Reference Nicholson, Webb and Moore2002; National Research Council (NRC), 2003). Such intermediary models must also be comprehensive and multicriterion, because the introduction of a technology for reducing for instance one source of gaseous pollution may enhance the emission of this gas elsewhere or of another gas (Petersen et al., Reference Petersen, Sommer, Béline, Burton, Dach, Dourmad, Leip, Misselbrook, Nicholson, Poulsen, Provolo, Sørensen, Vinneras, Weiske, Bernal, Böhm, Juhász and Mihelic2007). However, the range of manure management options gets wider, whereas knowledge about their effects remains relatively scattered, because many studies focus on few systems and on one or few particular concerns (e.g. NH3). Another difficulty for synthesis lies in the numerous different units used in literature (mass of gas per volume (or mass) of manure per time unit, per surface area, per mass of added VS per time unit, as a percentage of corresponding nutrient input, etc.). This limits the comparison and homogenisation of studies.
Objectives
In this context, the purpose of this work was to build a model to simulate manure evolution and gaseous emissions from pig excretion up to late storage just before spreading or export, for contrasted manure management. This model would further support the development at the pig unit level, including a first model predicting animal excretion (Rigolot et al., Reference Rigolot, Espagnol, Pomar and Dourmad2010). The objective of this paper is to present the building of the model, with an original approach based on a mix of expert judgement, reference methods, mechanistic models and literature surveys, which could be used in other contexts.
For animal housing, the model must be able to simulate slatted floor with production of slurry or deep litter with production of solid manure (while outdoor production is not included in the present model). Treatment processes included in the model correspond to some of the most widespread and/or promising systems in France and Europe. For slurry, they are biological N removal process and slurry composting (SC) with straw, which represent about 80% and 15% of treatments implemented in French pig farms, respectively (Levasseur et al., Reference Levasseur, Le Bris, Gorius and Le Cozler2003). Biological N removal treatment consists in consecutive aerobic and anaerobic processing of slurry allowing N removal by nitrification and denitrification. Slurry composting with straw consists in the spreading of fattening pigs’ slurry on straw followed by mixing to produce compost (Guernevez® process). Moreover, the model also includes slurry SAN option, which is becoming increasingly popular in several countries. This process degrades OM of slurry into biogas to produce energy. For solid manure, an additional composting outdoor process is also quite common in pig farms, especially in organic farming.
The model aims at taking into account the main effects of farmer practices for given housing, storage and treatment systems, as well as the effects of climatic conditions. Farmer practices correspond to all possible interventions by the farmer for a given infrastructure. It refers to litter and slurry management inside and outside the building, as well as during solid manure composting (MC).
Model description
General description
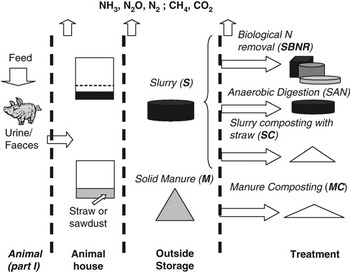
The model presented in this paper is built in three steps: (i) animal housing (ii) outside storage and (iii) manure treatment. These steps are constructed with a mass-balance approach: nutrient, water and matter amounts in manure are calculated at each step as the difference between inputs and outputs, and the processes at one step depend on what happened at the previous step. Animal housing and outside storage includes two main options: slurry or solid manure management, which are presented separately in this paper. Inputs of the animal housing step are animal excretion (described in Rigolot et al., Reference Rigolot, Espagnol, Pomar and Dourmad2010) and litter. Inputs of the outside storage step are rain and manure transferred from the animal housing. Outputs from both steps are gaseous emissions and manure transferred to the next step. Manure treatment includes four options corresponding to the objectives: biological N removal, SAN, SC with straw and MC (Figure 1). Inputs of manure treatment are manure coming from stores and additional matter and rain, and outputs are gaseous emissions and manure composition before spreading or export. Gaseous emissions are expressed in various units. Particularly, GHG emissions are expressed in kg CO2eq (carbon dioxide equivalent) by weighting N2O and CH4 emissions with their global warming potential for 100 years (IPCC, 2006). Carbon dioxide emissions are not taken into account for this output, considering they are involved in the carbon short-term cycle, with no obvious effect on global warming.
A schematic diagram of the model. Two main options are available for manure management in animal house and outside storage: S, slurry; M, solid manure. Three main options are available for slurry treatment (SBNR, biological nitrogen removal; SAN, anaerobic digestion; SC, slurry composting with straw) and one option for solid: MC, manure composting.

An empiric approach is developed, and the model is built by an expert panel composed of specialists in animal housing and manure storage and treatment. Gaseous emissions are calculated with an EF, weighted by the product of several variation factors (VFs) (equation
(1)). Variations factors are identified (qualitatively) and their effect is weighted (quantitatively) by the experts, from published mechanistic models, from the literature or from their own expertise, depending on the available information. A first work during model building was to identify these parameters, and then to quantify them.

The unit of the EF depends on the nature and/or the knowledge of the emission process. For example, NH3 EF in the building is expressed as a percentage of excreted N, whereas NH3 EF in the slurry tank is expressed per square metre, considering it firstly depends on the surface involved. The units of VFs balance the equation, but VFs can also be dimensionless (VF < or > 1 if decreasing or increasing the basic emission, respectively). The effects of VFs are weighted either with continuous equation (e.g. effect of temperature on slurry emissions) or with specific VF value given for different classes (e.g. ‘careful’, ‘normal’ or ‘careless’ litter management). For several VFs, nutrient flow variability is high within a class defined by the experts. For example, the effect of slurry store covering on gaseous emissions depends on cover type. For simplicity and homogeneity reasons, additional classes have not been defined, which define the limitations and applicability of equations. However, the user may fit the model according to the specific situation he has to evaluate.
Emissions and evolution of manure composition in the building and during outside storage
N emissions
N losses from manure may occur mainly as NH3, N2O or N2. Emissions during indoor and outdoor storage are calculated separately, as mentioned in the general description of the model. In the building, the EF corresponds to a volatilisation coefficient applied to N input (i.e. the sum of N excreted and possibly N amount in the added bedding material). For the outside storage period, the EF is expressed in g/m2 per day for NH3 when slurry is stored, and in kg N/kg N stored for other gases or when solid manure is stored.
Liquid management of manure
The transcription of equation (1) for NH3 emission in the buildings with slurry collection is as follows (equation
(2)):

The EF is 0.24 kg N-NH3/kg N excreted. It was estimated as the difference of measured N in slurry of pigs in 52 experiments and a simulation of raw N excretion (Dourmad et al., Reference Dourmad, Guingand, Latimier and Sève1999; Rigolot et al., Reference Rigolot, Espagnol, Pomar and Dourmad2010). Factor (17/14) aims at converting the results into kg NH3. VFs associated with NH3 volatilisation from the building (Guingand, Reference Guingand1996; Aarnink, Reference Aarnink1997) are mainly N excreted (kg), slurry dilution (VFNDilution), slurry temperature (VFTemp), air ventilation (VFVentilation), type of floor (VFFloor) and frequency of slurry flushing (VFFrequency) (equation (2)). These effects are evaluated through empirical relationships available in the literature or adapted from the model proposed by Aarnink and Elzing (Reference Aarnink and Elzing1998).
VFNDilution (equation
(2a)): the NH3 concentration (TAN) of fresh slurry is calculated from urinary N (see part I). In the studies used to estimate the value of EF, average NH3 concentration of fresh slurry is 0.51 mol/l. For this NH3 concentration the value of VFNDilution is fixed at 1 and it becomes 0.88 and 1.13 when NH3 concentration decreases or increases by 20%, respectively (Aarnink and Elzing, Reference Aarnink and Elzing1998).

VFTemp (equation
(2b)): when slurry temperature is 22°C, which was the average value in the studies reviewed by Dourmad et al. (Reference Dourmad, Guingand, Latimier and Sève1999), the value of VFTemp is fixed at one. It becomes 0.77 and 1.24 when slurry temperature decreases or increases by 20%, respectively (Aarnink and Elzing, Reference Aarnink and Elzing1998). Slurry temperature is estimated from ambient temperature (T°) using a relationship derived from the study of Granier et al. (Reference Granier, Guingand and Massabie1996).

VFVentilationRate (equation
(2c)): is estimated considering that changes in air speed are proportional to changes of air ventilation rate. When air ventilation rate is of 0.6 m3/kg BW per hour, which was the average value in the studies reviewed by Dourmad et al. (Reference Dourmad, Guingand, Latimier and Sève1999), the value of the coefficient VFVentilationRate is fixed at 1. The effect of air ventilation rate on NH3 volatilisation is then estimated according to Aarnink and Elzing (Reference Aarnink and Elzing1998), the coefficient VFVentilationRate becoming 0.92 and 1.08 when air ventilation rates are decreased or increased by 20%, respectively.

VFFloor (equation
(2d)): a reduction of 20% is retained as default value when the floor is partially slatted, and 15% for metallic slatted floors (Hoeksma et al., Reference Hoeksma, Verdoes, Oosthoek and Voermans1992). However, there is great uncertainty on this value because it was not corroborated by Guingand and Granier (Reference Guingand and Granier2001).

VFFrequency (equation
(2e)): Ammonia volatilisation is higher when the slurry is stored for long periods under the animals, as is often the case in France, and decreases when the frequency of slurry removal increases (Hoeksma et al., Reference Hoeksma, Verdoes, Oosthoek and Voermans1992; Voermans and van Poppel, Reference Voermans and van Poppel1993; Guingand, Reference Guingand2000). For instance, a weekly or a daily flushing of the slurry reduces NH3 emissions by 20% and 35%, respectively, compared to a storage lasting more than 4 weeks.

Ammonia EF from the outdoor slurry tank is expressed on an area basis (0.6 g NH3/m2 per day). This factor and the relationship proposed to integrate VFs is based on Pelletier et al. (Reference Pelletier, Godbout, Larouche, Lemay and Marquis2006) equation
(3).

VFTemperature (equation
(3a)): is calculated with the following exponential relationship, where slurry temperature is estimated from external air temperature with a relationship found in the same study of Pelletier (Pelletier F, personal Communication).

where R 2 = 0.92.
VFNDilution (equation
(3b)): is a correction factor applied in order to take into account the effect of ammoniacal N concentration (TAN, in mg/kg) on the basis of that (1.03 mg/kg) in the study of Pelletier et al. (Reference Pelletier, Godbout, Larouche, Lemay and Marquis2006).

VFCover is 1 when slurry tank is not covered. For covered tank, 0.2 has been proposed as a default value from the expert’s expertise. However, more precise estimation could be used to take into account cover type or wind speed (Olesen and Sommer, Reference Olesen and Sommer1993). Surface area (m2) is calculated according to storage time required and height of slurry tank, and storage time is expressed in days.
When slurry is produced, N2O and N2 emissions are very low. In the model, N losses in N2O form are estimated as a fixed percentage (0.2%) of N excreted (in the building), or of N stored (in the slurry tank) (IPCC, 2006). N2 emission is estimated considering a ratio (N2O/N2) equal to 1 : 5 (Loyon et al., Reference Loyon, Guiziou, Béline and Peu2007).
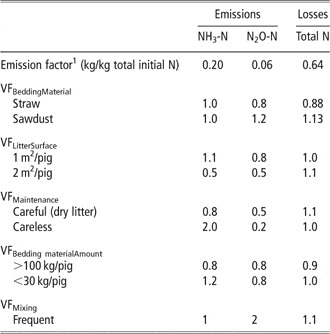
Deep litter system
FEs for total N losses (equation
(4)), NH3 (equation
(5)) and N2O (equation
(6)) emissions from the building have been determined from a review of 39 experiments (in Lesguiller et al., Reference Lesguiller, Gouin, Guiziou and Orain1995; Nicks et al., Reference Nicks, Désiron and Canart1995; Kaufmann, Reference Kaufmann1997; Kermarrec, Reference Kermarrec1999; Robin et al., Reference Robin, de Oliveira and Kermarrec1999; Texier et al., Reference Texier, Levasseur and Vaudelet2000; Texier and Levasseur, Reference Texier and Levasseur2001; Ramonet and Robin, Reference Ramonet and Robin2002; Comité d’Orientation pour des Pratiques agricoles respectueuses de l’Environnement (CORPEN), 2003). On average, 64% of N input is emitted into the air, 20% in the form of NH3 and 6% in the form of N2O (the remaining in the form of N2) (Table 1). The effects of the VFs in the building are evaluated from empirical relationships available in the literature or estimated by experts notably in the review used to determine EFs, but also with additional references from De Bode (Reference De Bode1991), Groenestein and Van Faassen (Reference Groenestein and Van Faassen1996), Jungbluth et al. (Reference Jungbluth, Hartung and Brose2001) and Amon et al. (Reference Amon, Kryvoruchko, Fröhlich, Amon, Pöllinger, Mösenbacher and Hausleitner2007). VFs are detailed here for a growing period (30 to 110 kg). They are bedding material type (VFBeddingMaterialType), litter surface per animal (VFLitterSurface), litter amount (VFLitterAmount), litter mixing frequency (VFMixing) and litter management, which affect litter moisture (VFManagement). All VFs are dimensionless and their values are given in Table 1.


VFBeddingMaterialType: this can be clearly identified from the literature survey. Total N losses correspond to 56% ± 13% and 72% ± 8% of total N, for straw and sawdust based systems, respectively. Bedding material type influences N2O emissions for both post-weaning and fattening pigs (Nicks et al., Reference Nicks, Laitat, Desiron, Vandenheede and Canart2002). In most cases, observed emission was lower for straw and higher for sawdust.
Emission factors and VF for solid manure in pig housing (from literature and expert knowledge)

NH3 = ammonia; N2O = nitrous oxide; N = nitrogen; VF = variation factor.
1Emission factor is the average emission or loss measured among all situations of a 39 experiments review (in CORPEN, 2003).
VFLitterSurface: when the litter area per animal is large, exchanges with the air increase. This results in higher total N losses. This would be due to higher losses in the form of N2, because both NH3 and N2O emissions are reduced with larger litter area per animal. In the literature survey, NH3 emissions correspond to between 5% and 15% of total N excreted for large litter area (low-animal density), and between 15% and 25% for usual area. Concerning N2O, Hassouna et al. (Reference Hassouna, Robin, Texier and Ramonet2005) mentioned emissions between 2% and 8% for large litter area and between 4% and 12% for usual area.
VFManagement: a ‘careful’ management corresponds to particularly appropriate supplies of straw during the growing period (the right amount at the right moment and at the right location in the pen, resulting in a dry litter at the end of the growing period). Careful management is associated with higher total N losses. It also facilitates N immobilisation, which tends to decrease the emissions of NH3. On the contrary, careless management results in very high emissions of NH3, up to 60% of initial N in extreme situations (Ramonet and Robin, Reference Ramonet and Robin2002), because of higher moisture content and inhibition of N immobilisation. N2O emissions are reduced, because careless management alters nitrification and denitrification processes.
VFMixing: total N gas emissions increase for a few days after mixing, therefore a VF (+10%) is attributed to frequently mixed litter. Moreover, the effect of frequent mixing on N2O emissions (due to induced aeration) has been clearly identified (Kermarrec, Reference Kermarrec1999).
VFBeddingMaterialAmountt: a large amount of bedding material (straw or sawdust) may facilitate N immobilisation. However, between supplies of 30 and 100 kg straw per fattening pig (which include most of the practical situations), no effect of the amount of bedding material appears from the literature survey, revealing the predominance of management effect. N2O emissions are reduced when the amount of bedding material is very high (higher N immobilisation) or very low (high-moisture content).
Other factors may influence N2O emission, such as temperature or microbial composition, but knowledge is still insufficient to propose weighted coefficients.
During outside storage, emissions are estimated as a simple percentage of stored N (no VFs), because experts did not estimate any clear effect of climatic conditions (rain and temperature) either from the literature survey or their own expertise. Assumptions to build the model come from the experiments of Espagnol et al. (Reference Espagnol, Hassouna, Robin, Levasseur and Paillat2006) who found N losses corresponding to 27% of stored N, of which 7.3% in the N-NH3 form and 3.2% in the N-N2O form. However, as for slurry tank covering, emission variability is probably high between solid manure storage conditions, and other estimations could be more appropriate for specific conditions (Petersen et al., Reference Petersen, Lind and Sommer1998).
Carbon emissions
CH4 estimations are based on IPCC Tier 2 methodology (IPCC, 2006, equation
(7)), with some adaptations in order to consider the effects of temperature and storage duration inside and outside the building, as proposed by Sommer et al. (Reference Sommer, Petersen and Moller2004).

with: VS, VSs, roughly considered as OM amount (kg); B0, maximum CH4 producing capacity (m3/kg DM); methane conversion factor (MCF), CH4 conversion factor for the management system considered (slurry or deep litter).
VS is an input of the model calculated from excreted OM (given by part I, Rigolot et al., Reference Rigolot, Espagnol, Pomar and Dourmad2010) and B0 is taken from IPCC (2006). To integrate farmer practices, specific MCF are calculated for slurry management by modulating IPCC default value by temperature and storage time inside and outside the building. The effect of storage time is simply calculated proportionally to reference storage time. Temperature effect is calculated by an Arrhenius relationship parameterised from the study of Vedrenne (Reference Vedrenne2006) (equation
(8)).

Parameter Φ is a constant estimated as 1.12 by Vedrenne (Reference Vedrenne2006) and TempEffluent is slurry temperature, estimated as previously mentioned in the building and in the outside store.
Manure characteristics after storage
Most manure characteristics are obtained by a mass-balance approach: nutrient and matter amounts. The total weight of the effluent is obtained by adding the amounts of water and DM. However, the prediction of water amount requires additional assumptions. For liquid management, effluent water amount is the sum of excreted water, cleaning water and rainwater, minus water evaporated. Cleaning water is a parameter of the model. Added rainwater and evaporated water are calculated from the surface of the outside store (if not covered) and precipitation amount or potential Penman evaporation, respectively, which are parameters of the model. For solid management, water content is simply calculated from DM amount in the effluent, considering from expert knowledge that DM proportion in solid manure is equal to 40%, 30% and 20% when litter management was ‘careful’ ‘normal’ and ‘careless’, respectively.
Emissions and manure evolution during treatment
For slurry SAN, gaseous emissions and manure characteristics are calculated in two steps: the treatment process itself and the storage of the products. Conversely, for SC, they are calculated in one step, considering that the process continues up to the use of the product. In addition, for biological N removal, the storage of end products is considered as part of the process in this paper, which means that storage time is not a VF, but corresponds to a reference. However, a user of the model could easily integrate own references or additional VFs to parameter the processes. In the special case of MC, emissions are calculated as proposed by equation (1), because they could be easily modified by adopting other composting management practices without any significant infrastructure changes.
Anaerobic digestion of slurry
Manure evolution and gaseous emissions during SAN depend on substrate, retention time and temperature. We consider the case with no gaseous leak during slurry digestion, and therefore N losses are not taken into account. Furthermore, all the carbon in the biogas is considered to be emitted in CO2 form, when burned to produce energy. The amount of OM converted into biogas during the process can be expressed as a B0 fraction. Moreover, mineralisation of organic N, which is important during the digestion process, must also be parameterised. For the simulations presented in this paper, SAN parameters were fitted from the study of Vedrenne (Reference Vedrenne2006). In the study, 85% of slurry B0 was converted into biogas, and 30% of initial organic N turned to NH3 fraction. During the storage of digested slurry, CH4 emissions are estimated as 63% lower than those calculated for raw-slurry storage during the same period (Vedrenne, Reference Vedrenne2006). Other emissions and slurry evolution during post-processing storage are calculated as for raw slurry storage.
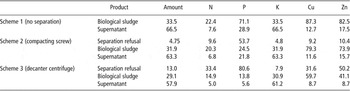
Biological N removal
Matter and gaseous flows during aerobic treatment of slurry have been modelled by Béline et al. (Reference Béline, Daumer and Guiziou2004) and Loyon et al. (Reference Loyon, Guiziou, Béline and Peu2007), respectively, for the three main treatment schemes found in France. In these schemes, the nitrification and denitrification processes are associated with other slurry manipulations. In a first scheme (scheme 1), raw slurry is directly treated, whereas in the two other schemes (2 and 3), a phase separation is performed ahead, either with a compacting screw (scheme 2), or with a decanter centrifuge (scheme 3). In the three schemes, biological N removal process is followed by a decantation process. Thus, scheme 1 generates two treatment products (biological sludge and supernatant), whereas schemes 2 and 3 generate one more product (separation refusal) because of the phase separation. In this paper, gaseous emissions (Table 2), as well as mass and nutrient flows (Table 3), are given for the whole treatment, including phase separation and storage of end products. The details for each step of the three schemes and the hypotheses corresponding to the given figures are reported in Béline et al. (Reference Béline, Daumer and Guiziou2004).
Emission factors associated with the biological N removal process (from Loyon et al., Reference Loyon, Guiziou, Béline and Peu2007)

NH3 = ammonia; N2O = nitrous oxide; N2 = nitrogen; CH4 = methane; CO2 = carbon dioxide.
1Treatment includes phase separation, biological N removal process, decantation and storage of end products.
Partition of matter and nutrients of slurry between products issued from biological N removal process (as a percentage of the total amounts entering the treatmentFootnote 1) (from Béline et al., Reference Béline, Daumer and Guiziou2004)

1 Treatment includes phase separation, biological N removal process, decantation and storage of end products.
Liquid composting with straw
Emissions and effluent evolution associated with composting of slurry with straw according to Guernevez® process have been modelled by Paillat et al. (Reference Paillat, Robin, Hassouna, Callarec and Toularastel2005a and Reference Paillat, Robin, Hassouna and Leterme2005b). The model presented here first calculates the amount of straw required to compost the slurry, on the basis of 12 tonnes slurry per tonne straw. Gaseous emissions and N and matter losses during the whole composting process are calculated as a percentage of treated elements, including both raw slurry and added straw (Table 4). The details for the two main steps of SC (spreading and maturing) are described in Paillat et al. (Reference Paillat, Robin, Hassouna and Leterme2005b).
Emission factors associated with slurry composting with straw (from Paillat et al., Reference Paillat, Robin, Hassouna, Callarec and Toularastel2005a and Reference Paillat, Robin, Hassouna and Leterme2005b)

NH3 = ammonia; N2O = nitrous oxide; N2 = nitrogen; CH4 = methane; CO2 = carbon dioxide.
1Treated corresponds to total N or C input in both treated slurry and the straw required to compost it according to Guernevez process.
Solid manure composting
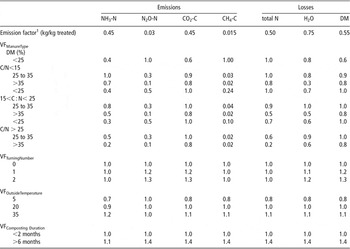
To apply equation (1) for MC, we have made some hypotheses from Paillat et al. (Reference Paillat, Robin, Hassouna and Leterme2005b) (15 local experiments) who measured gaseous emissions (CO2, CH4, NH3, N2O and H2O) from different mixtures made with various bedding materials in order to cover a wide range of carbon biodegradability, N availability, moisture content and DM density. These are the main factors involved in the composting process (Paillat et al., Reference Paillat, Robin, Hassouna and Leterme2005c; Abd El Kader et al., Reference Abd El Kader, Robin, Paillat and Leterme2007). These mixtures have been used to define EFs and to calculate the main weighting effects (Table 5): VFManureType, which integrates both C/N ratio and DM content classifications, VFTurningNumber, VFOutsideTemperature and VFCompostingDuration
(9). As for SC with straw, EFs are given as a percentage of treated elements, including both pig excretion and added straw.

Emission factors and variation factors for solid manure composting (from Paillat et al., Reference Paillat, Robin, Hassouna and Leterme2005b)

NH3 = ammonia; N2O = nitrous oxide; C = carbon; N = nitrogen; CH4 = methane; CO2 = carbon dioxide; DM = dry matter; VF = variation factor.
1Emission factor corresponds to the maximum emission or loss measured among all composting situations for a 2-month period at 25°C without turning.
EFs correspond to the maximum emission measured in experiments with no turning, outside air temperature of about 25°C and a 2-month composting period (Table 5).
VFManureType: manure type refers both to manure moisture and C/N ratio. Three moisture classes as well as three C/N ratio classes were defined. Moisture and C/N ratio classes match, respectively, with the three management classes and the three straw amount classes previously defined in the building.
VFTurningNumber: turning has little effect on NH3 and CH4 emissions (Espagnol et al., Reference Espagnol, Hassouna, Robin, Levasseur and Paillat2006; Abd El Kader et al., Reference Abd El Kader, Robin, Paillat and Leterme2007) but significant effect on CO2 and H2O emissions and to a lesser extent on N2O emission (Petersen et al., Reference Petersen, Lind and Sommer1998; Espagnol et al., Reference Espagnol, Hassouna, Robin, Levasseur and Paillat2006; Abd El Kader et al., Reference Abd El Kader, Robin, Paillat and Leterme2007).
VFOutsideTemperature: at the beginning of the composting period (thermophilic phase), the influence of outside temperature on gaseous emissions is very low compared with that of heap temperature (Pel et al., Reference Pel, Oldenhuis, Brand, Vos, Gottschal and Zwart1997). When heap temperature decreases under 40°C, the effect of outside temperature could be higher, especially on NH3 emission (Paillat et al., Reference Paillat, Robin, Hassouna and Leterme2005b).
VFCompostingDuration: composting period (< 2 months or > 2 months) has an obvious effect on manure characteristics as it determines the extent of maturation phase, but few studies have dealt with long composting duration. However, we assume that CH4, CO2 and H2O emissions significantly increase with the composting time (Paillat et al., Reference Paillat, Robin, Hassouna and Leterme2005b; Pel et al., Reference Pel, Oldenhuis, Brand, Vos, Gottschal and Zwart1997). As regard NH3, we assume that emissions are less affected by the duration of the composting period, because it mainly occurs during the thermophilic phase (Fukumoto et al., Reference Fukumoto, Osada, Hanajima and Haga2003).
Simulations
Comparison of structural options for manure management
Scenario definition
Six contrasted manure management systems have been defined as combinations of housing/storage and treatment options (Figure 1): slatted floor and slurry storage combined with no slurry treatment (S), anaerobic digestion (SAN), biological nitrogen removal process (SBNR) or SC with straw and deep litter and solid manure storage combined with no treatment (M) or MC. To compare the six systems on a common basis, six related basic scenarios have been defined, in which farmer practices correspond to most common practices in France, according to expert knowledge. Notably, when the slatted floor option is taken, the slurry is kept for the whole fattening period (100 days) in the building at 22°C, and 30 l of cleaning water are used per pig. When the deep-litter option is taken, 60 kg of straw are used per animal with standard management and animal density (1.2 m2/pig). Outside storage corresponds to 120 days, average outside temperature is 13°C. The same animal excretion is used as input for the six scenarios. It has been obtained for a growing period from 30 to 110 kg body weight with ‘standard’ feeding strategy and performance parameters, as defined in the companion paper (raw excretion per pig: volume = 384 l, N = 3.82 kg, P = 5.8 kg, K = 16.2 kg, Cu = 5.6 g and Zn = 32.6 g Rigolot et al., Reference Rigolot, Espagnol, Pomar and Dourmad2010).
Simulation results
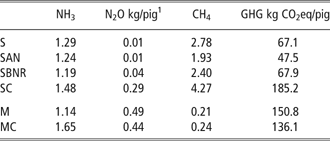
Ammonia, N2O and CH4 emissions in kg/pig, as well as total GHG emissions, expressed in kg CO2eq (carbon dioxide equivalent), are presented in Table 6. With the chosen assumptions for farmer practices in the basic scenarios, housing the animals on straw reduces NH3 emissions compared to slatted floor, when no additional treatment is achieved (−11%, S v. M). Systems including a composting process increase NH3 emissions (+15% SC v. S, and +45% MC v. M). Conversely, SAN and biological N removal treatment both reduce NH3 emissions compared to classic slurry storage (−4% and −8%, respectively).
Total gaseous emissions simulated by the model for six scenarios of manure management, for one fattening pig (30 to 110 kg BW)

NH3 = ammonia; N2O = nitrous oxide; CH4 = methane; S = slurry; SAN = slurry + anaerobic digestion; SBNR = slurry + biological nitrogen removal; SC = slurry composting; M = solid manure; MC = solid manure + composting; GHG = greenhouse gas; CO2eq = carbon dioxide equivalent.
1from 30 to 110 kg BW.
Total GHG emissions are very contrasted between slurry-based scenarios (S, SAN and SBNR) and straw-based scenarios (SC, M and MC); the last possibly inducing emissions between two and three-fold higher. The contribution of N2O and CH4 to this difference is antagonist, as mentioned by Monteny et al., (Reference Monteny, Groenestein and Hilhorst2001): CH4 emission is higher in anaerobic systems (S) and N2O is mainly produced in aerated systems (M and MC), whereas in systems where both conditions may appear (SC), large amounts of both gases may be emitted. However, because of the much higher global warming potential of N2O, total GHG emissions are much higher in aerobic (litter-based) systems.
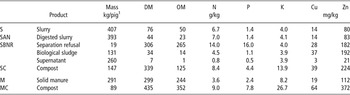
Product characteristics (mass, nutrients and trace element contents and DM and OM contents) are given in Table 7 as a quantitative illustration of manure evolution. As regard nutrient content, total N amount in products vary considerably between systems, whereas P and K total amounts only depend on straw addition, because they are completely kept in manure, whatever the system. N amounts make it possible to calculate N abatement in gaseous form (as a percentage of excreted N) for each system: S (28.6%), SAN (28.0%), SBNR (72.3%), SC (67.7%), M (72.6%) and MC (79.0%).
Product characteristics simulated by the model for six scenarios of manure management, for one fattening pig (30 to 110 kg BW)

DM = dry matter; OM = organic matter; S = slurry; SAN = slurry + anaerobic digestion; SBNR = slurry + biological nitrogen removal; SC = slurry composting; M = solid manure; MC = solid manure + composting.
1from 30 to 110 kg BW.
Effects of feeding strategy and farmer practices on emissions from building and stores
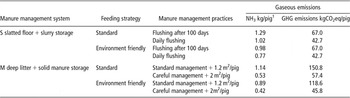
A simple example is given to illustrate how the model might be used to assess the impact of farmer practices. In this example, advised manure management scenarios have been defined by the experts for systems S and M. For system S, advised scenario consists in daily slurry flushing from the building, and the use of partially slatted floor. For system M, advised scenario consists in good litter management and low-animal density. Then, both standard and advised manure management scenarios have been combined with two sets of excretion characteristics, the first corresponding to the ‘standard’ feeding strategy previously defined (3.82 kg N excreted/growing pig), and the second to an ‘environment friendly’ feeding strategy, also reported in the companion paper (2.90 kg N excreted/growing pig, Rigolot et al., Reference Rigolot, Espagnol, Pomar and Dourmad2010). Results for NH3 and GHG emissions are presented in Table 8.
Gaseous emissions in system S and M with different feeding and manure management practices

NH3 = ammonia; GHG = greenhouse gas; CO2eq = carbon dioxide equivalent; S = slurry; M = solid manure.
1from 30 to 110 kg BW.
In system M, the use of the advised instead of the standard litter management results in a reduction of about 54% and 62% of NH3 and GHG productions, respectively. In the same way, in system S, the daily flushing of slurry, compared to storage below the slatted floor, results in 26% and 21% reduction of NH3 and GHG emissions, respectively. When both advised feeding and advised manure management are practiced, large decreases of NH3 emissions would be expected (40% and 63% in S and M systems, respectively), as well as large decreases of GHG emissions (36% and 70% in S and M systems, respectively).
Numerous sensitivity analyses and other scenario comparisons, not shown in this paper, have been performed. They confirm that the emissions within each system highly depend on farmer practices. For example, when testing every combination of VF in litter-based housing systems, NH3 emissions in animal housing may vary between 6% and 53% of total N excreted and that of N2O between 1% and 19%.
Validation
A comparison between some simulation results and external data (not used to build the model) has been performed as far as possible. However, a real validation is difficult to perform, because information is often missing in protocol descriptions. In fact, all the inputs required to run the model are generally not given in the material and method sections of publications (e.g. feed characteristics). Therefore, a validation step has been performed by expert knowledge and by carefully checking simulation coherency. For example, estimated total N losses are always higher than or equal to the sum of calculated N-NH3 and N-N2O emissions. Furthermore, indicators such as DM contents or C/N ratio in the products, or matter conservation have also been used to verify the consistency of the model.
A limit to the approach proposed (equation (1)) is that the VFs identified by the experts are not necessarily independent. For example, in equation (2) (NH3 emissions from slurry), an increase in temperature will result in an increase in air renewal and water evaporation, and therefore in NH3–N concentration. This means that the end user of the model must ensure that the input data describing the system are consistent with each other. In fact, the approach developed in this paper could help to design some multifactorial experiments, or to calibrate mechanistic models, which would be required for a more satisfactory validation of the model.
Discussion and conclusion
This model predicts gaseous emissions and nutrient flows in contrasted manure management systems. The objective was to take into account the main effects of farmer practices and climatic conditions in each system, more precisely than in current methodologies. The construction of the model, as well as its limits, reveals some gaps and improvement margins in the knowledge of such systems. For example, the model points out a general lack of experimental data, but also specific needs for data acquisition, especially for alternative housing systems. Emission measurement reports and databases could also be further improved. Particularly, scientific papers should be as complete as possible for VFs identified in this work, notably concerning animals, manure storage dimensions and duration, and farmer practices. In fact, the experimental support for the different equations presented in this paper is highly variable. Because of trade off between improved details and loss of transparency, it would be useful to quantify uncertainties of estimates for each source, and for emission estimates at the system level.
Modelling helps us to identify environmental advantages and weaknesses concerning NH3 and GHG emissions and manure characteristics. As regard gaseous emissions, the simulation results (Table 6) highlight some risks associated with some systems for particularly high NH3 (composting process) and/ or GHG production (litter-based systems). Synergies (reduction of both NH3 and N2O) and trade-off (compromise between N2O and CH4 emissions) can also be identified.
Another important conclusion of this work is that variations in NH3 and GHG emissions within systems (for a given infrastructure) might be as high as variations between the main systems, as illustrated by Table 8. For example, in straw-based systems, the combination of VFs (N2O emission between 1% and 19% of N input) indicates that these systems should not be systematically associated with high-GHG emissions, in spite of the high level measured in standard conditions. They should rather be considered as risky systems, because they might induce lower emissions (whether well managed). Moreover, in these systems, improvements could be achieved without structure modification, provided farmers were sensitised for litter management, and litter management better understood.
At a larger scale, the nature of products and their composition determine opportunities and constraints to their use. In particular, DM content of products will determine possibilities and flexibility of use, on the farm or elsewhere (Burton and Turner, Reference Burton and Turner2003). In an extreme case, composting process could be a total treatment whether the compost is exported. However, export of by-products or their agronomic use or environmental impacts will also depend on their nutrient and trace element contents. Particularly, dry products are generally associated to high levels of trace elements and P, which may limit their use (Dourmad and Jondreville, Reference Dourmad and Jondreville2008). Discrepancies between relative proportions of N, P and K in manure and crop average requirements (N/P/K ≈ 100/40/70) may lead to high-K application rates and to P accumulation in soils. Moreover, the proportion of organic and ammoniacal N influences NH3 volatilisation (Petersen et al., Reference Petersen, Sommer, Béline, Burton, Dach, Dourmad, Leip, Misselbrook, Nicholson, Poulsen, Provolo, Sørensen, Vinneras, Weiske, Bernal, Böhm, Juhász and Mihelic2007). For example, NH3 emission during spreading of digested slurry could be 15% higher compared to raw slurry, because of increased ammoniacal N content (Vedrenne, Reference Vedrenne2006), whereas compost spreading induces low emissions. This raises the problem of the definition of system boundaries for environmental assessment. More generally, agricultural practices, soil status and climate, the manure market and available equipment for liquid or solid manure management in the farming system, as well as other considerations like animal welfare, will ultimately determine the most suitable manure management system. This will be studied by integrating the results of this study in a comprehensive model at farm scale, including the whole pig production unit and dairy and crop productions (Chardon et al., Reference Chardon, Rigolot, Baratte, Le Gall, Espagnol, Martin-Clouaire, Rellier, Raison, Poupa and Faverdin2007).