Introduction
The physiological properties of glutamatergic N-methyl-d-aspartate receptors (NMDA-Rs) depend on the subunits included in the channel (Cull-Candy & Leszkiewicz, Reference Cull-Candy and Leszkiewicz2004; Paoletti & Neyton, Reference Paoletti and Neyton2007). The GluN2B subunit is highly expressed during development, while the GluN2A subunit is comparatively more expressed in adolescence (Stocca & Vicini, Reference Stocca and Vicini1998; Dumas, Reference Dumas2005). Different brain regions show variable GluN2A:GluN2B ratios in adult animals (Kayadjanian et al. Reference Kayadjanian, Heavens, Besson and Sirinathsinghji1996). In situ hybridization findings in postmortem human brains indicated high expression levels of the GRIN2B gene, coding for GluN2B, in the fronto-parieto-temporal cortex and in the hippocampus (Schito et al. Reference Schito, Pizzuti, Di Maria, Schenone, Ratti, Defferrari, Bellone, Mancardi, Ajmar and Mandich1997).
In particular, glutamatergic neurons of layer III of the dorsolateral prefrontal cortex (DLPFC) maintain neuronal excitation in the absence of sensory inputs during working memory (WM) (Goldman-Rakic, Reference Goldman-Rakic1995; Dumitriu et al. Reference Dumitriu, Hao, Hara, Kaufmann, Janssen, Lou, Rapp and Morrison2010). Importantly, synaptic GluN2B in layer III of the DLPFC is involved in WM in adult animals (Gilmartin et al. Reference Gilmartin, Miyawaki, Helmstetter and Diba2013; Wang et al. Reference Wang, Yang, Wang, Gamo, Jin, Mazer, Morrison, Wang and Arnsten2013). GluN2B selective blockade in layer III of the prefrontal cortex (PFC) impairs WM performance (Wang et al. Reference Wang, Stradtman, Wang and Gao2008, Reference Wang, Yang, Wang, Gamo, Jin, Mazer, Morrison, Wang and Arnsten2013). Consistently, forebrain up-regulation or knockout of GRIN2B modulates WM performance (Tang et al. Reference Tang, Wang, Feng, Kyin and Tsien2001; Cao et al. Reference Cao, Cui, Feng, Tang, Qin, Mei and Tsien2007; von Engelhardt et al. Reference von Engelhardt, Doganci, Jensen, Hvalby, Gongrich, Taylor, Barkus, Sanderson, Rawlins, Seeburg, Bannerman and Monyer2008). Thus, GRIN2B plays a critical role in WM in adult animals. It has been suggested that, in humans, greater DLPFC activity is associated with poor WM performance (Callicott et al. Reference Callicott, Mattay, Bertolino, Finn, Coppola, Frank, Goldberg and Weinberger1999, Reference Callicott, Mattay, Verchinski, Marenco, Egan and Weinberger2003), but genetic animal models of GRIN2B overexpression suggest that increased GRIN2B transcription in adulthood is associated with enhanced cortical activity and superior WM performance (Tang et al. Reference Tang, Shimizu, Dube, Rampon, Kerchner, Zhuo, Liu and Tsien1999).
Consistently, GRIN2B variants have been associated with cognitive impairment and increased risk for neuropsychiatric diseases in humans (Ohtsuki et al. Reference Ohtsuki, Sakurai, Dou, Toru, Yamakawa-Kobayashi and Arinami2001; Arnold et al. Reference Arnold, Rosenberg, Mundo, Tharmalingam, Kennedy and Richter2004; Fallin et al. Reference Fallin, Lasseter, Avramopoulos, Nicodemus, Wolyniec, McGrath, Steel, Nestadt, Liang, Huganir, Valle and Pulver2005; Martucci et al. Reference Martucci, Wong, De Luca, Likhodi, Wong, King and Kennedy2006; Avramopoulos et al. Reference Avramopoulos, Lasseter, Fallin, Wolyniec, McGrath, Nestadt, Valle and Pulver2007; Ting & Feng, Reference Ting and Feng2008; Jiang & Jia, Reference Jiang and Jia2009; Chen et al. Reference Chen, Li, Wang, Wang, Fu, Zhang and Xiao2010; Endele et al. Reference Endele, Rosenberger, Geider, Popp, Tamer, Stefanova, Milh, Kortum, Fritsch, Pientka, Hellenbroich, Kalscheuer, Kohlhase, Moog, Rappold, Rauch, Ropers, von Spiczak, Tonnies, Villeneuve, Villard, Zabel, Zenker, Laube, Reis, Wieczorek, Van Maldergem and Kutsche2010; Lorenzi et al. Reference Lorenzi, Delmonte, Pirovano, Marino, Bongiorno, Catalano, Colombo, Bramanti and Smeraldi2010; Ludwig et al. Reference Ludwig, Roeske, Herms, Schumacher, Warnke, Plume, Neuhoff, Bruder, Remschmidt, Schulte-Korne, Muller-Myhsok, Nothen and Hoffmann2010; Myers et al. Reference Myers, Casals, Gauthier, Hamdan, Keebler, Boyko, Bustamante, Piton, Spiegelman, Henrion, Zilversmit, Hussin, Quinlan, Yang, Lafreniere, Griffing, Stone, Rouleau and Awadalla2011; O'Roak et al. Reference O'Roak, Deriziotis, Lee, Vives, Schwartz, Girirajan, Karakoc, Mackenzie, Ng, Baker, Rieder, Nickerson, Bernier, Fisher, Shendure and Eichler2011; Zhao et al. Reference Zhao, Che, Zhang, Wang, Li, Li, Huang, Tang, Feng, Lindpaintner, He and Shi2011; Yoo et al. Reference Yoo, Cho, Park, Yang and Kim2012; Andreoli et al. Reference Andreoli, De Marco, Trecroci, Cittadella, Di Palma and Gambardella2014; Kenny et al. Reference Kenny, Cormican, Furlong, Heron, Kenny, Fahey, Kelleher, Ennis, Tropea, Anney, Corvin, Donohoe, Gallagher, Gill and Morris2014), possibly mediated by regulation of activity of transcription factors affecting GRIN2B function (Schoenherr & Anderson, Reference Schoenherr and Anderson1995; Sasner & Buonanno, Reference Sasner and Buonanno1996; Miyatake et al. Reference Miyatake, Furukawa and Suwaki2002; Qiang et al. Reference Qiang, Rani and Ticku2005; Koronyo-Hamaoui et al. Reference Koronyo-Hamaoui, Frisch, Stein, Denziger, Leor, Michaelovsky, Laufer, Carel, Fennig, Mimouni, Ram, Zubery, Jeczmien, Apter, Weizman and Gak2007; Stein et al. Reference Stein, Hua, Morra, Lee, Hibar, Ho, Leow, Toga, Sul, Kang, Eskin, Saykin, Shen, Foroud, Pankratz, Huentelman, Craig, Gerber, Allen, Corneveaux, Stephan, Webster, DeChairo, Potkin, Jack, Weiner and Thompson2010; Traynelis et al. Reference Traynelis, Wollmuth, McBain, Menniti, Vance, Ogden, Hansen, Yuan, Myers and Dingledine2010; Rodenas-Ruano et al. Reference Rodenas-Ruano, Chavez, Cossio, Castillo and Zukin2012).
The aim of the present study was threefold: first, we investigated whether single nucleotide polymorphisms (SNPs) in GRIN2B are associated with gene expression in the human brain. Second, we used SNPs as markers of brain transcriptional levels and developed a composite genetic score (D’ GS) that indexes the probability of GRIN2B transcription down-regulation and tested it with computational procedures to assess its robustness. We also performed a molecular study on peripheral blood to investigate the predictive power of our D’ GS in biological samples. Different from haplotype approaches, we considered only independent SNPs and collapsed their effects on expression into a continuous variable. By this procedure, we investigated how genetic variation predicts phenotypes from a different perspective as compared with previous studies. Specifically, the D’ GS weighs genotypes based on the magnitude of their putative effect on gene expression. Several studies using multi-loci polygenic scores assigned equal weight to different genotypes, usually in an allelic dose-dependent fashion (Purcell et al. Reference Purcell, Wray, Stone, Visscher, O'Donovan, Sullivan and Sklar2009; Walton et al. Reference Walton, Turner, Gollub, Manoach, Yendiki, Ho, Sponheim, Calhoun and Ehrlich2013; Nicodemus et al. Reference Nicodemus, Hargreaves, Morris, Anney, Gill, Corvin and Donohoe2014; Tesli et al. Reference Tesli, Espeseth, Bettella, Mattingsdal, Aas, Melle, Djurovic and Andreassen2014). Furthermore, studies exploring association of polygenic scores with risk for disease weigh genotypes by the odds ratio of the association of each genotype with a categorical variable (e.g. case–control; De Jager et al. Reference De Jager, Chibnik, Cui, Reischl, Lehr, Simon, Aubin, Bauer, Heubach, Sandbrink, Tyblova, Lelkova, Havrdova, Pohl, Horakova, Ascherio, Hafler and Karlson2009; Purcell et al. Reference Purcell, Wray, Stone, Visscher, O'Donovan, Sullivan and Sklar2009; Walton et al. Reference Walton, Turner, Gollub, Manoach, Yendiki, Ho, Sponheim, Calhoun and Ehrlich2013; Nicodemus et al. Reference Nicodemus, Hargreaves, Morris, Anney, Gill, Corvin and Donohoe2014). Here, the D’ GS reflects biological measures of expression rather than epidemiological scores. The third and final aim was to study how GRIN2B D’ GS predicts prefrontal activity and cognitive skills, in particular WM. We tested both linear and quadratic effects of the D’ GS, because prefrontal activity during WM has been shown to depend non-linearly on neurotransmitter availability in the case of dopamine (Goldman-Rakic et al. Reference Goldman-Rakic, Muly and Williams2000; Cools & D'Esposito, Reference Cools and D'Esposito2011). In the case of glutamate, excessive GluN2B availability in synapses may result in neuronal damage (Liu et al. Reference Liu, Wong, Pozza, Lingenhoehl, Wang, Sheng, Auberson and Wang2004, Reference Liu, Wong, Aarts, Rooyakkers, Liu, Lai, Wu, Lu, Tymianski, Craig and Wang2007), which makes controversial whether a linear model can account for the multiple potential effects of GRIN2B transcription regulation.
Based on evidence from animal models above indicated, we hypothesized that greater putative GRIN2B transcription levels in the human DLPFC would predict enhanced PFC activity during WM as well as better WM performance. Additionally, by using the quadratic term of the D’ GS, we tested for non-linear effects of GRIN2B expression regulation, i.e. we tested whether genotypes associated with more extreme predicted GRIN2B expression levels (e.g. very high or very low) differed from genotypes with more moderate predicted expression levels.
Method
Table 1 reports demographic information for all samples included in the study. All participants in the peripheral blood expression, behavioural and the imaging studies provided written informed consent according to the guidelines of the Declaration of Helsinki. Protocols and procedures were approved by the ethical committee of the University of Bari.
Demographic and clinical data in all studies reported

s.d., Standard deviation; PBMCs, peripheral blood mononuclear cells; fMRI, functional magnetic resonance imaging.
Expression study
Subjects
We used the BrainCloud dataset (Colantuoni et al. Reference Colantuoni, Lipska, Ye, Hyde, Tao, Leek, Colantuoni, Elkahloun, Herman, Weinberger and Kleinman2011) (available at http://braincloud.jhmi.edu/) to identify associations between GRIN2B genotypes and expression levels in the DLPFC [Brodmann area (BA) 46]. We selected participants based on age, ethnicity and RNA integrity (RIN; see online Supplementary material for details). The final sample included 148 subjects (44 females; 62 Caucasians). Postmortem expression data were obtained through a microarray analysis (Colantuoni et al. Reference Colantuoni, Lipska, Ye, Hyde, Tao, Leek, Colantuoni, Elkahloun, Herman, Weinberger and Kleinman2011).
Expression quantitative trait loci (eQTL) study
Potential confounding effects of demographic variables (age, ethnicity, gender) and sample quality features (RIN, pH, postmortem interval) on GRIN2B mRNA postmortem expression levels were identified and removed using a stepwise regression model (online Supplementary material). We used linear regression residuals of GRIN2B mRNA expression levels (abbreviated with Expr in the following) for the eQTL analyses.
We estimated the association between Expr and SNP genotype using the software Snp&VariationSuite (SVS; GoldenHelix, USA). A gene-wide search on GRIN2B served to identify SNPs for a cis-eQTL study. Markers included regions approximately 125 thousand base pairs (kbp) upstream and 96 kbp downstream the gene. We considered for the analysis 79 tagging SNPs with low to moderate linkage disequilibrium (LD; R 2 cut-off = 0.5; online Supplementary material). We performed one-way analyses of variance (ANOVAs) with genotype as a factor separately for each SNP and corrected results for multiple comparisons using false discovery rate (FDR; α = 0.05) correction (Benjamini & Hochberg, Reference Benjamini and Hochberg2000). Five SNPs had a significant association with Expr (see Results section for details) and were thus selected to compute the D’ GS. Additionally, to probe whether further genetic variants would contribute to explain more variance in the phenotypes, we computed three further D’ GSs including SNPs detected at variable FDR-corrected thresholds (α = 0.1; α = 0.15; α = 0.2).
D’ GS computation
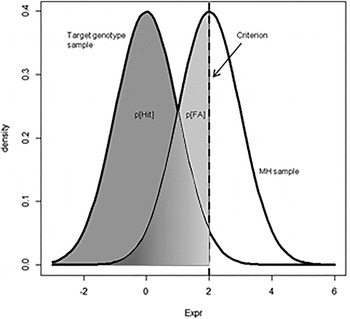
The D’ GS computation is based on the signal detection theory (Green & Swets, Reference Green and Swets1966); the online Supplementary material reports a detailed description of the procedure. Fig. 1 illustrates the principle of D’ computation. We used the Discriminability index D’ to quantify the magnitude of the differences in Expr between the three genotypic populations of each of the five SNPs selected. For each SNP we used the major allele homozygote (MH) as the reference group. D’ is a measure of how Expr discriminated the heterozygous and the minor homozygous samples from the MH group. Negative D’ implies greater expression levels compared with the MH population and vice versa. After having defined D’ for each SNP, we defined D’ GS of each participant as the arithmetic mean of D’ associated with the genotypes having an effect on GRIN2B expression carried by the individual. The lower the D’ GS, the greater the mRNA expression level of that individual. We tested the fit between our D’ GS and Expr through a linear regression model. We used custom-written scripts in the software R 3.0.2 64-bit (R Development Core, 2014) for these analyses.
Illustration of the principle of D’ genetic score computation for a single nucleotide polymorphism. The statistical distribution of the major homozygous (MH) sample (on the right) is used as a reference for the other genotypic populations. The criterion for D’ calculation is set on the average Expr of the major homozygous population. p[Hit], Probability of correctly assigning a data point to the target genotype population given that its Expr value is lower than the criterion; p[FA], probability of incorrectly assigning a MH data point to the target genotypic population given that its Expr value is lower than the criterion.

D’ GS validation
Since we aimed to use SNPs as markers of transcription levels, we performed in silico validation of D’ GS in BrainCloud (Whelan & Garavan, Reference Whelan and Garavan2014). In particular, we performed leave-one-out and leave-k-out cross-validation (Stone, Reference Stone1974; online Supplementary material). We tested how the cross-validated D’ GSs predicted Expr through linear regression models. We bootstrapped R 2 values of the correlations between cross-validated D’ GSs (computed on restricted samples) and Expr. Additionally, we investigated the influence of population stratification in an analysis of covariance (ANCOVA) with ethnicity as the between-subjects factor and the cross-validated D’ GS as a linear predictor.
Peripheral blood mononuclear cells (PBMCs) study
We assessed GRIN2B expression in peripheral blood to provide a biological test of the predictive power of D’ GS in 46 healthy Caucasian individuals. Peripheral blood mRNA expression levels of GRIN2B were determined through the quantitative real-time polymerase chain reaction (qPCR) assay (Engstrom et al. Reference Engstrom, Vahter, Mlakar, Concha, Nermell, Raqib, Cardozo and Broberg2011; online Supplementary material). RNA was extracted from blood samples and its concentration and purity were assessed through an Epoch spectrophotometer (Biotek, USA). After reverse transcription of total RNA to single-stranded cDNA, GRIN2B expression was assessed by using a gene-specific TaqMan probe (assay ID qHsaCIP0029797) by Bio-Rad (USA). The amount of GRIN2B was normalized to the reference gene TBP (TATA-binding protein). qPCR (20 µl reaction) was run under standard conditions on a MJ Mini Opticon instrument (Bio-Rad) and performed in triplicate with a negative control and a calibrator included for each assay. GRIN2B relative expression was obtained by performing the comparative Ct method reported previously (Livak & Schmittgen, Reference Livak and Schmittgen2001). We tested the negative Pearson's correlation between D’ GS and GRIN2B expression levels assessed as described. We also assessed the impact of data quality on the correlation between D’ GS and peripheral GRIN2B expression by testing different cut-offs of number of Ct to reach criterion, as suggested by Burns & Valdivia (Reference Burns and Valdivia2008).
Behavioural study
We performed a behavioural investigation independently of the imaging investigation to ensure that behavioural effects of D’ GS were not associated with the specific experimental setting of the functional magnetic resonance imaging (fMRI).
Participants
Healthy unrelated adult Caucasian subjects from the region of Apulia (Italy) participated in neuropsychological and WM assessments (see Table 1 for demographic data; see online Supplementary material for details). We used the Edinburgh Handedness Inventory (Oldfield, Reference Oldfield1971) to assess hand preference and the Wechsler Adult Intelligence Scale-Revised (Wechsler, Reference Wechsler1981) to estimate intelligence quotient [IQ; mean 108.2 (s.d. = 10.9), range 82–131].
WM task
The cognitive task used is a version of the standard n-back task, originally developed to fit into a block-design fMRI paradigm, with alternating conditions and motor response required for every stimulus (Weinberger et al. Reference Weinberger, Mattay, Callicott, Kotrla, Santha, van Gelderen, Duyn, Moonen and Frank1996). The task featured four conditions, i.e. 0-back, 1-back, 2-back and 3-back (see the online Supplementary material for details). More in detail, the 0-back task simply required subjects to identify the stimulus currently seen. The other conditions required WM and participants responded by indicating the stimulus seen one trial (1-back), two (2-back) or three trials before (3-back) while keeping on encoding incoming stimuli. Each block featured a single condition (e.g. 1-back). Stimuli consisted of numbers (1–4) shown in random sequence at fixed locations for 500 ms, with an inter-trial interval of 1500 ms. Participants responded by pressing a button corresponding to the number encoded n trials before. The experiment included three runs alternating a WM condition (1–2–3-back) and 0-back. Each run included four blocks per condition, each lasting 30 s and including 14 stimuli. We investigated WM efficiency using an index directly proportional to accuracy and inversely proportional to reaction times (i.e. efficiency = accuracy/reaction times).
Genotype determination
Participants in the behavioural and imaging studies underwent blood withdrawal for subsequent DNA extraction from PBMCs (online Supplementary material). Since the procedure to compute D’ GS requires statistical independence between SNPs, we double-checked statistical independence between the target SNPs in the behavioural and imaging samples.
Association of D’ GS with neuropsychological measures and with WM performance
We investigated the association between D’ GS and IQ using multiple regression. In the n-back task, accuracy was evaluated as percentage correct responses. We discarded data from participants whose accuracy did not significantly differ from chance level (cut-off: 37%; see online Supplementary material for details). To investigate the association of the linear and quadratic D’ GS with WM performance, we computed repeated-measures ANCOVAs with factor LOAD (1-, 2- and 3-back) and predictors D’ GS as well as efficiency at 0-back. The latter variable was included as a no-memory baseline to factor out inter-individual variability related to motivation and attention rather than WM. We also used IQ and gender as covariates (online Supplementary material).
Imaging study
Participants
Healthy unrelated adult Caucasian subjects non-overlapping with the samples analysed in the peripheral expression and behavioural studies participated in the fMRI experiment. Exclusion criteria were the same as reported for the behavioural study, plus the presence of metal implants on participants’ bodies. The sample included 122 participants [see Table 1 for demographic information; mean IQ = 110 (s.d. = 12), range 83–142]. Participants took part in a separate session aimed to collect sociodemographic information and to assess IQ and handedness. Genotypes for the relevant SNPs were determined as described above. During fMRI, all participants completed the n-back task including the 0-, 1- and 2-back conditions.
fMRI data acquisition and analysis
Blood oxygen level-dependent (BOLD) signal was recorded by a GE Signa 3 T scanner (General Electric, USA), equipped with a standard quadrature head coil. A gradient-echo planar imaging sequence (repetition time, 2000 ms; echo time, 28 ms; 20 interleaved axial slices; thickness, 4 mm; gap, 1 mm; voxel size, 3.75 × 3.75 × 5 mm3; flip angle, 90°; field of view, 24 cm; matrix, 64 × 64) was used to acquire 120 volumes while subjects performed the WM task. The first four scans were discarded to allow for T1 equilibration effect. Low-quality acquisitions were excluded (online Supplementary material).
We used the Matlab (MathWorks, USA) toolbox Statistical Parametric Mapping 8 (SPM8; http://www.fil.ion.ucl.ac.uk/spm) to analyse the fMRI data. Images of each subject were reoriented, slice timing-corrected, and realigned to the mean image. Realigned images were resliced to a 2 mm isotropic voxel size, spatially normalized into a standard space (Montreal Neurological Institute; MNI) and smoothed with a Gaussian filter (6 mm full-width at half-maximum isotropic). We computed voxel-wise t statistical maps for the contrasts of interest (1-back > 0-back and 2-back > 0-back). Individual contrast images were used for analyses at the group level.
Association of D’ GS with prefrontal physiology during WM performance
In order to evaluate the effect of D’ GS on brain activity during WM performance, we masked results selecting those voxels in which activity was greater during WM than baseline. To this aim we computed one-sample t tests on the whole sample of participants to discover brain regions in which activity was significantly greater during both 1-back and 2-back conditions compared with 0-back baseline [α = 0.05 family-wise error (FWE)-corrected, null conjunction analysis]. We masked results using this activity mask and focused on the prefrontal gyri using a region of interest derived from the aal labels of the Wake Forest University PickAtlas (http://fmri.wfubmc.edu/software/pickatlas). This anatomical mask included the superior, medial, middle, inferior and orbital frontal gyri. We tested the association of D’ GS with prefrontal physiology using a within-subjects factorial model. We included a linear and quadratic term of the D’ GS in the model as independent variable of interest. IQ and the efficiency index, which were associated with D’ GS in the behavioural study, were also included in the model as covariates of no interest. We followed this procedure to control for cognitive differences across the sample, i.e. to ensure that brain activity – D’ GS correlations – reflected WM processing rather than individual scoring. Additionally we included age, gender and handedness as nuisance variables. We tested the LOAD × D’ GS interaction term as well as the positive and negative slopes of the linear and quadratic terms of D’ GS. Finally, we tested D’ GSs computed at variable thresholds as predictors of prefrontal activation during WM (online Supplementary material).
MNI coordinates of statistical maxima of activation were converted to conform to the standard space of Talairach using the non-linear Yale MNI to Talairach conversion algorithm (http://noodle.med.yale.edu/~papad/mni2tal; Lacadie et al. Reference Lacadie, Fulbright, Rajeevan, Constable and Papademetris2008). We used the Talairach Daemon software (http://www.talairach.org/daemon.html; Lancaster et al. Reference Lancaster, Woldorff, Parsons, Liotti, Freitas, Rainey, Kochunov, Nickerson, Mikiten and Fox2000) to determine the anatomical localization of the significant clusters (peak-level corrected FWE, p < 0.05). Furthermore, we assessed the association of D’ GS with behavioural performance during the scanning session.
LD of SNPs detected with SNPs from the literature
We investigated whether SNPs in the LD blocks which the five SNPs detected in the current study belonged to had been previously associated with pathological phenotypes. To answer this question we computed LD between the target SNPs and GRIN2B SNPs reported in the literature in association with cognitive deficits or neuropsychiatric conditions (the online Supplementary material reports a list complete with references).
Results
Expression study
eQTL study
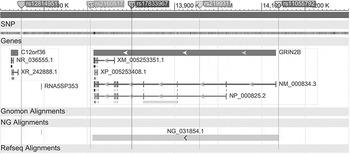
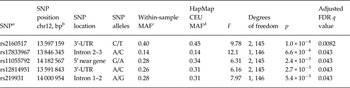
RIN significantly correlated with GRIN2B expression (t 146 = −2.59, R 2 = 0.044, p = 0.011). We obtained expression residuals after marginalizing for RIN using linear regression. We used this new variable (Expr) as the dependent variable of 79 ANOVAs (one per tagging SNP selected). Five SNPs survived FDR correction for multiple comparisons. Table 2 reports genetic data for each SNP. Fig. 2 shows the location of the SNPs in the GRIN2B gene. Online Supplementary Tables S1 and S2 report the SNPs tagged by our target SNPs with R 2 > 0.5 according to the HapMap repository and the R 2 values of the LD found in the BrainCloud sample. None of the SNP pairs showed more than a moderate LD.
Single nucleotide polymorphism (SNP) position within the GluN2B coding gene (GRIN2B). The figure shows the position of the five SNPs selected with respect to the gene GRIN2B. The 3′ terminal is on the left and the 5′ terminal is on the right. Modified from PubMed (http://www.ncbi.com).

SNPs associated with GRIN2B expression

SNP, Single nucleotide polymorphism; GRIN2B, GluN2B coding gene; chr12, chromosome 12; bp, base pairs; MAF, minor allele frequency; FDR, false discover rate; UTR, untranslated region.
a We considered G-carriers for rs219931 and C-carriers for rs17833967.
b Base pairs following RefSeq Genes 63, University of California Santa Cruz (http://genome.ucsc.edu/).
c MAFs in BrainCloud sample.
d MAFs in HapMap Caucasian sample repository.
D’ GS
We found no evidence that Expr deviated from normality (Shapiro-Wilk test for normality; all p values > 0.05) except for the GG group of rs219931 (Shapiro-Wilk test for normality; n = 13, p = 0.037). Thus, we used the rs219931 G-carriers sample for our analyses, which complied with the normal distribution (Shapiro–Wilk test for normality; n = 70, p > 0.05). After pooling for G carriers this SNP was still associated with Expr (Table 2).
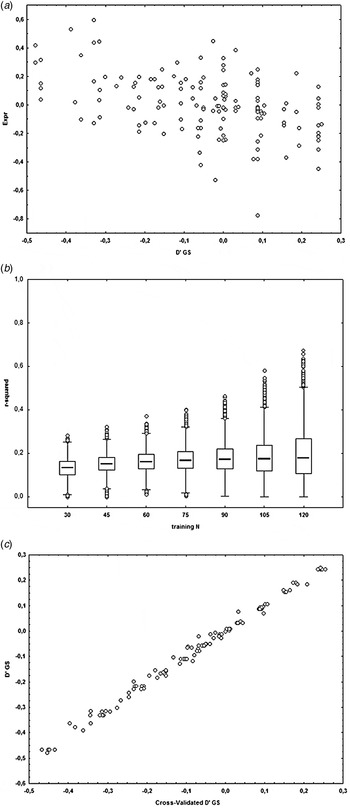
Expr was strongly associated with D’ GS (linear regression t 146 value = −6.25, R 2 = 0.21, p = 4.23 × 10⁻⁹). Fig. 3 a shows a scatterplot of the linear fit. Notably, D’ GS explained more variance in the expression levels than the first ranked SNP rs2160517 (partial η 2 = 0.119). Fig. 3 b shows a boxplot of the variation of the R 2 of the fit between D’ GS and Expr in a leave-k-out test sample based on training sample size variation. This permutation procedure supports the notion that D’ GS robustly predicts Expr. Fig. 3 c shows the scatterplot of the linear fit between D’ GS and the leave-one-out cross-validated D’ GS. The nearly perfect fit (p = 1.1 × 10−168, R 2 = 0.995) suggests that the association between Expr and D’ GS was not driven by a few influential observations. The association between D’ GS and cross-validated D’ GS remained robust even when the training sample size was greatly reduced (online Supplementary Fig. S2). The leave-one-out cross-validated D’ GS was still robustly associated with Expr (linear regression t 146 value = −5.47, R 2 = 0.17, p = 1.94 × 10⁻⁷). In the ANCOVA computed to address population stratification effects associated with ethnicity, we found no significant main effect of ethnicity (F 1,144 = 3.6, p > 0.05), but a significant effect of D’ GS (F 1,144 = 30, p = 1.6 × 10⁻⁷). Importantly, the ethnicity × D’ GS interaction was not significant (F 1,144 = 0.83, p > 0.05). Accordingly, the effect of D’ GS was significant both in Caucasian (linear regression t 60 value = −4.7, R 2 = 0.25, p = 1.75 × 10⁻⁵) and African-American subjects (linear regression t 84 value = −2.8, R 2 = 0.07, p = 6.4 × 10⁻³).
Linear fit between GluN2B coding gene (GRIN2B) expression and D’ genetic score (GS). (a) D’ GS is on the x axis. On the y axis, Expr denotes GRIN2B transcription levels marginalized by RNA integrity scores. For statistics, see the main text. (b) The boxplot shows the variation of the R 2 of the fit between the GS and GRIN2B expression in leave-k-out test samples based on training sample size variation. Each box represents 10 000 permutations of the R 2 between D’ GS and Expr with various sample sizes. D’ GS was computed based on data from different training samples (size indicated on the x axis). The association with GRIN2B expression was permutated to obtain median and dispersion estimates for the boxplot. R 2 values increase with increasing training information, but remain stable with smaller training samples. (c) Linear fit between D’ GS and leave-one-out cross-validated D’ GS. The leave-one-out cross-validated D’ GS was computed for each participant weighing each genotype by its association with expression levels based on all other observations. The nearly perfect fit supports the robustness of D’ GS.

Genetic analysis in the behavioural and imaging samples
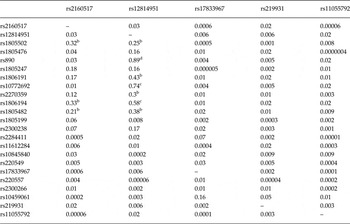
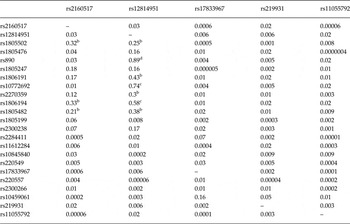
To ensure that SNPs were independent also in our samples, we assessed LD between our target SNPs. Table 3 shows R 2 values of the LD between the five SNPs considered and also between these SNPs and others previously associated with neuropsychiatric and cognitive traits. Genetic data for the behavioural study are available in online Supplementary Table S1.
Linkage disequilibrium between SNPs in the imaging sample a
SNP, Single nucleotide polymorphism.
a R 2 values are displayed. Columns report the five SNPs of interest. Rows report the five SNPs selected plus several SNPs associated with cognitive and neuropsychiatric phenotypes in the literature (online Supplementary material). SNPs in the rows are ordered by position in the gene starting with 3′ and ending with 5′.
b Values > 0.2.
c Values > 0.5.
d Values > 0.8.
PBMCs study
D’ GS negatively correlated with GRIN2B expression in PBMCs (n = 46, Pearson's R = −0.26, R 2 = 0.068, p = 0.04). The R 2 of the association steadily increased when removing the observations with the greatest noise level (online Supplementary Fig. S1).
Behavioural study
Neuropsychology and behavioural performance
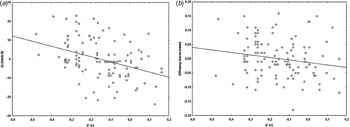
Online Supplementary Table S3 reports the results of the correlation analyses aimed to select covariates. IQ was associated with D’ GS (n = 116, overall R 2 = 0.14, F 2,113 = 10, p < 0.001). In particular, the linear D’ GS was negatively correlated with IQ (n = 116, R 2 = 0.15, t 114 = −4.4, p < 0.001; scatterplot in Fig. 4 a), whereas the quadratic D’ GS yielded no significant results (n = 116, R 2 = 0.002, t 114 = −0.5, p > 0.05). A repeated-measures ANCOVA examined efficiency scores as dependent variables with LOAD as within-subjects factor (1-, 2-, 3-back) and gender, D’ GS, IQ and efficiency at 0-back as predictors. This analysis yielded a significant main effect of D’ GS (n = 116, F 1,110 = 4.1, p = 0.044, partial η 2 = 0.036; scatterplot in Fig. 4 b). The negative relationship between mean accuracy in the WM tests and linear D’ GS suggested that putative greater GRIN2B transcription levels were associated with better WM performance across all WM levels. There was also a significant main effect of efficiency at 0-back (F 1,110 = 26, p < 0.001, partial η 2 = 0.19) and a significant LOAD × gender interaction after Greenhouse–Geisser correction (F 1.9,211 = 3.4, p = 0.037, partial η 2 = 0.03). There were no other significant effects.
(a) Partial regression plot of the association between D’ genetic score (GS) and intelligence quotient (IQ) measured using the Wechsler Adult Intelligence Scale-Revised (WAIS-R). The scatterplot reports D’ GS values on the x axis and unstandardized residuals of IQ on the y axis. The sample size is 116. The association is significant (p < 0.001). (b) Negative relationship between D’ GS and WM efficiency index. The partial regression plot reports D’ GS value on the x axis and unstandardized residuals of efficiency scores on the y axis. The association is significant (p = 0.044).

Imaging study
Neuroimaging results of the n-back WM paradigm
Main effect of the task
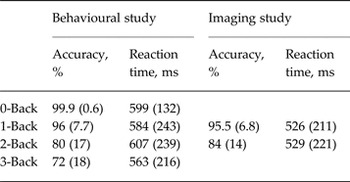
Table 4 reports behavioural data for the imaging sample. The one-sample t test aimed at identifying brain activity underlying WM revealed significant BOLD responses involving the fronto-parietal network, in keeping with prior reports (Callicott et al. Reference Callicott, Mattay, Bertolino, Finn, Coppola, Frank, Goldberg and Weinberger1999, Reference Callicott, Bertolino, Mattay, Langheim, Duyn, Coppola, Goldberg and Weinberger2000; Egan et al. Reference Egan, Goldberg, Gscheidle, Weirich, Rawlings, Hyde, Bigelow and Weinberger2001; Bertolino et al. Reference Bertolino, Caforio, Blasi, De Candia, Latorre, Petruzzella, Altamura, Nappi, Papa, Callicott, Mattay, Bellomo, Scarabino, Weinberger and Nardini2004).
Working memory performance (accuracy and reaction times during n-back) of the behavioural and imaging studies

Data are given as mean (standard deviation).
Association of D’ GS with prefrontal physiology during the n-back task
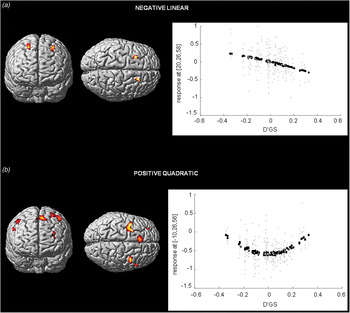
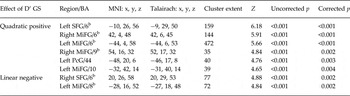
Table 5 reports the statistics and the localization of clusters of the main effects of D’ GS on brain activity in a within-subjects ANCOVA including 2-back > 0-back and 1-back > 0-back contrasts. We detected a negative linear association between D’ GS and PFC activation (BA 8; Fig. 5 a). No cluster was significant when we tested the positive slope of D’ GS. Moreover, we detected large clusters associated with the positive quadratic term of the D’ GS, implying that individuals with very high and very low predicted expression had greater prefrontal BOLD signal (BAs 6, 9, 10, 44; Fig. 5 b). No significant interaction between D’ GS or squared D’ GS and LOAD was found. These results suggest linear and non-linear relationships across different prefrontal regions between BOLD signal and predicted GRIN2B expression, despite controlling for IQ and behavioural efficiency. Evaluation of the results obtained with the D’ GSs computed at variable thresholds (online Supplementary Fig. S3) revealed a very similar pattern of prefrontal activity correlating with the GSs across different thresholds in terms of spatial localization and extent. This finding suggests that results are not strictly dependent on the statistical threshold chosen in the data-mining study. Additionally, online Supplementary Table S4 reports whole-brain statistics.
Association of the GluN2B coding gene (GRIN2B) D’ genetic score (D'GS) with prefrontal activity during working memory. Results are thresholded at peak-level family-wise error (FWE)-corrected p < 0.05 and cluster extent = 35, masked for significantly increased activity during 1-back and 2-back (null conjunction, FWE-corrected p < 0.05). Sample size = 122. (a) Clusters in which activity is negatively correlated with the linear term of D’ GS in coronal, sagittal and axial radiological views (left in the figure is left in the brain). (b) Clusters in which activity is positively correlated with the quadratic term of the D’ GS in coronal, sagittal and axial radiological views (left in the figure is left in the brain).

Statistics of the association between D’ GS and brain activity during working memory a

GS, Genetic score; BA, Brodmann area; MNI, Montreal Neurological Institute; SFG, superior frontal gyrus; MiFG, middle frontal gyrus; PcG, precentral gyrus;
a The model included the covariates: age, gender, intelligence quotient, handedness, efficiency index. Displayed clusters survived peak-level family-wise error-corrected threshold (p = 0.05).
b Results also surviving cluster-level family-wise error correction for multiple comparisons.
Discussion
This study aimed at detecting SNPs associated with GRIN2B transcription levels in human adults and at investigating their association with brain physiology during WM. To our knowledge, this is the first study using a multi-locus GS to combine eQTL effects of multiple SNPs. In particular, we have used a novel approach to obtain a D’ GS indexing prefrontal mRNA expression levels, such that it may model biological processes more closely as compared with previously used methodologies accounting for effects of multiple genetic variations. We validated this approach in a peripheral blood expression experiment. The present results suggest that alleles associated with moderate transcription levels of GRIN2B are associated with lower PFC activity during WM; even controlling for this effect, alleles associated with greater GRIN2B transcription levels in the postmortem DLPFC are also associated with higher IQ and WM efficiency, as well as with greater PFC activity during WM in healthy humans.
The role of GRIN2B in prefrontal activity during WM performance
GluN2B facilitates neuronal excitation by prolonging NMDA-R responses and promoting calcium influx (Cao et al. Reference Cao, Cui, Feng, Tang, Qin, Mei and Tsien2007; Wang et al. Reference Wang, Stradtman, Wang and Gao2008). Consistently, selective blockade of GluN2B in delay cells of the III layer of the DLPFC impairs WM, suggesting a key functional role of GluN2B in this cognitive skill and in its underlying physiology (Wang et al. Reference Wang, Yang, Wang, Gamo, Jin, Mazer, Morrison, Wang and Arnsten2013). However, it is unclear to what extent GluN2B-containing NMDA-Rs are beneficial or detrimental to neuronal activity. Although GluN2B promotes plasticity, the calcium influx it causes may underlie excitotoxic events (Zhou & Baudry, Reference Zhou and Baudry2006; Liu et al. Reference Liu, Wong, Aarts, Rooyakkers, Liu, Lai, Wu, Lu, Tymianski, Craig and Wang2007; Rodenas-Ruano et al. Reference Rodenas-Ruano, Chavez, Cossio, Castillo and Zukin2012). Indeed, abnormal GRIN2B expression in adults has been associated with neuropsychiatric disorders (Hardingham & Bading, Reference Hardingham and Bading2003; Clinton et al. Reference Clinton, Haroutunian and Meador-Woodruff2006; Kristiansen et al. Reference Kristiansen, Patel, Haroutunian and Meador-Woodruff2010).
In terms of prefrontal activation, the present findings suggest that moderate predicted levels of GRIN2B are associated with lower BOLD signal, which is often interpreted as a correlate of efficiency (Callicott et al. Reference Callicott, Mattay, Verchinski, Marenco, Egan and Weinberger2003), compared with genotypes predicting extreme GRIN2B expression levels. However, the findings from the linear contrast and from the cognitive and behavioural investigation render a more complex picture. First, even accounting for quadratic effects, IQ and WM efficiency, individuals with greater predicted GRIN2B expression had greater bilateral prefrontal activation. Second, even accounting for quadratic effects, the same genotypes were associated with higher IQ and greater WM behavioural efficiency – although the latter effect size is relatively small. Taken together, individuals with high predicted GRIN2B expression had high IQ, WM performance and prefrontal activity, whereas individuals with low predicted GRIN2B expression had low IQ and poor WM efficiency with high activity in BAs 6, 9, 10 and 44, and low activity in BA 8. The high prefrontal activity associated with superior IQ and WM efficiency in participants with high putative GRIN2B expression is consistent with the findings in animal models (Tang et al. Reference Tang, Shimizu, Dube, Rampon, Kerchner, Zhuo, Liu and Tsien1999, Reference Tang, Wang, Feng, Kyin and Tsien2001; Cao et al. Reference Cao, Cui, Feng, Tang, Qin, Mei and Tsien2007; von Engelhardt et al. Reference von Engelhardt, Doganci, Jensen, Hvalby, Gongrich, Taylor, Barkus, Sanderson, Rawlins, Seeburg, Bannerman and Monyer2008).
Genetic variants of GRIN2B associated with cognition and mental health
To our knowledge, none of the SNPs reported in the current study has been published previously in association with imaging phenotypes of cognitive performance. However, extant literature reports several SNPs located in GRIN2B associated with cognition and mental health, and several of them are tagged by the SNPs we found (see Tables 2 and 3). In particular, rs2160517 and rs12814951 are in LD with several SNPs previously associated with neuropsychiatric disorders (Demontis et al. Reference Demontis, Nyegaard, Buttenschon, Hedemand, Pedersen, Grove, Flint, Nordentoft, Werge, Hougaard, Sorensen, Yolken, Mors, Borglum and Mortensen2011; Alonso et al. Reference Alonso, Gratacos, Segalas, Escaramis, Real, Bayes, Labad, Lopez-Sola, Estivill and Menchon2012; Cai et al. Reference Cai, Zhang, Yi, Lu, Wu, Chen, Yu, Fang and Zhang2013; Weickert et al. Reference Weickert, Fung, Catts, Schofield, Allen, Moore, Newell, Pellen, Huang, Catts and Weickert2013; Zhang et al. Reference Zhang, Li, Wu, Chen, Wang, Peng, Hong, Yuan, Yu, Xu, Xu, Xiao and Fang2014) and with cognitive and behavioural phenotypes (Ness et al. Reference Ness, Arning, Niesert, Stuttgen, Epplen and Beste2011; Sokolowski et al. Reference Sokolowski, Ben-Efraim, Wasserman and Wasserman2013). In particular rs1805502, together with rs2160517 and rs12814951, is located in the 3′UTR (untranslated region) of GRIN2B, which has been hypothesized to play a regulatory function in the expression of GRIN2B (Di Maria et al. Reference Di Maria, Gulli, Begni, De Luca, Bignotti, Pasini, Bellone, Pizzuti, Dallapiccola, Novelli, Ajmar, Gennarelli and Mandich2004; Koronyo-Hamaoui et al. Reference Koronyo-Hamaoui, Frisch, Stein, Denziger, Leor, Michaelovsky, Laufer, Carel, Fennig, Mimouni, Ram, Zubery, Jeczmien, Apter, Weizman and Gak2007; Stein et al. Reference Stein, Hua, Morra, Lee, Hibar, Ho, Leow, Toga, Sul, Kang, Eskin, Saykin, Shen, Foroud, Pankratz, Huentelman, Craig, Gerber, Allen, Corneveaux, Stephan, Webster, DeChairo, Potkin, Jack, Weiner and Thompson2010; Zhang et al. Reference Zhang, Li, Wu, Chen, Wang, Peng, Hong, Yuan, Yu, Xu, Xu, Xiao and Fang2014). Therefore, the current results provide the first evidence on the possible mechanism of action of these SNPs associated with neuropsychiatric disorders, i.e. modulation of transcription levels. The evidence from the prefrontal data-mining study is considerably strengthened by the finding that D’ GS was associated with GRIN2B expression in PBMCs.
Validity of the methodological approach and limitations of the study
In the study of mental health and its neural correlates, imaging phenotypes have been regarded as an intermediate step between genes and behaviour, one that is ‘closer to the genes’ and could reflect the genetic architecture of cellular and brain physiology in healthy subjects (Callicott & Weinberger, Reference Callicott and Weinberger1999; Meyer-Lindenberg & Weinberger, Reference Meyer-Lindenberg and Weinberger2006; Birnbaum & Weinberger, Reference Birnbaum and Weinberger2013). However, eQTL studies typically select SNPs as categorical variables for the investigation of imaging or behavioural phenotypes (Blasi et al. Reference Blasi, Napolitano, Ursini, Di Giorgio, Caforio, Taurisano, Fazio, Gelao, Attrotto, Colagiorgio, Todarello, Piva, Papazacharias, Masellis, Mancini, Porcelli, Romano, Rampino, Quarto, Giulietti, Lipska, Kleinman, Popolizio, Weinberger, Usiello and Bertolino2013). Here, the effects detected in the fMRI analysis reflect the association between the target imaging phenotypes and differential transcription levels found in different genotypic populations, with the aim to increase the biological relevance of the findings. The statistic robustness of the results suggests that collapsing variance from multiple genetic variants improves the sensitivity of eQTL studies. The findings on D’ GSs computed with more lenient thresholds for SNP inclusion suggest that this approach is robust relative to SNP inclusion criteria and that the five main SNPs detected explain a large proportion of the GRIN2B expression variance.
Furthermore, our methodology is based on different assumptions relative to those of haplotype studies, in which SNPs are typically in LD. The assumption of statistical independence between SNPs was met both in the BrainCloud and imaging samples. The computational investigations carried out are reassuring with respect to the robustness of D’ GS, which accounted for over 20% of the variance of GRIN2B expression. The effect persisted with cross-validation, which suggests that the model did not overfit the data (Whelan & Garavan, Reference Whelan and Garavan2014).
Several questions remain open. For instance, we cannot rule out that the SNPs we found associated with transcription levels in human adults additionally affected GRIN2B expression during neural development (Constantine-Paton & Cline, Reference Constantine-Paton and Cline1998; Cull-Candy et al. Reference Cull-Candy, Brickley and Farrant2001; Sugiura et al. Reference Sugiura, Patel and Corriveau2001). GluN2B-mediated signals may also be integrated in different molecular contexts across the lifespan, as shown by evidence that only from late adolescence onward GluN2B signalling is mediated by protein kinase A and dopamine receptor D1 (Flores-Barrera et al. Reference Flores-Barrera, Thomases, Heng, Cass, Caballero and Tseng2014). Also noteworthy is that D’ GS does not account for interaction between SNPs (Nicodemus et al. Reference Nicodemus, Hargreaves, Morris, Anney, Gill, Corvin and Donohoe2014), although we did not find any interactions between SNPs on gene expression (data not shown). Finally, WM is not a homogeneous process and its component processes have been linked to different cortical and subcortical regions and circuits (Rottschy et al. Reference Rottschy, Langner, Dogan, Reetz, Laird, Schulz, Fox and Eickhoff2012). Prior evidence points to a crucial role of NMDA-Rs in WM maintenance (Wang et al. Reference Wang, Yang, Wang, Gamo, Jin, Mazer, Morrison, Wang and Arnsten2013).
Conclusions
GluN2B serves an important role in neurodevelopment of the DLPFC. Evidence from animal and human studies shows that this NMDA-R subunit underlies cognitive functions also in adults. We found that genotypes associated with GRIN2B expression in the DLPFC of human adults are also associated with IQ, behavioural scores and prefrontal activation with linear and non-linear patterns. Consistent with evidence from animal studies, relatively high GRIN2B expression appears associated with superior cognitive performance. The SNPs we selected are localized in the same LD block of several SNPs associated with neuropsychiatric disorders. We conclude that genetic regulation of GRIN2B transcriptional levels is associated with prefrontal physiology during WM in human adults.
Supplementary material
For supplementary material accompanying this paper visit http://dx.doi.org/10.1017/S0033291715002639
Acknowledgements
This work was supported by the ‘Capitale Umano ad Alta Qualificazione’ grant by Fondazione Con Il Sud awarded to A.B.; G.P. received research funding for this work from the University of Bari Aldo Moro (‘Progetti di ricerca di Ateneo, anno 2012’, code CUP H93G13000170005). Authors are grateful to Dr Gabriella Dellino, Dr Sonia Tangaro, Dr Nicola Amoroso, Dr Alfonso Monaco and Dr Juergen Dukart for helpful methodological insights. Data acquisition was only possible thanks to Dr Paolo Taurisano, Dr Raffaella Romano, Dr Annamaria Porcelli, Dr Marina Mancini, Tiziana Quarto and Linda Antonucci. Finally, we gratefully acknowledge the work by Brigitte Pietrangelo, Gabriele Scozia, Elsa Palmieri, Catia D'Agostino, Graziella Amico and Marco Papalino, who contributed to data analysis.
Declaration of Interest
A.B., G.B. and P.D.C. are consultants of Hoffman-La Roche, Ltd. G.P. is the academic supervisor of a collaborative research project with Hoffman-La Roche, Ltd. All other authors report no potential conflicts of interest.