Introduction
The WHO clearly states that overweight and obesity are among the greatest public health challenges of the century(1). The direct cost of treating obesity-induced diseases in European adults is estimated at approximately 7 % of health budgets, putting pressure on healthcare(2). While disrupted energy balance is a primary cause(Reference Blüher3), genetic predisposition, hormonal factors and medication also play significant roles(Reference Heymsfield and Wadden4). However, from a health interventionist perspective, targeting energy balance, determined by dietary intake, physical activity (PA), sedentary behaviour (SB) and sleep, is promising as these behaviours can be affected by behaviour change interventions.
While existing research has been innovative and valuable, tackling three shortcomings is essential to advance the field. First, diet, PA, SB and sleep are often studied in isolation, although the multiple health behaviour approach emphasises their strong interconnection(Reference Prochaska, Velicer and Nigg5,Reference Heino, Knittle and Noone6) . As Heino et al.(Reference Heino, Knittle and Noone6) underscore, such interrelated behaviours are core elements of complex systems: dynamic, intertwined processes are co-dependent and cannot be separated without losing essential information on how the system as a whole operates. Therefore, a more holistic approach is needed, and dietary intake, PA, SB and sleep should be examined simultaneously.
Second, day-to-day and within-day variations in behaviours and determinants are often neglected. Behaviours as well as determinants tend to vary daily and within days due to interactions between individuals and their changing interpersonal and environmental contexts(Reference Heino, Knittle and Noone6–Reference Chevance, Perski and Hekler8). These time-dependent variations (e.g. changes in environment, emotions) imply that maintaining a healthy lifestyle can be challenging over time. So, understanding the micro-temporal processes underlying these behaviours is crucial to promote a healthy lifestyle(Reference Dunton7). Despite this, behaviours are often measured at a single timepoint,(Reference Chevance, Perski and Hekler8,Reference Štefan, Petrinović and Sporiš9) and determinants are usually assessed only once, or repeatedly over longer periods. Instead, these factors should be considered as complex, potentially non-linear and dynamic(Reference Heino, Knittle and Noone6). Therefore, a shift from low- to high-resolution assessments of behaviours and determinants is necessary, requiring multiple repeated and detailed measurements.
Third, many studies focus on associations across persons. However, not everyone follows the same behaviour processes, a concept known as ‘non-ergodicity’, another key feature of complex systems. This implies that individual processes cannot be inferred from group-level data(Reference Heino, Knittle and Noone6). The lack of group-to-individual generalisability threatens the validity of results. Despite this, mainly group-level between-person associations between determinants and behaviours are currently being examined. Thus, disentanglement of within-individual processes is crucial by starting from the individual level instead of the group level.
To better understand these interconnected behaviours and their determinants, the ‘Leefwijzer 55+’ project was initiated to address these shortcomings, and the present paper should be considered as the feasibility and descriptive component of this larger project. The project uses a measurement burst design with repeated intensive longitudinal assessments across multiple timeframes(Reference Sliwinski10,Reference Stawski, MacDonald and Sliwinski11) . However, the feasibility and participant compliance of such a demanding design remains a critical concern in older adult populations, as low or selective compliance may result in incomplete or biased data(Reference Myin-Germeys and Kuppens12). This can limit insight into how multiple health behaviours and their determinants unfold in adults aged 55–75 years, when examined through a holistic lens(Reference Brewster, Rush and Ozen13). To our knowledge, no observational study has previously used a measurement burst design to simultaneously assess dietary intake, PA, SB, sleep and their determinants in this age group over a 12-month period. Consequently, limited evidence is available on the practical feasibility of implementing such a protocol, the level of participant compliance that can be achieved and the challenges that may arise during data collection. Therefore, as an initial step, the first aim of this paper is to evaluate the feasibility of the study protocol by (1) describing the study design and methodology, (2) assessing participant compliance and dropout and (3) reflecting on challenges encountered and lessons learned. The second aim is to present group-level patterns of behaviours and determinants across the measurement bursts, complemented by their day-level patterns.
Methods
This paper followed the STROBE guidelines for observational studies (see Supplementary file 1).
Participants and recruitment
Between November 2024 and January 2025, 130 healthy, community-dwelling, Dutch-speaking adults aged 55–75 years were recruited through convenience sampling in Flanders, Belgium. The study targeted adults aged 55–75 years due to high prevalence of overweight and obesity in this age group(Reference Van der Heyden, Renard and Scohy14).
Exclusion criteria were: (1) not being able to walk 100 metres, (2) not living independently at home, (3) cognitive impairment (score on the MoCa test of <24/30) and (4) individuals identified as physically frail. This study was conducted according to the guidelines laid down in the Declaration of Helsinki, and all procedures involving human subjects were approved by the Ethical Committee of Ghent University Hospital (registration number B6702024000361). Written informed consent was obtained from all subjects.
Study design
A 12-month observational study with a measurement burst design was conducted between January and December 2025 (see Figure 1). Participants received four bursts of seven consecutive days, separated by intervals of approximately 12 weeks without measurements. Data were collected at two levels: (1) at baseline: socio-demographics, health status and anthropometrics and (2) during bursts: dietary diary (on 4 of 7 days); continuous monitoring of PA, SB, sleep and time-based ecological momentary assessment (EMA) (6 times/day).
Intensive longitudinal study with measurement burst design.

At baseline, participants completed the Tilburg Frailty Indicator(Reference Gobbens, Boersma and Uchmanowicz15), the MoCa test, a baseline questionnaire and anthropometric measurements during the first appointment. All appointments were conducted in person, either during a home visit or on campus, depending on participants’ preferences. Participants then received face-to-face instructions for the measurement period, supported by a user manual and training session for using the smartphone applications and accelerometers. The applications were installed on participants’ smartphones(Reference O’Brien, Dozo and Hinton16,Reference Lucassen, Brouwer-Brolsma and Boshuizen17) , and a Motorola G20 was provided to those without one. Participants were guided through a hands-on demonstration of each smartphone application. Each 7-day burst started after the first appointment, and all measurement instruments were collected during a second in-person appointment. During each burst, participants could contact the research team by telephone or e-mail in case of questions or technical difficulties. If needed, additional oral instructions were given by telephone or a supplementary in-person meeting was arranged. Compliance with the time-based EMA protocol was monitored through the SEMA platform, and participants were contacted by telephone or e-mail when their response rate was approximately below 33 %, to verify whether they were receiving the EMA prompts as intended. Between bursts, participants were not required to complete study-related activities. At the start of bursts 2, 3 and 4, participants were contacted personally by telephone to confirm their willingness to continue participation and to schedule the next measurement period. For bursts 2, 3 and 4, a condensed version of the protocol was implemented, during which participants received a brief refresher on the use of both smartphone applications and were provided with the accelerometers, without repeating the full training and application installation procedure conducted at baseline. The same variables were measured across all bursts.
Measurements
Baseline
Socio-demographic variables included age, gender, educational level, marital status, living situation, main occupation, living environment and smoking status. Self-perceived health status was measured using the Dutch EQ-5D-5L questionnaire(Reference Nicolas Bouckaert, Devriese and Cleemput18), and medication use was assessed. Body weight was measured using a validated scale (Tanita). Height was self-reported. Waist and hip circumference were assessed using a standard anthropometric tape.
Dietary intake
Participants reported all food and beverage intake on 4 of 7 days (i.e., day 1, 3, 5 and 7) using Traqq, a dietary assessment app developed by Wageningen University(Reference Lucassen, Brouwer-Brolsma and van de Wiel19), and adapted to the Flemish population. Upon opening the app, a searchable food list, based on the Belgian Food Composition Database(Reference Seeuws20), was available. For each item, participants were asked to report quantity (i.e., in household measures, standard portion sizes or grams), timepoint and eating occasion.
Physical activity and sleep
PA and sleep were objectively measured with the GENEActiv (GENEActiv Original), a triaxial and validated research-based accelerometer(Reference Eslinger, Rowlands and Hurst21). The device was continuously worn on the non-dominant wrist for 7 days and 8 nights, 24 hours per day.
Sedentary behaviour
An ActivPAL4 accelerometer (PAL Technologies) was attached on the midline of participants’ right anterior thigh with a waterproof sticker, enabling continuous wear for 24 hours per day over 7 days. The ActivPAL is widely regarded as the gold standard for objectively measuring SB(Reference Kozey-Keadle, Libertine and Lyden22).
Time-based ecological momentary assessment
Determinants were assessed through time-based EMA, a method involving repeated sampling of experiences in people’s everyday lives and enabling the assessment of determinants in real-life situations at multiple moments throughout the day(Reference Myin-Germeys and Kuppens12).To minimise participant burden, six EMA assessments per day were used(Reference Maes, Mertens and Poppe23–Reference Cnudde, De Vylder and Cardon25). Data were collected with SEMA3 (version 1.4.5), a software tool accompanied by a mobile application designed for time-based EMA studies(Reference O’Brien, Dozo and Hinton16). SEMA3 randomly selects a triggering time within six predetermined 1-hour blocks (8·15–9·15; 10·45–11·45; 13·15–14·15; 15·45–16·45; 18·15–19·15, 20·45–21·45), which were chosen based on previous research(Reference Maes, Mertens and Poppe23–Reference Cnudde, De Vylder and Cardon25). If participants did not respond, up to two reminders were send, and the questionnaire became inaccessible after 30 min.
The selected determinants align with the COM-B framework (see Figure 2)(Reference Michie, Van Stralen and West26), a comprehensive theoretical framework with four constructs for understanding and promoting health behaviours. Previous EMA research has shown that these determinants are time-dependent in older adults, with momentary assessments linked to subsequent PA(Reference Maes, Mertens and Poppe23,Reference Maes, Mertens and Poppe24,Reference Delobelle, Compernolle and Vetrovsky27) and snacking patterns(Reference Cnudde, De Vylder and Cardon25). All questions used were based on these EMA studies.
COM-B model adapted from Michie et al. (2011)(Reference Michie, Van Stralen and West26).

Figure 2. Long description
Conceptual model based on the COM-B framework showing that capability (physical: pain, fatigue; psychological: stress, fatigue), motivation (reflective: intention, self-efficacy; automatic: emotions), and opportunity (social and physical context) influence health-related behaviours, including physical activity, sedentary behaviour, diet, and sleep. Capability and opportunity also interact with motivation.
Stress, fatigue and pain
Stress and fatigue were captured on a seven-point Likert scale with the question ‘How stressed/fatigued were you just before you received the trigger?’. Answers ranged from 1 (strongly disagree) to 7 (strongly agree). Pain was assessed with a Visual Analog Scale (0–100), with the question ‘How much pain do you have right now?’.
Physical and social context
To assess the physical context, participants indicated whether they were indoors or outdoors. Those who were indoors specified their location from: home, work, home of relatives or friends, shop, catering facility, public space, sports hall, on the go or other. For those who were outdoors, answer categories included natural environment, built environment, private environment or other.
Social context was assessed by asking ‘Are you alone at the moment?’. If not, participants selected from: partner, relative(s), friend(s), colleague(s), caregiver(s), neighbour(s), acquaintance(s), someone I don’t know or others.
Emotions, intention and self-efficacy
Positive emotions (relaxation, satisfaction and cheerfulness) and negative emotions (anxiousness, feeling down and loneliness) were captured on a seven-point Likert scale. Mean scores were calculated separately for positive and negative emotions. An example is ‘How relaxed were you just before you received the trigger?’ with answers ranging from 1 (not at all relaxed) to seven (completely relaxed).
Intention and self-efficacy were assessed separately for PA, SB and diet. To reduce participant burden, each EMA-trigger randomly presented only one question about intention and one about self-efficacy. These were assessed respectively by the items ‘In the next hour, I intend/feel able to eat healthy/ limit my sitting/ be active for at least 10 min’. Answers ranged from 1 (strongly disagree) to 7 (strongly agree).
Data processing and statistical analyses
Dietary intake
Data were processed using the Compl-eat computation module(Reference Meijboom, van Houts-Streppel and Perenboom28), which calculates total energy, macro- and micronutrients and food group intakes based on the Belgian Food Composition Database(Reference Seeuws20). Two trained dieticians reviewed the data following a standardised protocol and corrected implausible entries using standard portion sizes and recipes(Reference Lucassen, Brouwer-Brolsma and Slotegraaf29). Because self-reported dietary intake is prone to misreporting, which can bias intake estimates(Reference Ambrus, Horváth and Farkas30), days with under- and over-reporting were identified and excluded using the Willet cut-offs (i.e., men: <800 or >4200 kcal, women: <500 or >3500 kcal)(Reference Willett31). The following variables are included: total energy intake (kcal) and macronutrient intakes expressed as energy percentages (en%), including protein, fat, saturated fatty acids (SFA), carbohydrates, mono- and disaccharides and alcohol, as well as fibre intake (gram).
Physical activity and sleep
Raw data were stored as binary files using GENEActiv PC software (https://activinsights.com/) and processed with the R-package GGIR(Reference van Hees, Sabia and Patterson32). Acceleration was sampled at 85,70 Hz. Wear and non-wear time were identified by the procedure outlined by Van Hees et al., and a day was considered valid if wear time is >16 hours (default)(Reference van Hees, Sabia and Patterson32). Participants reported when they went to bed and woke up in a paper-based diary, which was used in GGIR’s sleep-log function to distinguish daytime from nighttime and to define the sleep period. The following sleep variables were derived: sleep duration, sleep latency (i.e., time between going to bed and falling asleep) and sleep efficiency (i.e. percentage of time in bed spent asleep)(Reference van Hees, Sabia and Patterson32). Cut points for (older) adults by Dillon et al.(Reference Dillon, Fitzgerald and Kearney33) were used to categorise individual minutes as light (105·6 mg), moderate (174·2 mg) or vigorous physical activity (≥330 mg). A burst was considered valid when a participant had at least 4 of 7 days of valid wear time(Reference Van Dyck, Herman and Poppe34).
Sedentary behaviour
Data were downloaded and processed using the manufacturer’s proprietary software (activPAL 173 Professional v9.1.5.179). A day was classified as invalid if postural variation was minimal (i.e. ≥95 % of wear time spent in a single activity) or if valid wear time was <10 hours(Reference Morris, Murphy and Shepherd35,Reference Winkler, Bodicoat and Healy36) . The ‘Time in bed adjustment’ tool of PAL analysis (v9.2.3.119) was used to manually verify the algorithms that exclude sleep from the analysis. Any discrepancies between the self-reported timepoints and algorithm-derived sleep times were adjusted using the self-reported data(Reference Winkler, Bodicoat and Healy36). The following variables are included: step counts, sedentary time, lying time, standing time and stepping time. A burst was considered valid when a participant had at least 4 of 7 days of valid wear time(Reference Van Dyck, Herman and Poppe34).
Time-based ecological momentary assessment
All partially completed questionnaires were excluded, and participants with a burst-level compliance rate <50 % were not included in the analyses(Reference Myin-Germeys and Kuppens12).
Statistical analyses
Analyses were performed in Python (version 3.13.5). To evaluate the feasibility of the study design, a flow chart was created to visualise participant dropout, and a detailed overview of compliance rates for each health behaviour and time-based EMA, including the number of valid measurement days, was provided. Compliance rates were calculated according to Vachon et al., as the ratio of completed measurement occasions to the maximum number of measurement occasions(Reference Myin-Germeys and Kuppens12,Reference Vachon, Viechtbauer and Rintala37) . In the present study, this maximum was defined separately for each health behaviour and for time-based EMA. For health behaviours, the compliance was calculated relative to the theoretical maximum number of expected valid assessment days or nights, based on the study protocol for all recruited participants (e.g. 2080 days for dietary intake: 130 participants × 4 bursts × 4 days per burst). For time-based EMA, compliance was calculated relative to the number of prompts actually sent by SEMA3, as these represented the measurement occasions made available to participants, consistent with previous EMA studies(Reference Maes, Mertens and Poppe23–Reference Cnudde, De Vylder and Cardon25). To present the patterns of the health behaviours and determinants, group-level descriptive statistics (i.e., mean (M), standard deviation (SD), minimum, maximum) were calculated for each measurement burst and for the full study period, along with adherence to health behaviour recommendations. Histograms were constructed for each behaviour and determinant, including the median, Q1 and Q3. Additionally, an interactive dashboard was developed to visualise day-level patterns.
Results
Feasibility of the study protocol by assessing participant compliance and drop out
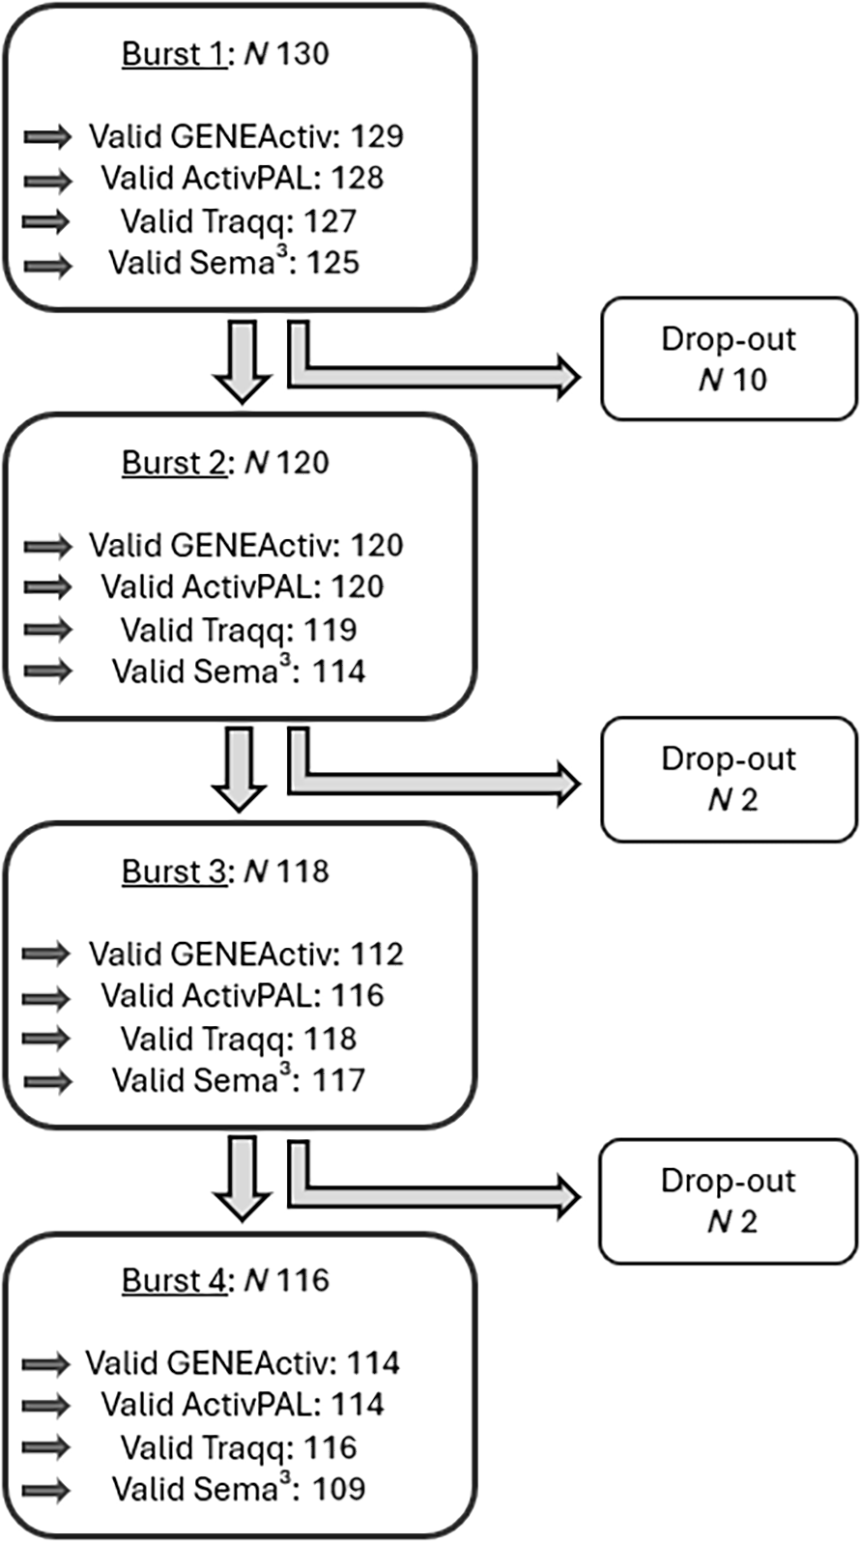
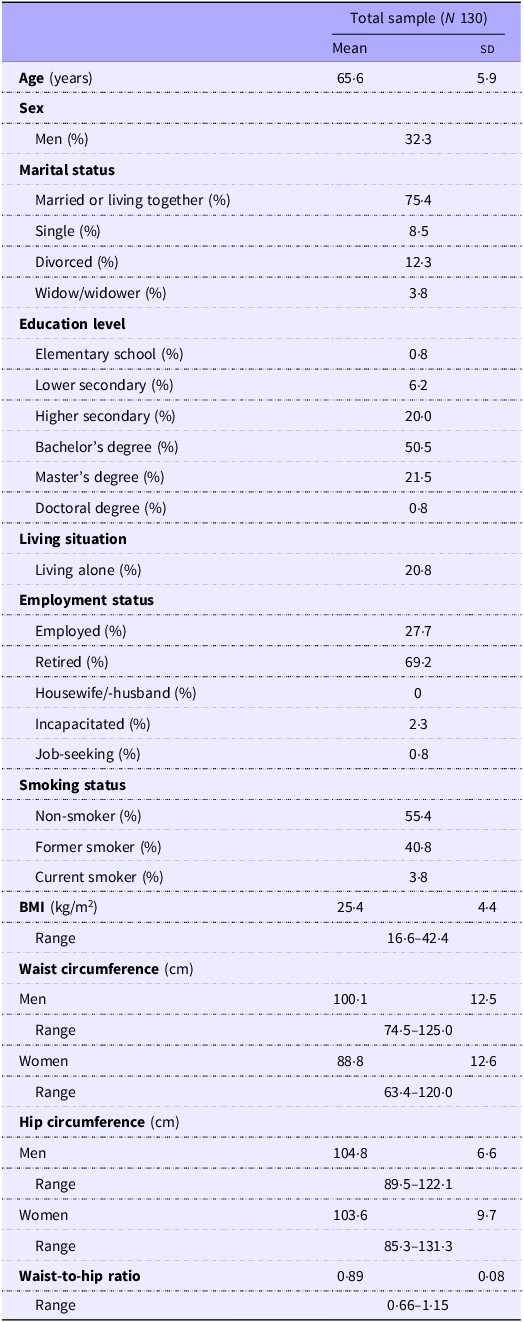
Figure 3 presents a flow chart illustrating participant dropout and the number of participants with valid data per measurement instrument. A total of 130 older adults were enrolled, and their socio-demographic characteristics are summarised in Table 1. Ten participants dropped out after the 1st burst due to: limited digital literacy combined with difficulty wearing the GENEActiv during sleep (n 1), concerns regarding the accuracy of dietary assessment (n 1), feeling stressed about completing time-based EMA questionnaires during work hours (n 1), feeling too busy (n 2), underestimating study burden (n 1) or unspecified reasons (n 4). Two additional participants withdrew after the 2nd burst and two more after the 3rd burst, all due to medical or practical circumstances rather than study burden. In total, 116 participants completed all four bursts, corresponding to a retention rate of 89·2 %.
Flow chart of the study sample and valid data per measurement instrument.

Sample characteristics

Table 1. Long description
Participant characteristics (n=130): mean age 65.6 years; 67.7% women; 75.4% married or living together; 72.8% had higher education; 20.8% lived alone; 69.2% were retired; 55.4% were non-smokers and 40.8% former smokers. Mean body mass index was 25.4 kg/m².
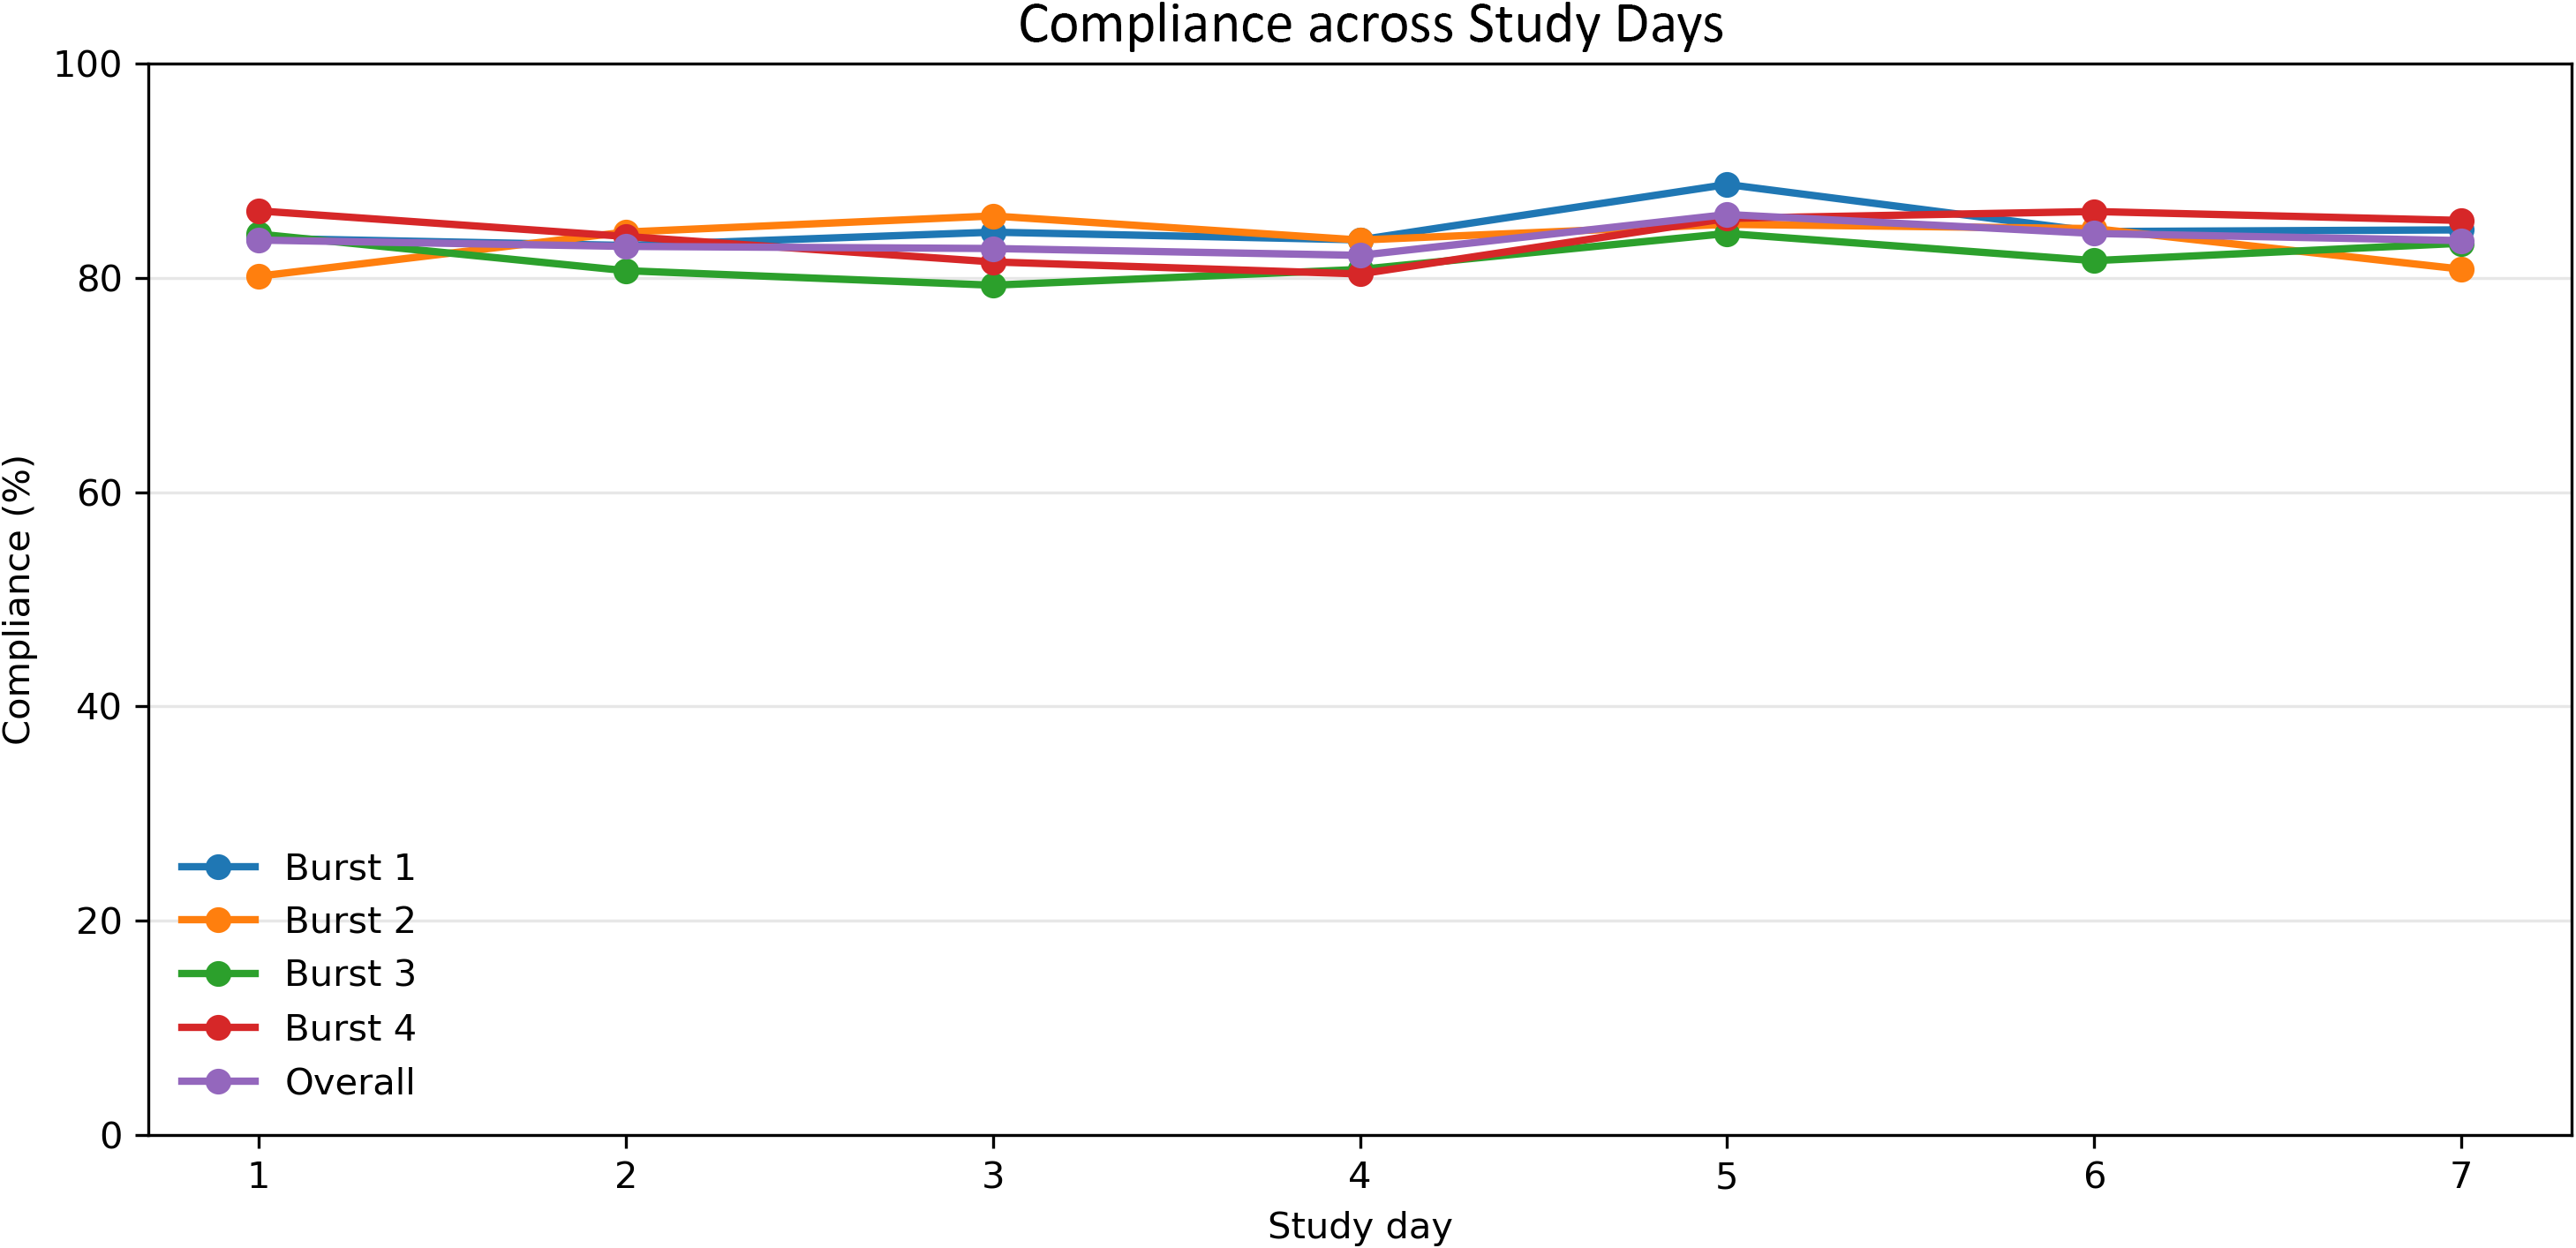
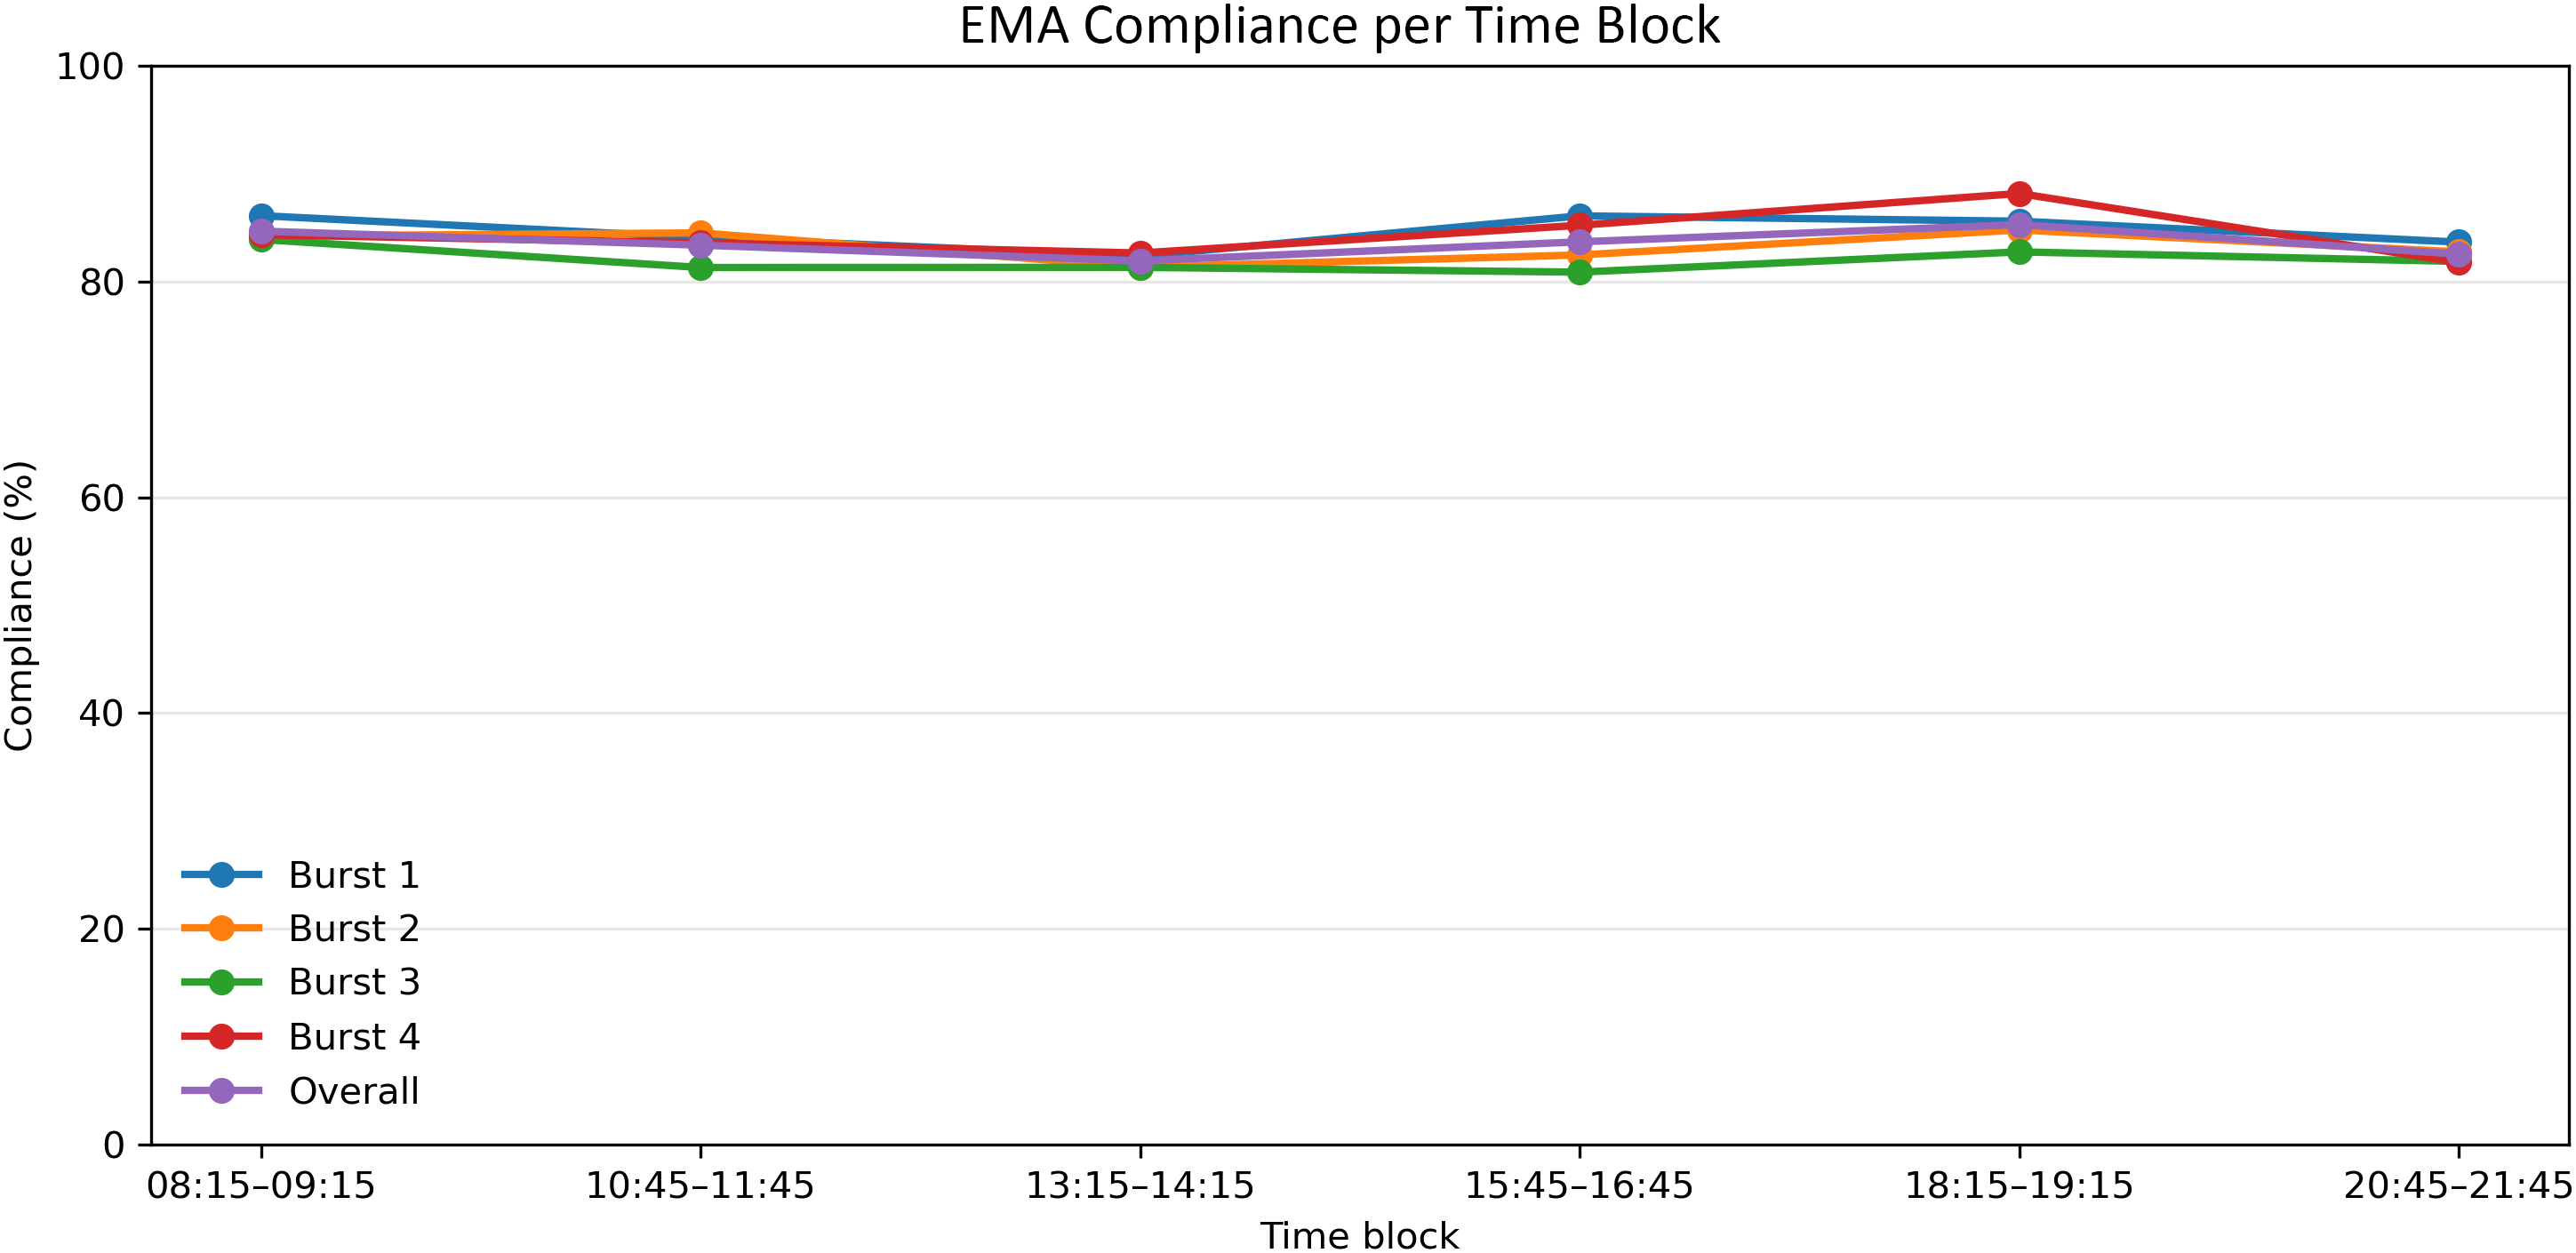
Compliance with each measurement instrument across the total study period is calculated. For dietary intake (Traqq), 1895 valid days were recorded out of maximum 2080 possible days, corresponding to a compliance of 91·1 %. 19 358 EMA prompts were sent, of which 16 174 were completed, resulting in an overall response rate of 83·5 %. Compliance with the EMA questionnaires across study days and time blocks is presented in Figures 4 and 5, respectively, and showed limited variation. Furthermore, for PA (GENEActiv), 3314 valid days were obtained out 3640, yielding a compliance rate of 91·0 %, and sleep assessed with the same device resulted in 3725 valid nights out of 4160 (compliance of 89·5 %). SB (ActivPAL) demonstrated with 91·8 % the highest compliance, with 3342 valid days out of 3640. Most data loss from the accelerometers was unintentional and primarily attributable to device loss, technical issues or skin irritation, rather than deliberate non-wear. More detailed burst-level information on dropout and non-compliance is presented in Supplementary file 2.
Compliance across study days.

Compliance across time blocks.

Patterns of behaviours and determinants
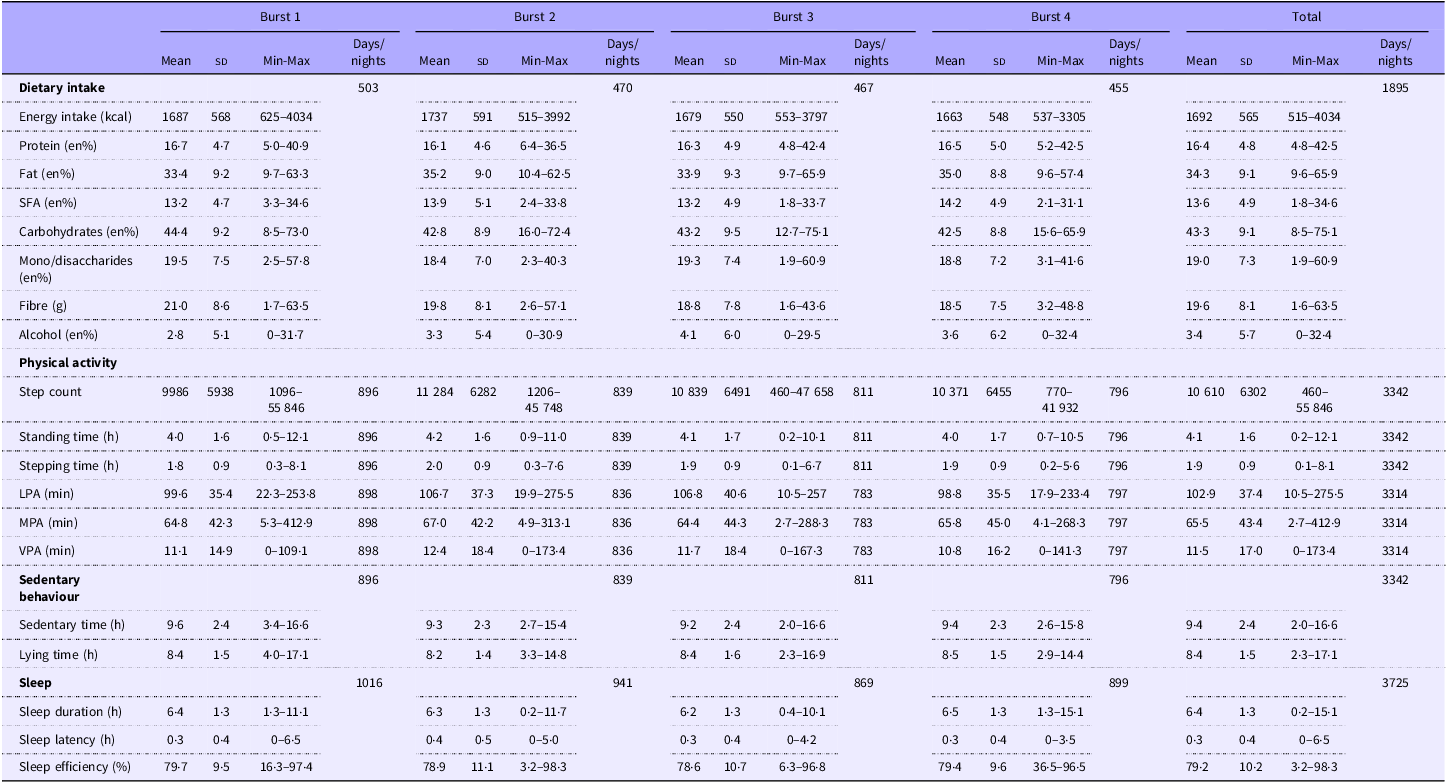
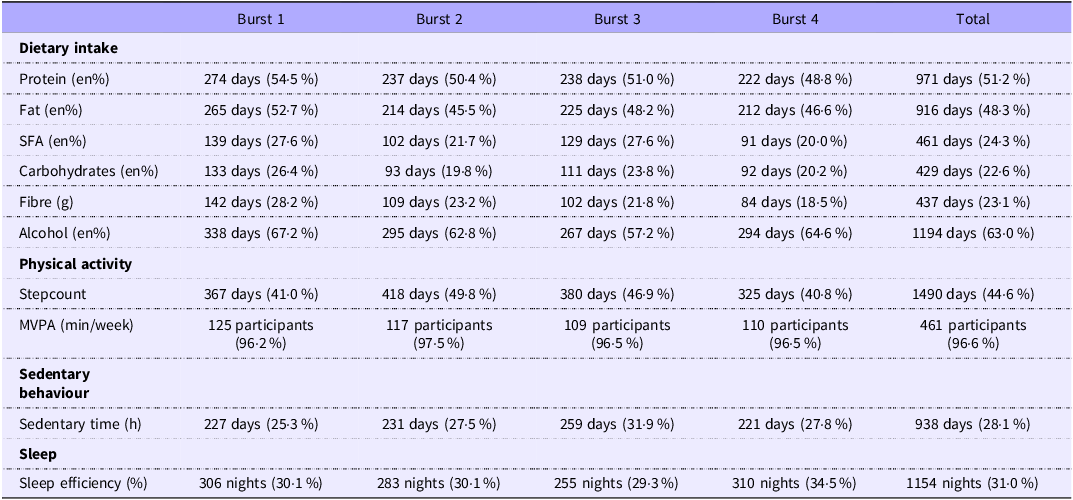
Descriptive statistics for the health behaviours are presented in Table 2. The study sample had a mean daily energy intake of 1692 kcal (sd = 565 kcal), mean sedentary time of 9·4 h (sd = 2·4), an average of 10 610 steps per day (sd = 6302) and mean light, moderate and vigorous physical activity levels of 102·9 min (sd = 37·4), 65·5 min (sd = 43·4) and 11·5 min (sd = 17·0), respectively. Participants showed a mean sleep duration of 6·4 h (sd = 1·3) and mean sleep efficiency of 79·2 % (sd = 10·2 %). Supplementary file 3 provides histograms for all behaviours and determinants, and Table 3 presents the percentage of days meeting the dietary, SB and sleep recommendations, as well as the percentage of participants meeting the PA guideline.
Descriptive statistics of health behaviours assessed per day

Table 2. Long description
Table presenting mean daily dietary intake, physical activity, sedentary behaviour, and sleep for each measurement burst and overall across bursts. Overall mean values showed an energy intake of 1692 kcal/day, comprising 16.4% of energy from protein, 34.3% from fat (13.6% saturated fat), 43.3% from carbohydrates (19.0% mono- and disaccharides), and 3.4% from alcohol. Participants accumulated an average of 10610 steps/day, spent 102.9 minutes/day in light-intensity, 65.5 minutes/day in moderate-intensity, and 11.5 minutes/day in vigorous-intensity physical activity, with 9.4 hours/day sedentary time. Mean sleep duration was 6.4 hours/night, with a mean sleep latency of 0.3 hours and mean sleep efficiency of 79.2%.
LPA, light physical activity; MPA, moderate physical activity; VPA, vigorous physical activity.
Number and percentage of days or participants meeting the health recommendations*

Table 3. Long description
Table showing the number and percentage of days on which participants met health recommendations, presented for each measurement burst and overall across the study period. Overall, recommendations were met on 63.0% of days for alcohol intake, 51.2% for protein intake, 48.3% for total fat intake, 44.6% for step count, 31.0% for sleep efficiency, 28.1% for sedentary time, 24.3% for saturated fat intake, 23.1% for fibre intake, and 22.6% for carbohydrate intake.
MVPA, moderate-to-vigorous physical activity.
*Day-level health recommendations were defined as protein intake ≥15 and ≤25 En%; total fat intake ≥20 and ≤30–35 En%; saturated fat intake <10 En%; carbohydrate intake ≥50–55 En%; fibre intake ≥25 g/d(Reference Gezondheidsraad42); alcohol intake =0 En%; step count ≥10 000 steps/day(Reference Ding, Nguyen and Nau43); sedentary time ≤8 h/d(Reference Stamatakis, Ekelund and Ding44) and sleep efficiency ≥85 %(Reference Ohayon, Wickwire and Hirshkowitz45). PA guidelines were defined as ≥150 min/week of MPA, ≥75 min/week of VPA or a combined total of ≥150 min/week calculated as [MPA + (2 × VPA)](Reference Bull, Al-Ansari and Biddle46).
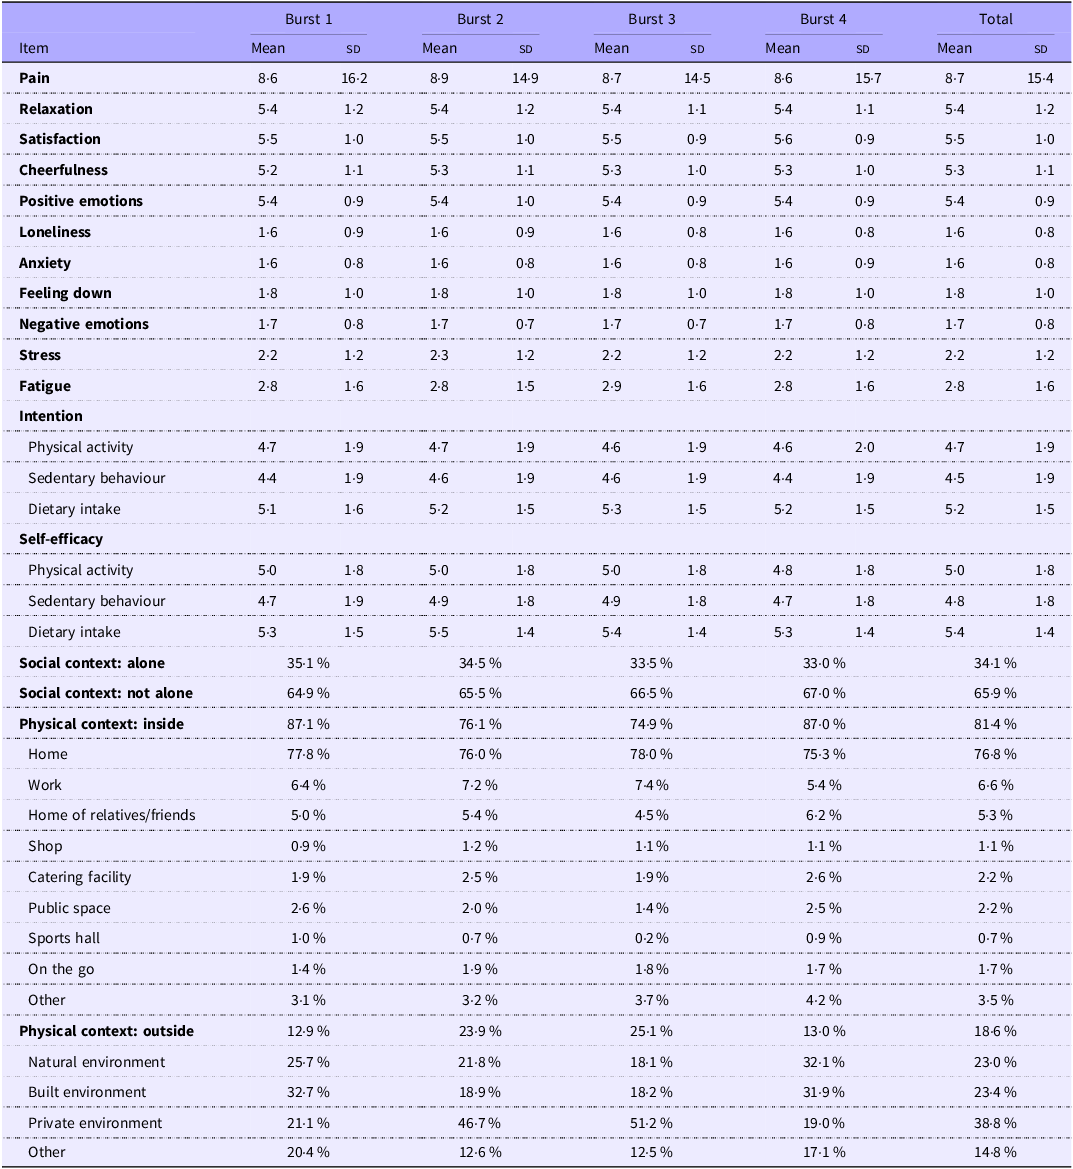
Descriptive statistics for the EMA items are presented in Table 4. Mean levels of negative emotions were 1·7 (sd = 0·8), whereas mean levels of positive emotions were 5·4 (sd = 0·9) on a seven-point scale. Participants reported means levels of pain, stress and fatigue of 8·7, 2·2 and 2·8 (sd = 15·4, 1·2 and 1·6), respectively. Mean values for intention and self-efficacy ranged from 4·5 to 5·4. Regarding social and physical context, participants were alone in 34·1 % of assessments, and indoors in 81·4 % of cases, most often at home (76·8 %).
Descriptive statistics of the EMA items

Table 4. Long description
Table presenting descriptive statistics (mean and standard deviation) for ecological momentary assessment (EMA) items, reported for each measurement burst and overall across all bursts. Overall mean scores were 8.7 for pain, 5.4 for relaxation, 5.5 for satisfaction, 5.3 for cheerfulness, 5.4 for positive emotions, 1.6 for loneliness, 1.6 for anxiety, 1.8 for feeling down, 1.7 for negative emotions, 2.2 for stress, and 2.8 for fatigue. Mean intention scores were 4.7 for physical activity, 4.5 for sedentary behaviour, and 5.2 for dietary intake. Mean self-efficacy scores were 5.0 for physical activity, 4.8 for sedentary behaviour, and 5.4 for dietary intake. Participants were alone in 34.1% of assessments. Among assessments indicated "inside", participants reported being at home in 76.8% of assessments.
EMA, ecological momentary assessment.
*All items had a response range of 1–7 except for the pain measure, which ranged from 0 to 100.
At the group level, descriptive statistics provide an overview of behaviours (Table 2) and determinants (Table 4) across the four measurement bursts. For example, mean daily step count ranged from 9986 steps in the first burst to 11 284 steps in the second, 10 839 steps in the third and 10 371 steps in the fourth burst. The day-level dashboard reveals additional insight into weekday-specific patterns. Within the 1st burst, for instance, mean step count differed by weekday, with 9350 steps on Monday, 9893 on Wednesday and 10 641 on Saturday. The interactive dashboard enables further exploration of such day-level patterns: https://burst-analytics-sbsm.onrender.com/.
Discussion
To our knowledge, this is the first observational study with a measurement burst design to simultaneously collect data on dietary intake, PA, SB, sleep and determinants in adults aged 55 to 75 years over a 12-month period. The present paper aimed to (1) evaluate the feasibility of the study protocol by describing the study design and methodology, assessing participant compliance and dropout, and reflecting on challenges and lessons learned and (2) provide a descriptive overview of group-level and day-level patterns of behaviours and determinants across the bursts.
Patterns of behaviours and determinants
Group-level patterns of behaviours and determinants showed only limited variation across the four bursts, raising the question of whether multiple bursts are necessary. However, the day-level dashboard revealed that aggregating data may obscure meaningful fluctuations that only become visible at finer timescales. Moreover, group-level stability does not guarantee that patterns within individuals remain stable over time. Additional fluctuations may appear at even more fine-grained timescales (e.g. within-day dynamics), or at the person-level, where subgroup differences and within-person fluctuations may diverge from group-level statistics. Although an in-depth exploration of the dataset’s longitudinal structure is beyond the scope of this paper, future analyses using the full temporal hierarchy and multiple person-levels will allow a more detailed examination of temporal dynamics and within-person variability.
The differences between aggregated and day-level patterns also become clear when examining adherence to health recommendations. The low adherence rates stand in contrast to the relatively favourable mean values. For instance, although mean energy intake was relatively low (1692 kcal) and mean protein intake (16·4 En%) fell within the advised 15–25 En%, dietary intake quality at the macronutrient level deviated frequently from guidelines. Daily protein intake met the recommendation on only 51·2 % of days, and fat intake fell within the recommended 20–35 En% on 48·3 % of days. Adherence was considerably lower for SFA (<10 En%; 24·3 % of days), carbohydrate intake (50–55 En%; 22·6 % of days) and fibre intake (≥25 gram/day; 23·1 % of days). These discrepancies highlight that labelling a study sample as ‘healthy’ based solely on mean values is misleading, as such statements can only be substantiated by comparing adherence rates.
Feasibility of the study protocol by assessing participant compliance and drop out
Regarding feasibility, findings demonstrated high participant compliance, even when combining multiple measurement instruments. Overall, 89·2 % of participants completed all measurement bursts, with most attrition occurring after the first burst. This suggests that once participants became familiar with the study protocol, those who continued were both willing and able to adhere to it. Compliance with the smartphone applications was generally high, reinforcing evidence that older adults can effectively use applications when provided with clear guidance(Reference Compernolle, Vetrovsky and Maes38). For the time-based EMA questionnaires specifically, Figures 4 and 5 showed only limited variation in compliance across study days and time blocks, indicating relatively stable compliance across bursts. Given that missing data are common in EMA studies due to the intensive and repeated assessments over time(Reference Myin-Germeys and Kuppens12), these findings suggest that participant engagement was successfully maintained throughout the study period.
To better understand the high level of feasibility, it is important to consider the factors that may have facilitated such high compliance. A first explanation may be the precautions that were implemented to minimise participant burden. First, a measurement burst design was used, incorporating 12-week intervals without measurements to prevent sustained measurement fatigue. Second, EMA surveys were limited to six brief prompts per day. Third, dietary intake reporting was restricted to 4 days. A second explanation may be the support provided by the research team during the measurement bursts. Participants occasionally contacted the researchers with questions or technical difficulties, particularly during the first burst. Because multiple participants were enrolled simultaneously, individual support requests occurred on an almost daily basis during this period, although most participants did not require frequent assistance. The need for support decreased substantially in subsequent bursts as participants became more familiar with the procedures. A third explanation relates to the characteristics of the study sample. Convenience sampling resulted in an overrepresentation of women, highly educated individuals and relatively healthy and digitally literate participants. This sampling bias may have contributed to the high compliance and low dropout and limits the generalisability of the findings to the broader older adult population. Therefore, similar compliance rates may not necessarily be expected in a more representative sample, particularly among, for example, individuals with lower digital literacy. Previous EMA research has demonstrated that compliance may vary according to participant characteristics, with lower compliance observed among older adults and individuals with less experience using smartphone technology(Reference Compernolle, Vetrovsky and Maes38–Reference Sun, Jaiswal and Slade40). Further, no financial incentives were provided. Instead, participants received a personalised report summarising their individual and overall study findings. While this non-financial incentive may have supported engagement, it may also have reinforced sampling bias by particularly attracting individuals who were already interested in health-related topics. However, given the innovative nature of this study, the priority was on accurately capturing participants’ daily lives and ensuring some diversity, rather than achieving population representativeness. Specifically, minimising non-compliance and missing data was essential, as both lead to an inaccurate representation of an individual’s daily life(Reference Wang, Intille and Ponnada41). Future research should examine the protocol in a representative sample to further assess its feasibility and generalisability.
Throughout the study, several challenges were encountered and addressed, providing valuable lessons for future research. The use of the SEMA3-application resulted in recurrent technical issues. Therefore, the research team developed a document summarising the most common problems and corresponding solutions to support participants. Additionally, compliance was monitored via the SEMA3 dashboard, allowing rapid identification of low response rates and enabling researchers to proactively contact participants when issues were detected. Finally, when notification sounds failed, participants received the prompt schedule and advised to set smartphone alarms.
From the start of the first burst, it became clear that accurately reporting dietary intake was challenging for many participants. Participants occasionally omitted food items or reported incorrect portion sizes (e.g. entering six whole cauliflowers instead of six cauliflower florets)(Reference Ambrus, Horváth and Farkas30). This was mainly caused by limited awareness of how to record food intake adequately, insufficient knowledge of food composition and habitual, automatic dietary intake. To improve data quality, several measures were implemented. First, an additional practice exercise was provided at the start of the second burst. Second, when specific food items were unavailable in the application, participants were instructed to select the closest matching food item. Third, when entries were forgotten, participants were instructed to make notes for later digital entry. Fourth, researchers verified the food records carefully before the second appointment and reviewed entries together with participants to correct inaccuracies. These experiences highlight the importance of not over-estimating participants’ prior knowledge of dietary recording, as accurate logging is not self-evident for everyone.
Finally, an overarching lesson concerned the value of a personalised and participant-centred approach. Tailoring the location and timing of the appointments in consultation with participants, and maintaining regular contact, appeared to support engagement and study progression. Based on researcher observations, this individualised approach contributed to participant adherence and overall compliance.
Strengths and limitations
This study has several strengths. First, it adopted a more holistic perspective by simultaneously collecting data on diet, PA, SB, sleep and their determinants in adults aged 55–75 years. Second, the measurement burst design enabled 28 days of objective, detailed behavioural monitoring throughout the year, combined with time-based EMA, without overburdening participants. This facilitated a shift from low- to high-resolution assessments. Third, the design enables analyses at both group- and individual-levels, and this paper has already reported detailed group-level descriptives. However, two implementation-related limitations of the measurement burst design should be acknowledged. First, although bursts were scheduled approximately 12 weeks apart, the intervals between bursts were not exactly identical for all participants. This may have introduced some heterogeneity in the timing of repeated assessments and should be considered in future longitudinal analyses. Second, participants did not all start their 7-day measurement period on the same day of the week. Consequently, the correspondence between study days (days 1–7) and calendar days (Monday–Sunday) varied across participants. For example, dietary intake was assessed on days 1, 3, 5 and 7, resulting in variation in the weekdays covered across participants. Nevertheless, strict standardising of both the start day and the exact interval between bursts was not feasible within the real-world context of the study.
Conclusion
In conclusion, this paper demonstrated the feasibility of studying MHB in adults aged 55–75 years by combining dietary assessment, accelerometery and time-based EMA within a measurement burst design. Even with the protocols’ complexity, participant compliance was high, likely supported by efforts to minimise participant burden, although sampling bias may have affected this. Across the four bursts, group-level patterns of behaviours and determinants showed limited variation, yet day-level visualisations revealed more pronounced variability, illustrating how aggregated data can mask meaningful temporal dynamics. The contrast between the relatively favourable mean values and rather low day-level adherence to health recommendations further underscores the added value of examining behaviours and determinants in more detail. Although an in-depth exploration of the dataset’s rich longitudinal structure fell beyond the scope of this paper, future analyses using the full temporal hierarchy and multiple person-levels will allow more detailed examination of temporal dynamics and within-person variability.
Supplementary material
To view supplementary material for this article, please visit https://doi.org/10.1017/S0007114526108526
Data availability statement
All documents, datasets and scripts referenced in this paper and generated as part of the research project ‘Leefwijzer 55+’ are available in the Open Science Framework repository: https://doi.org/10.17605/OSF.IO/GR2K6.
Acknowledgements
The authors would like to thank Dr. Ruben De Blaere for his valuable assistance with programming and all participants of the study for their volunteering.
Author contributions
K.C.: Conceptualisation-Equal, Data curation-Lead, Formal analysis-Lead, Funding acquisition-Equal, Investigation-Lead, Methodology-Equal, Project administration-Lead, Resources-Equal, Visualisation-Lead, Writing – original draft-Lead; L.M.: Supervision-Equal, Writing – review & editing-Equal; F.D.B.: Funding acquisition-Supporting, Supervision-Equal, Writing – review & editing-Equal; F.O.: Funding acquisition-Supporting, Supervision-Equal, Writing – review & editing-Equal; D.V.D: Conceptualisation-Equal, Funding acquisition-Equal, Methodology-Equal, Supervision-Lead, Writing – review & editing-Lead.
Financial support
This work was supported by the Research Foundation Flanders (FWO) [grant number 1120725N].
Competing interests
The author(s) declare none.