

Introduction
At present, chicken species are considered an important source of human food around the globe, as well as a model organism for research. As a result of domestication events, greatly influenced by human activities, divergent varieties of chicken from wild to commercial types contribute to the biodiversity of the current genetic pool. There is a controversial discussion whether domesticated chickens descend from a single ancestor; the Red Jungle-Fowl (RJF) in Southeast Asia (Fumihito et al., Reference FUMIHITO, MIYAKE, SUMI, TAKADA, OHNO and KONDO1994; Hillel et al., Reference HILLEL, GROENEN, TIXIER-BIOCHARD, KOROLD, DAVID, KIRZHNER, BURKE, BARRE-DIRIEF, CROOIJMANS, ELO, FELDMAN, FREIDLIN, MÄKI-TANILA, OORTWIJN, THOMSON, VIGNAL, WIMMERS and WEIGEND2003; Twito et al., Reference TWITO, WEIGEND, BLUM, GRANEVITZE, FELDMAN, PERL-TREVES, LAVI and HILLEL2007) or that multiple origins have contributed to the current chicken (Nishibori et al., Reference NISHIBORI, SHIMOGIRI, HAYASHI and YASUE2005; Liu et al., Reference LIU, WU, YAO, MIAO, LUIKART, BAIG, BEJA-PEREIRA, DING, PALANICHAMY and ZHANG2006a; Oka et al., Reference OKA, INO, NOMURA, KAWASHIMA, KUWAYAMA, HANADA, AMANO, TAKADA, TAKAHATA, HAYASHI and AKISHINONOMIYA2007).
Village chickens, native and local middle-producing breeds represent a diverse and uniquely adapting gene pool (Granevitze et al., Reference GRANEVITZE, HILLEL, CHEN, CUC, FELDMAN, EDING and WEIGEND2007). The standard fancy breeds were utilised to synthesise cross-types, experimental inbred and highly specialised commercial types selected for high production (Crawford, Reference CRAWFORD1990). For instance, the improved Mediterranean types were the first chickens brought into Europe (Moiseyeva, 1996) and following this, Asian breeds of the Chinese and Malay type chickens were introduced. Much later, with the massive use of selection and crossbreeding, local breeds and lines in different parts of Europe were developed. In addition, European chickens were introduced to America following the arrival of the Spanish in the 15th century (Gongora et al., Reference GONGORA, RAWLENCE, MOBEGI, JIANLIN, ALCALDE, MATUS, HANOTTE, MORAN, AUSTIN, ULM, ANDERSON, LARSON and COOPER2008).
Asia and Europe each have more than 400 local chicken breeds, Africa and Latin America report more than 100 each, and Near and Middle East and North America report fewer than 40 each (Hoffmann, Reference HOFFMANN2009). Nonetheless, the fast growth of global chicken commercialisation, together with the advent of the highly pathogenic avian influenza H5N1 virus, increased the number of local chicken breeds to be under the threat of extinction (Hoffmann, Reference HOFFMANN2009). Therefore, a sobering awareness has been perpetuated to cope with chicken genetic diversity erosion as incentive to accessibility of the sustainable development of chicken genetic resources. The characterisation of the existing, enormous chicken genetic resources was undertaken utilising a patchiness of biochemical and molecular tools.
Considering microsatellites as highly polymorphic genomic markers, they reflect influences of the genetic diversity due to their high information content, and function in population identification and assignment. In this regard, Rosenberg et al. (Reference ROSENBERG, BURKE, ELO, FELDMAN, FREIDLIN and GROENEN2001) concluded that at least 12 to 15 highly variable microsatellites should be genotyped in at least 15 to 20 individuals per hypothesized-population to produce 90% of the clustering success. However, an increase of the investigated samples to 30 individuals per population is recommended to have a clustering success of more than 95% (Rosenberg et al., Reference ROSENBERG, BURKE, ELO, FELDMAN, FREIDLIN and GROENEN2001). Furthermore, considering neutrality of microsatellites makes them a maker of choice to yield a reliable picture of the diversity status away from selection effects.
Moreover, the use of single nucleotide polymorphisms (SNP) allows the capture of a greater part of the whole genomic variation and to achieve an assessment of the complete genetic variation. This can be achieved by analyses of different stable unlinked loci or haplotypes either in noncoding regions (synonymous neutral SNPs) or in functional genes (non-synonymous SNPs). Since the advent of high density SNP marker sets, it is possible to detect selection signatures and the extent of linkage disequilibrium across the genome inferring the genetics of adaptation and history of breeds. Furthermore, diversity of the mitochondrial-DNA (mtDNA) hypervariable region is helpful to adduce migration events and maternal lineages.
In this review we adduced some important features of chicken genome and genealogical origins of the contemporary chicken to supply a robust explanation of their genetic biodiversity. Furthermore, we reviewed the genetic diversity within and between current chicken populations fragmenting from wild to commercial types with focus on microsatellite, SNP and mtDNA-CR markers.
Special features of the chicken genome
The chicken was the first domestic animal to have its genome sequenced (Ellegren, Reference ELLEGREN2005). Early studies have revealed that bird genomes are approximately one-third the size of mammalian genomes (Waltari and Edwards, Reference WALTARI and EDWARDS2002). The draft of the chicken genome (International Chicken Genome Sequencing Consortium, Reference INTERNATIONAL CHICKEN GENOME SEQUENCING CONSORTIUM2004) was based on DNA from a single inbred female Gallus gallus gallus. Almost 86% of the 1,050 megabases (Mb) containing genome was anchored on specific chromosomes. Because of single copies of the Z and W chromosomes, these chromosomes were poorly represented in the final assembly, as well as the major histocompatibility (MHC) region on chromosome 16; a rich source of duplicated genes.
In 2006 Burt further re-sequenced the chicken genome to have an improved final assembly. In this assembly approximately 95% of the sequence of the 1050 Mb genome has been anchored to chromosomes, which include autosomes 1 to 28 and 32, two additional linkage groups, and sex chromosomes. However, Hillel et al. (Reference HILLEL, GRANEVITZE, TWITO, BEN-AVRAHAM, BLUM, LAVI, DAVID, FELDMAN, CHENG and WEIGEND2007) concluded afterwards that the current draft assembly for chromosome W is erroneous. Furthermore, Rubin et al. (Reference RUBIN, ZODY, ERIKSSON, MEADOWS, SHERWOOD, WEBSTER, JIANG, INGMAN, SHARPE, T, KA, HALLBÖÖK, BESNIER, CARLBORG, Ö., BED`HOM, TIXIER-BOICHARD, JENSEN, SIEGEL, P and K. AND ANDERSSON2010) used the Applied Biosystem SOLiD technology to generate 35-bp reads to obtain sequences from individual pools representing different four layer-lines, four broiler-lines and two zoo RJF populations. The 35-bp reads were placed uniquely to the Sanger-resequenced reference chicken genome (UCD 001 RJF-female). The produced 44.5-fold coverage represents 92% of the 1,043 Mb in the current genome assembly. There was an area of 90 Mb not covered by any reads, supposed to be repetitive sequences.
In parallel with the chicken genome sequencing project, a consortium (International Chicken Polymorphism Map Consortium, Reference INTERNATIONAL CHICKEN POLYMORPHISM MAP CONSORTIUM2004) generated 2.8 million SNPs from a comparison of the RJF reference sequence and partial genome scans of silkie, broiler, and layer lines. The identified nucleotide diversity was five SNPs per kb by comparing wild and domestic breeds and four SNPs per kb in broiler-broiler and layer-layer combinations. The SNP rates produced by these comparisons equal six times the rate found in humans (Ellegren, Reference ELLEGREN2005). Moreover, 70% of these SNPs are stable and common to all breeds, suggesting the existing of the chicken ancestry 5,000 to 10,000 years prior to their domestication. Another possibility is that their ancestry has been lost because of extensive crossbreeding between Asian and western poultry populations. The female-specific W-chromosome showed a 10 to 30 times lower genetic variation (Berlin and Ellegren, Reference BERLIN and ELLEGREN2004) than the autosomal genome while the male Z-chromosome had only a 3 to 4 times lower genetic variation (Sundström et al., Reference SUNDSTRÖM, WEBSTER and ELLEGREN2004).
In the European AVIANDIV project 145 SNPs were obtained through sequencing of 6,952 bp, representing 15 non-coding genomic DNA fragments in 10 distant chicken populations (10 samples per population) (Hillel et al., Reference HILLEL, GRANEVITZE, TWITO, BEN-AVRAHAM, BLUM, LAVI, DAVID, FELDMAN, CHENG and WEIGEND2007). The estimated SNP rate was on average one SNP per 50 bp. The recent re-sequencing work by Rubin et al. (Reference RUBIN, ZODY, ERIKSSON, MEADOWS, SHERWOOD, WEBSTER, JIANG, INGMAN, SHARPE, T, KA, HALLBÖÖK, BESNIER, CARLBORG, Ö., BED`HOM, TIXIER-BOICHARD, JENSEN, SIEGEL, P and K. AND ANDERSSON2010) revealed more than seven millions SNPs; >95% of them are truly confident. Almost 1,300 deletions were identified at least in one population in fixation. Seven of them are in coding sequences and may have played some role in chicken domestication. It is noticeable that the more different chicken populations included the more SNPs per bp were observed. Fang et al. (Reference FANG, YE, LI, ZHANG, LI, GANE and WANG2008) found SNP rates similar for all chromosomes; however, the recombination rates increased in micro-chromosomes. Nevertheless, regardless of the chromosome size, a positive correlation between nucleotide diversity and recombination rate was shown (r = 0.27, P < 0.0001).
Earlier reports (Primmer et al., Reference PRIMMER, RAUDSEPP, CHOWDHARY, MØLLER and ELLEGREN1997) have revealed low repetitive DNA content due to compact genomic structure; only 11% compared with 40 to 50% found in mammals. However, in the current chicken map, the microsatellite content was one locus per cM (International Chicken Genome Sequencing Consortium, Reference INTERNATIONAL CHICKEN GENOME SEQUENCING CONSORTIUM2004). Brandström and Ellegren (Reference BRANDSTRÖM and ELLEGREN2008) demonstrated approximately 375.000 genome-wide microsatellites with 2 to 5 bp repeat motifs. They noted a decrease of allelic-polymorphism rates with increasing repeat units and increasing GC content of repeat motifs. A negative correlation between microsatellite abundance and SNP density was obvious. Moreover, Ben-Avraham et al. (Reference BEN-AVRAHAM, BLUM, GRANEVITZE, WEIGEND, CHENG and HILLEL2006) identified 173 microsatellites on the W-chromosome that contained 2 to 6 bp repeat motifs with eight or more repeats. Therefore, the high ubiquity of bi-allelic stable SNPs detected through the chicken genome makes them promising in biodiversity studies together with the prevalent microsatellites.
Chicken genealogical origins
Considering archaeological records, the chicken's origin is pertained likely to RJF as early as 5400 BC (West and Zhou, Reference WEST and ZHOU1989). In addition, the involved cockfighting behaviour in ancient pictorial assembling supported the historical bibliographies inferring the initial human concern over chicken was for religion, decoration and entertainment. It is interesting that all of the discovered ancient Egyptian pictorial assembling around 1840 BC represent chicken roosters (Crawford, Reference CRAWFORD1990). This can be interpreted that male chickens implied more in the trade-way dispersal and domestication process across the world. By progress of human culture and activities, current chicken varieties have been developed, commonly for food consumption.
One of the first attempts to look for the genealogical origin of the present domestic chicken at mtDNA level was undertaken by Fumihito et al. (Reference FUMIHITO, MIYAKE, SUMI, TAKADA, OHNO and KONDO1994). They imposed the theory of monophyletic origin of the domestic chicken that descent was mainly from RJF subspecies in a region of Southeast Asia. This result was further supported by analysis of nuclear microsatellites (Hillel et al., Reference HILLEL, GROENEN, TIXIER-BIOCHARD, KOROLD, DAVID, KIRZHNER, BURKE, BARRE-DIRIEF, CROOIJMANS, ELO, FELDMAN, FREIDLIN, MÄKI-TANILA, OORTWIJN, THOMSON, VIGNAL, WIMMERS and WEIGEND2003) and nuclear non-linked SNP genotypes in a wide range of distant chicken populations (Twito et al., Reference TWITO, WEIGEND, BLUM, GRANEVITZE, FELDMAN, PERL-TREVES, LAVI and HILLEL2007). In addition, coding-SNP analysis at chicken lysozyme gene for species of genus Gallus and different domestic chicken revealed a closer relationship of RJF to domestic chickens than other fowl-species (Downing et al., Reference DOWNING, O'FARRELLY, BHUIYAN, SILVA, NAQVI, SANFO, SOW, PODISI, HANOTTE and BRADLEY2010). Based on morphological and biochemical markers, Moiseyeva et al. (Reference MOISEYEVA, ROMANOV, NIKIFOROV, SEVASTYANOVA and SEMYENOVA2003) reported the similarity between RJF and egg type of Mediterranean roots and true Bantams.
In respect to monophyletic theory, the evaluation of mtDNA-CR sequences employed by Niu et al. (Reference NIU, FU, LUO, RUAN, YU, CHEN and ZHANG2002) determined that the domesticated chicken originated from a single domestication event of RJF in Thailand and its neighbour regions. The neighbour joining tree depicted Chinese-egg breeds as genetically close to RJF (G.g. gallus). In addition, G.g. gallus and G.g. spadiceus should belong to one subspecies (continental populations), while G.g. bankiva, an island population, formed a separate cluster (Niu et al., Reference NIU, FU, LUO, RUAN, YU, CHEN and ZHANG2002).
On the other side, Nishibori et al. (Reference NISHIBORI, SHIMOGIRI, HAYASHI and YASUE2005) proposed the polyphyletic theory based on sequencing of whole mtDNA and two nuclear genomic-segments for species of genus Gallus. They found inter-species hybridizations between Grey JF and RJF and between Grey JF and Ceylon JF. Complying with the polyphyletic origin of chicken, Eriksson et al. (Reference ERIKSSON, LARSON, GUNNARSSON, BED´HOM, TIXIER-BOICHARD, STRÖMSTEDT, WRIGHT, JUNGERIUS, VEREIJKEN, RANDI, JENSEN and ANDERSSON2008) found that SNPs in the beta-carotene dioxygenase 2 gene causing yellow skin in many chicken do not originate from RJF but most likely from Grey JF. Moreover, the Sri-Lankan indigenous chicken had a higher mtDNA-CR haplotypic similarity to Red and Grey JF than to Ceylon JF (Silva et al., Reference SILVA, GUAN, HO-SHING, JONES, XU, HUI, NOTTER and SMITH2009).
The multiple regions and events of chicken domestication were suggested by Liu et al. (Reference LIU, WU, YAO, MIAO, LUIKART, BAIG, BEJA-PEREIRA, DING, PALANICHAMY and ZHANG2006a). They analyzed the mtDNA hypervariable-segment sequences for different chicken breeds across Eurasia and RJF in South and Southeast Asia. The phylogenetic analysis revealed nine clades, seven of which formed the continental types including domestic chicken and RJF in South and Southeast Asia. The major continental clades A, B and E were distributed mainly across Eurasia and the others restricted to South and Southeast Asia. Clade D contained gamecocks from China, Japan, and Madagascar, reflecting the effect of human culture of cockfighting on chicken dispersal. Haplotypes A1 and E1 were most frequent all over the world's chicken. These findings supported the theory of multiple domestication events of RJF in different parts of South and Southeast Asia such as China, Vietnam, Burma, Thailand and the Indian subcontinent.
In contrast to the historical records, the mtDNA study of Oka et al. (Reference OKA, INO, NOMURA, KAWASHIMA, KUWAYAMA, HANADA, AMANO, TAKADA, TAKAHATA, HAYASHI and AKISHINONOMIYA2007) revealed that non-game style chicken (Type C) were developed first which later spread to China (Types A and B). Game style chickens (Types D–G) were afterwards established from each type. Both non-game and game style chickens formed the foundation flock of Japanese native chicken. Muchadeyi et al. (Reference MUCHADEYI, EDING, SIMIANER, WOLLNY, GROENEVELD and WEIGEND2008) deduced with mtDNA data that Zimbabwean and some African populations have two maternal lineages in the Indian subcontinent and Southeast Asia (Clades A, C) but not in South China like do European and pure breeds (Clade B). In addition, it was reported by Gongora et al. (Reference GONGORA, RAWLENCE, MOBEGI, JIANLIN, ALCALDE, MATUS, HANOTTE, MORAN, AUSTIN, ULM, ANDERSON, LARSON and COOPER2008) that the modern South-American chicken breeds have three maternal lineages, primarily in Europe and the Indian subcontinent and less maternal lineages in South-China, Indonesia and Japan. They pointed out that the ancient Pacific and Chilean pre-Columbian chicken were within Eurasian clades with no support for Polynesian-South American contacts. However, there is still debate surrounding the origin of what is called Amerindian chicken before the Columbian period.
Based on microsatellite analyses, Bao et al. (Reference BAO, CHEN, WU, XU, WU, SHU and WEIGEND2007; Reference BAO, CHEN, LI, WU, SHU, WU, XU and WEIGEND2008) accentuated that there was a significant genetic difference between G. g. spadiceus in China and G. g. gallus in Thailand; with the first having a closer phylogenetic relationship with the Chinese domestic fowl than the second. Consequently, these studies support the theory of an independent origin of Chinese chicken and rejected considering RJFs in China and Thailand as the same subspecies (Bao et al., Reference BAO, CHEN, WU, XU, WU, SHU and WEIGEND2007; Reference BAO, CHEN, LI, WU, SHU, WU, XU and WEIGEND2008). Tadano et al. (Reference TADANO, NISHIBORI, IMAMURA, MATSUZAKI, KINOSHITA, MIZUTANI, NAMIKAWA and TSUDZUKI2008) noted that Japanese miniature chicken form a distinctive genetic pool from the supposed ancestor RJF with high genetic differentiation (FST = 0.39-0.51). Furthermore, Granevitze et al. (Reference GRANEVITZE, HILLEL, FELDMAN, SIX, EDING and WEIGEND2009) found Gallus gallus gallus; a supposed ancestor of domestic chicken, which assigned to several clusters, has nearly no affinity with European and white egg-layer clusters. Subsequently, many current studies evaluating molecular genomic and non-genomic variations denoted, there is no restricted phylogeographic centre of chicken domestication as did the other domestic livestock (Gongora et al., Reference GONGORA, RAWLENCE, MOBEGI, JIANLIN, ALCALDE, MATUS, HANOTTE, MORAN, AUSTIN, ULM, ANDERSON, LARSON and COOPER2008). The on-going controversial about chicken origins showed the need for further analyses using mtDNA diversity together with nuclear markers in a broader sampling spectrum all over the world.
Chicken genetic diversity
microsatellite diversity within-population microsatellite diversity
Characterisation of genetic diversity at the microsatellite level within and between different chicken populations collected from different countries was employed in some early studies. For instance, Ponsuksili et al. (Reference PONSUKSILI, WIMMERS and HORST1996) determined a large range of microsatellite variations within various local chicken breeds from 0.33% in Dandarawi and 0.35% in Fayoumi from Egypt, 0.50% in Nunakan from Indonesia to 0.63% in Kadaknath from India. Furthermore, Wimmers et al. (Reference WIMMERS, PONSUKSILI, HARDGE, VALLE-ZARATE, MATHUR and HORST2000) reported a high microsatellite diversity range in local subtropical chicken populations ranging from 45% in Aseel from India to 67% in Arusha from Tanzania.
On a broader array of assessment of chicken genetic diversity, the European AVIANDIV project genotyped pooled DNA samples collected from 52 distant chicken populations using 22 microsatellites (Hillel et al., Reference HILLEL, GROENEN, TIXIER-BIOCHARD, KOROLD, DAVID, KIRZHNER, BURKE, BARRE-DIRIEF, CROOIJMANS, ELO, FELDMAN, FREIDLIN, MÄKI-TANILA, OORTWIJN, THOMSON, VIGNAL, WIMMERS and WEIGEND2003). The involved populations were commercial broiler and layer lines, some experimental lines and non-commercial types of various origins (Asia, Africa and Europe), managements and histories as well as two RJF subspecies (G. g. spadiceus and G. g. gallus). Some follow up studies performed the individual genotyping for 65 different chicken populations using 29 microsatellites (Granevitze et al., Reference GRANEVITZE, HILLEL, CHEN, CUC, FELDMAN, EDING and WEIGEND2007; Hillel et al., Reference HILLEL, GRANEVITZE, TWITO, BEN-AVRAHAM, BLUM, LAVI, DAVID, FELDMAN, CHENG and WEIGEND2007). They concluded that wild, unselected and some conserved chickens possess the most genetic diversity and appear to be an important reservoir of polymorphisms. North-western European fancy breeds had lower genetic variation than Asian non-commercial populations, in consistency with their management history. They noted some fancy breeds showing high genetic variation such as Russian Yorlov crower and while others had low diversity like Italian Padovana and German Hamburger-Lackhuhn. The most private alleles were demonstrated in Russian Yorlov crower and Vietnamese H'mong, then in RJF, all with frequencies lower than 10%.
Across commercial lines, the broiler-lines showed significantly higher genetic diversity than layer-lines. Among commercial layers, brown egg-layers of multiple-parental origins were more diverse than white egg-layers of a single-parental origin. In this respect Vanhala et al. (Reference VANHALA, TUISKULA-HAAVISTO, ELO, VILKKI and MAKI-TANILA1998) and Tadano et al. (Reference TADANO, NISHIBORI, NAGASAKA and TSUDZUKI2007a) destined agreeable microsatellite findings within commercial lines reared in Finland and Japan, respectively. Moreover, Tadano et al. (Reference TADANO, NISHIBORI, NAGASAKA and TSUDZUKI2007a) detected negative FIS values within broilers and layers denoting excess heterozygosity due to line-breeding of their different grandparental lines.
Regarding the Chinese conserved chicken, Granevitze et al. (Reference GRANEVITZE, HILLEL, CHEN, CUC, FELDMAN, EDING and WEIGEND2007) found lower genetic variation within them than that measured by Gao et al. (Reference GAO, YANG, LI, WANG and TONG2004). The reported average of chicken genetic diversity based on the pooled DNA analysis by Hillel et al. (Reference HILLEL, GROENEN, TIXIER-BIOCHARD, KOROLD, DAVID, KIRZHNER, BURKE, BARRE-DIRIEF, CROOIJMANS, ELO, FELDMAN, FREIDLIN, MÄKI-TANILA, OORTWIJN, THOMSON, VIGNAL, WIMMERS and WEIGEND2003) was 47%, while that based on individual records by Granevitze et al. (Reference GRANEVITZE, HILLEL, CHEN, CUC, FELDMAN, EDING and WEIGEND2007) was 51%. The reported genetic diversity within chicken populations was lower than that within other livestock species (Hillel et al., Reference HILLEL, GROENEN, TIXIER-BIOCHARD, KOROLD, DAVID, KIRZHNER, BURKE, BARRE-DIRIEF, CROOIJMANS, ELO, FELDMAN, FREIDLIN, MÄKI-TANILA, OORTWIJN, THOMSON, VIGNAL, WIMMERS and WEIGEND2003).
Considering those publications interested in evaluation of native chicken genetic resources, a tangible high within-breed microsatellite diversity was noted within chicken strains from Iran, China, Turkey, Korea, Sudan, Southeast African countries (Muchadeyi et al., Reference MUCHADEYI, EDING, WOLLNY, GROENEVELD, SHAMSELDIN, SIMIANER and WEIGEND2007; Shahbazi et al., Reference SHAHBAZI, MIRHOSSEINI and ROMANOV2007; Bao et al., Reference BAO, CHEN, LI, WU, SHU, WU, XU and WEIGEND2008; Kaya and Yildiz, Reference KAYA and YILDIZ2008). In contrast, the Japanese native chicken implied low microsatellite variation in comparison with the other chicken types (Tadano et al., Reference TADANO, SEKINO, NISHIBORI and TSUDZUKI2007b; Reference TADANO, NISHIBORI, IMAMURA, MATSUZAKI, KINOSHITA, MIZUTANI, NAMIKAWA and TSUDZUKI2008). Nonetheless, Japanese Bantams displayed a distinctive gene pool encompassing the highest investigated unique alleles, 45.7% with frequencies higher than 20% (Tadano et al., Reference TADANO, NISHIBORI, IMAMURA, MATSUZAKI, KINOSHITA, MIZUTANI, NAMIKAWA and TSUDZUKI2008). For instance, 70% unique alleles detected in Zimbabwe chicken were at frequencies of < 1% (Muchadeyi et al., Reference MUCHADEYI, EDING, WOLLNY, GROENEVELD, SHAMSELDIN, SIMIANER and WEIGEND2007) and 71.4% private alleles possessed by 12 commercial lines had frequencies of < 10% (Tadano et al., Reference TADANO, NISHIBORI, NAGASAKA and TSUDZUKI2007a).
Across conserved chicken, Chinese ones showed a high microsatellite variation (Gao et al., Reference GAO, YANG, LI, WANG and TONG2004). Those from South-Africa showed lower microsatellite diversity while noticeable higher inbreeding measures (Marle-Köster et al., Reference MARLE-KÖSTER, HEFER, NEL and GROENEN2008). Although, those from Taiwan had the lowest diversity, they showed excess of heterozygosity (Berthouly et al., Reference BERTHOULY, BED'HOM, TIXIER-BOICHARD, CHEN, LEE, LALOE, LEGROS, VERRIER and ROGNON2008).
between-population microsatellite diversity
It was elucidated by Hillel et al. (Reference HILLEL, GROENEN, TIXIER-BIOCHARD, KOROLD, DAVID, KIRZHNER, BURKE, BARRE-DIRIEF, CROOIJMANS, ELO, FELDMAN, FREIDLIN, MÄKI-TANILA, OORTWIJN, THOMSON, VIGNAL, WIMMERS and WEIGEND2003) and Granevitze et al. (Reference GRANEVITZE, HILLEL, CHEN, CUC, FELDMAN, EDING and WEIGEND2007) that the most polymorphic populations are the closest to the others. Granevitze et al. (Reference GRANEVITZE, HILLEL, FELDMAN, SIX, EDING and WEIGEND2009) studied the structure of 65 chicken populations of different origins and histories using 29 microsatellites. They identified six main clusters of the studied chicken populations in agreement with their origins and histories. At K = 2, the Asian and European populations were clearly separated. However, the commercial broilers and Brown egg-layers exhibited an obvious admixture of these two main gene pools. At K = 3, these two commercial types formed a separate cluster which split into two distinct clusters at K = 6.
In contrast, the commercial white egg-layers based on a narrow genetic-base distinguished from the European cluster only at K = 6. At K = 5, a group of populations with no common history (Fayoumi, Green Legged Partidge, C inbred-line) clustered together far from all other populations. Seven populations (Thueringer Barthuehner, Kastilianer, Malay, Gallus gallus gallus, Malawi, Godollo Nhx and Orlov) were admixed with several clusters encompassing a multi-cluster group. These multi-clustered populations were observed by Hillel et al. (Reference HILLEL, GROENEN, TIXIER-BIOCHARD, KOROLD, DAVID, KIRZHNER, BURKE, BARRE-DIRIEF, CROOIJMANS, ELO, FELDMAN, FREIDLIN, MÄKI-TANILA, OORTWIJN, THOMSON, VIGNAL, WIMMERS and WEIGEND2003) and Granevitze et al. (Reference GRANEVITZE, HILLEL, CHEN, CUC, FELDMAN, EDING and WEIGEND2007) as highly polymorphic populations. Granevitze et al. (Reference GRANEVITZE, HILLEL, FELDMAN, SIX, EDING and WEIGEND2009) found European northern and western chicken differentiated from European middle, eastern and southern chicken. The total genetic variation between chicken populations was 34 %, partitioned into 11% between clusters and 23% between populations within clusters Granevitze et al. (Reference GRANEVITZE, HILLEL, FELDMAN, SIX, EDING and WEIGEND2009).
The noticeable high microsatellite variations were also reported between the highly selected and inbred chicken populations: Finnish lines (30%, Vanhala et al., Reference VANHALA, TUISKULA-HAAVISTO, ELO, VILKKI and MAKI-TANILA1998), pure-bred commercial lines (36%, Muchadeyi et al., Reference MUCHADEYI, EDING, WOLLNY, GROENEVELD, SHAMSELDIN, SIMIANER and WEIGEND2007), Japanese commercial lines (29%, Tadano et al., Reference TADANO, NISHIBORI, NAGASAKA and TSUDZUKI2007a), Japanese native long tailed and miniature breeds (38% Tadano et al., Reference TADANO, SEKINO, NISHIBORI and TSUDZUKI2007b and 43%, Tadano et al., Reference TADANO, NISHIBORI, IMAMURA, MATSUZAKI, KINOSHITA, MIZUTANI, NAMIKAWA and TSUDZUKI2008, respectively). Some local and conserved chicken breeds exhibited large between-breed microsatellite differentiation like those from Hungary (22%) France (19%), China (16%), South-Africa (0.13%) (Bao et al., Reference BAO, CHEN, LI, WU, SHU, WU, XU and WEIGEND2008; Berthouly et al., Reference BERTHOULY, BED'HOM, TIXIER-BOICHARD, CHEN, LEE, LALOE, LEGROS, VERRIER and ROGNON2008; Marle-Köster et al., Reference MARLE-KÖSTER, HEFER, NEL and GROENEN2008; Bodzsar et al., Reference BODZSAR, EDING, REVAY, HIDAS and WEIGEND2009). The determined genetic variation between chicken populations was the highest gained among the other farm animals and human populations (Granevitze et al., Reference GRANEVITZE, HILLEL, FELDMAN, SIX, EDING and WEIGEND2009). On the contrary, the lowest between-population microsatellite diversity was recorded between native African village chicken such as Zimbabwean, Malawian, Sudanese, Ethiopian, Kenyan and Ugandan chicken-ecotypes (Muchadeyi et al., Reference MUCHADEYI, EDING, WOLLNY, GROENEVELD, SHAMSELDIN, SIMIANER and WEIGEND2007; Mwachro et al., 2007). However, the genetic subdivision was only identified between chicken of distant African countries (Mwachro et al., 2007).
Utilizing microsatellite data obtained by the AVIANDIV project as a framework was undertaken by Berthouly et al. (Reference BERTHOULY, BED'HOM, TIXIER-BOICHARD, CHEN, LEE, LALOE, LEGROS, VERRIER and ROGNON2008) who used this successfully to study contribution of French and Asian chicken breeds to the total diversity. They found Egyptian Fayoumi has the highest between-breed diversity contribution and French Marans has the highest aggregate diversity over all breeds. Moreover, Bodzsar et al. (Reference BODZSAR, EDING, REVAY, HIDAS and WEIGEND2009) noted, the Hungarian chicken breeds contribute more genetic diversity to the set of European chicken populations than to the set of commercial lines.
SNP diversity
There are some recent studies that utilised SNPs in chicken biodiversity characterisation. Twito et al. (Reference TWITO, WEIGEND, BLUM, GRANEVITZE, FELDMAN, PERL-TREVES, LAVI and HILLEL2007) genotyped 25 unlinked SNPs which map in genes or neighbouring regions (gSNPs) for 20 distant chicken populations selected from the AVIANDIV-project. Results were similar to those obtained by microsatellites used in the AVIANDIV-project. However, the most diverse population at the gSNP level was a conserved Hungarian breed, Godollo Nhx, and then unselected populations, but RJF exhibited a moderate variation. The mean value of gSNP diversity (bi-allelic marker of low mutation rate) was 24% which is obviously lower than that of microsatellites (multi-allelic marker of higher recurrent mutation rate). These 25 gSNPs were able to cluster 20 populations like 29 microsatellites. They concluded the more SNPs studied, the higher clustering success gained.
Regarding commercial lines, Andreescu et al. (Reference ANDREESCU, AVENDANO, BROWN, HASSEN, LAMONT and DEKKERS2007) assessed linkage disequilibrium (LD) extent and consistency to characterise biodiversity of nine commercial broiler-lines using high-density SNP genotyping on chromosome 1 and 4. They reported that LD within broiler-lines extends over shorter distances than estimated in other livestock breeding populations. Furthermore, they detected a high range of LD correlations between broiler-lines, concluding, the higher LD correlation between lines the more LD consistency between them is expected.
Moreover, Muir et al. (Reference MUIR, WONG, ZHANG, WANG, GROENEN, CROOIJMANS, MEGENS, ZHANG, OKIMOTO, VEREIJKEN, JUNGERIUS, ALBERS, LAWLEY, DELANY, MACEACHERN and CHENG2008) calculated the amount of missing genomic alleles within commercial pure lines in comparison to the established genomic-diversity for ancestral and non-commercial populations. They determined that more than 50% of ancestral genetic-diversity is absent in commercial broiler and layer lines. Contrariwise, microsatellite and SNP results obtained by the AVIANDIV-project revealed a high genetic diversity within broiler-lines.
There are some studies that utilised SNPs efficiently to characterise chicken biodiversity in relation to their domestication. Downing et al. (2009) explored high SNP diversity at chicken lysozyme gene by sequencing it in seven different Asian and African village chicken populations, one commercial broiler-line and Gallus species. Within-population SNP-diversity was 90.6% and among-population SNP-diversity 9.4 %. There was only one coding-site segregating at intermediate frequency across domestic chicken and another coding-site fixed between them and RJF. Therefore, this could reflect the effect of pathogen-driven selection on the observed allelic-distribution in modern chicken.
Rubin et al. (Reference RUBIN, ZODY, ERIKSSON, MEADOWS, SHERWOOD, WEBSTER, JIANG, INGMAN, SHARPE, T, KA, HALLBÖÖK, BESNIER, CARLBORG, Ö., BED`HOM, TIXIER-BOICHARD, JENSEN, SIEGEL, P and K. AND ANDERSSON2010) estimated heterozygosity in pooled-sequence data from three groups including all domestic lines (36 different populations of European and Asian origins), two broiler-lines and three layer-lines. The strongest selective sweeps in all domestic chicken occurred at the thyroid stimulating hormone receptor (TSHR) gene indicating that this TSHR sweep is related to the absence of seasonal reproduction in modern chicken. Broilers showed many selective sweeps in genes associated with growth, appetite and metabolic regulation.
mtDNA control-region diversity
Within fancy and commercial chicken populations, the Chinese and Japanese fancy chicken exhibited higher mtDNA-CR haplotype diversity (h) than European fancy and commercial populations (Liu et al., Reference LIU, ZHU and YAO2006b; Muchadeyi et al., Reference MUCHADEYI, EDING, SIMIANER, WOLLNY, GROENEVELD and WEIGEND2008). Muchadeyi et al. (Reference MUCHADEYI, EDING, SIMIANER, WOLLNY, GROENEVELD and WEIGEND2008) reported a higher level of h within commercial brown egg-layers than broilers, while both types possessed greater haplotype diversity than white egg-layers.
The native chicken breeds displayed a variable degree of genetic diversity considering mtDNA-CR sequence variations which ranges from high in Sri-Lankan chicken (Silva et al., Reference SILVA, GUAN, HO-SHING, JONES, XU, HUI, NOTTER and SMITH2009), middle in Zimbabwean and Indian chicken (Pirany et al., Reference PIRANY, ROMANOV, GANPULE, DEWAGOWDA and PRASAD2007; Muchadeyi et al., Reference MUCHADEYI, EDING, SIMIANER, WOLLNY, GROENEVELD and WEIGEND2008), to low in Chinese, Japanese and some African native chicken (Niu et al., Reference NIU, FU, LUO, RUAN, YU, CHEN and ZHANG2002; Oka et al., Reference OKA, INO, NOMURA, KAWASHIMA, KUWAYAMA, HANADA, AMANO, TAKADA, TAKAHATA, HAYASHI and AKISHINONOMIYA2007; Muchadeyi et al., Reference MUCHADEYI, EDING, SIMIANER, WOLLNY, GROENEVELD and WEIGEND2008).
Between-population mtDNA-CR sequence diversity gave evidence that native Chinese-egg breeds are genetically distant from Chinese-general purpose breeds (Niu et al., Reference NIU, FU, LUO, RUAN, YU, CHEN and ZHANG2002). On the contrary, Zimbabwe and Sri-Lankan native chicken ecotypes showed no sub-division regarding mtDNA-CR sequence diversity (Muchadeyi et al., Reference MUCHADEYI, EDING, SIMIANER, WOLLNY, GROENEVELD and WEIGEND2008; Silva et al., Reference SILVA, GUAN, HO-SHING, JONES, XU, HUI, NOTTER and SMITH2009).
Conclusions
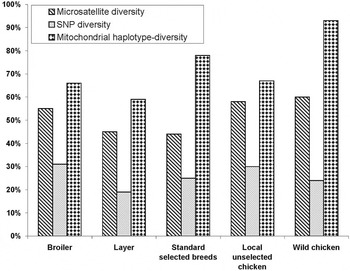
Local and village chickens are serving as dynamic entities for the sustainable development of chicken resources. Commercial chickens of limited genetic-base lost a considerable amount of polymorphisms; however they are quite diverse and possess high LD consistency. Although a remarkable extensive genetic diversity is seen among domestic chickens (Figure 1) which showed no restricted origins, they exhibited strong allelic-fixation at the TSHR-gene to hide the seasonal reproduction during chicken domestication.
Genetic diversity of a wide range of non-overlapping chicken populations categorized according to their management history using different markers.